Article

Enhancement of Exit Flow Uniformity by Modifying the Shape of a Gas Torch to Obtain a Uniform Temperature Distribution on a Steel Plate during Preheating

1
School of Mechanical and Automotive Engineering, University of Ulsan, Ulsan 44610, Korea
2
Faculty of Mechanical Engineering, Ho Chi Minh City University of Technology (HCMUT), Ho Chi Minh City 700000, Vietnam
*
Author to whom correspondence should be addressed.
Appl. Sci. 2018, 8(11), 2197; https://doi.org/10.3390/app8112197
Submission received: 14 October 2018 / Revised: 31 October 2018 / Accepted: 6 November 2018 / Published: 9 November 2018
(This article belongs to the Special Issue Welding of Steels)

Abstract

:

Featured Application

A gas torch can be used for preheating in welding applications. New gas torches were designed by modifying the inner and outer structures, which led to uniform flow at the outlet and enhanced the temperature uniformity of a steel plate during preheating. The torches were examined through a numerical and experimental study.

Abstract

The objective of this study is to improve the exit flow uniformity of a gas torch with multiple exit holes for effective heating of a steel plate. The torch was simulated, and combustion experiments were performed for validation. Based on a basic model, three different revised models were designed and analyzed with the software ANSYS FLUENT 18.2. The flow uniformity (γ) of the velocity distribution at the multiple exit holes was investigated with the pressure drop ranging from 100 to 500 Pa. The basic model had flow uniformity ranging from 0.849 to 0.852, but the three new models had γ1 = 0.901–0.912, γ2 = 0.902–0.911, and γ3 = 0.901–0.914, respectively. The maximum percentage difference of the flow uniformity index between the three new models and the basic model was 7.3%. The basic model with nonuniform flow distribution made a temperature difference of the back side of the steel plate from the center to the edge of around 229 °C, while the modified model with uniform flow distribution had a smaller temperature difference of 90 °C. The simulation results showed good agreement with our experimental results for both the basic model and the modified model. The modified gas torch made a wider and more uniform temperature distribution on a preheated steel plate than the basic one. The results revealed that a trade-off between cost and flow uniformity, as well as the new gas torch, could be applied to a steel-plate preheating process before welding.

1. Introduction

Preheating is a process applied to raise the temperature of a steel plate before welding. A uniform temperature distribution on the steel plate has a significant influence on the welding process. The flame and the flow have to be uniformly distributed at the outlet of the gas torch. Therefore, in recent years, many researchers have improved the uniformity of the fluid distribution at the outlets of the equipment.
Liu et al. [1,2,3] studied the effect of the geometrical structure and relevant parameters of three kinds of models with a T-shape, tree-shape, and circular-shape flow channel bifurcation. They studied the effect of the flow channel bifurcation structure and dimensions on the flow uniformity by a computational fluid dynamics (CFD) method [4]. They found that the best structure had high flow uniformity and less pressure loss. Huang et al. [5] investigated the uniform distribution design and a performance evaluation for UU-type parallel mini hydrocyclones. The results showed that the nonuniformity became larger with an increase in the ratio of the overflow tube diameter to the intake distribution header diameter.
Commenge et al. studied a multiscale reactor design of isothermal laminar flow networks and optimal design for flow uniformity [6,7]. They analyzed the influence of the geometrical dimensions of the reactor microstructure on the velocity distribution. Lou et al. experimentally studied the structure and geometrical dimensions of a construct distributor in mini cross-flow heat exchanger [8]. They found that the integration of the construct distributor could homogenize the fluid flow distribution. They also optimized the baffled and multiscale uniform flow distribution [9,10].
Lalot et al. [11] investigated the flow distribution and the effect of flow nonuniformity on the performance of heat exchangers. They found that flow nonuniformity led to the loss of effectiveness by up to 25% for a cross-flow exchanger. Fan et al. [12] studied the flow distribution of a 2D construct distributor by an experiment with one inlet and 16 outlets to obtain the smallest energy dissipation and shortest residence time. The results showed that the standard flow rate deviation changed from 0.05 to 0.069 when all the outlets were opened. Purimetla et al. studied the burner secondary airflow and optimized the baffle position to balance the secondary air flow [13]. They found that the numerical and experiment method were in good agreement for wide-open and half-open cases.
Zhang et al. [14] optimized the uniformity at the outlet of a gas mixing system of a premixed burner and found that the uniformity of the flow rate and fuel gas mixing of different ejectors increased by 1.9% and 2.2%, respectively. Heggemann et al. [15] investigated the uniformity of fluid flow in liquid distributors. They found that the measuring tolerance could be quantified as 4.4% at minimum load and 3% at nominal load. Perta et al. [16] investigated the uniform velocity distribution in the wind tunnel configurations. They found that the guiding channels showed the best aerodynamic performance among four flow distribution devices.
Many researchers have investigated the heat transfer characteristics of an impinging flame with a single nozzle through analysis and numerical simulation method by CFD [17,18,19]. Yu et al. investigated the heat transfer phenomena on a plate with an impinging electric field flame [20]. They found that electric fields affected the heat flux distribution when the plate was above the flame tip. Liu et al. [21] studied the characteristics of diesel spray impingement based on the droplet impact phenomenon. The results showed that the maximum spray height and radius at 2.8 ms were 10.2 mm and 29.3 mm, respectively.
There has been much research about flow distribution but less so about uniform flow distribution for a gas torch with multiple holes impinging on a steel plate for preheating. Because of the nonuniform flow at the outlet of a gas torch, the temperature distribution on the steel plate is also nonuniform. Therefore, it significantly affects the steel preheating process before welding.
This study aims to improve the exit flow uniformity by modifying the inner and outer shape of a gas torch for preheating a steel plate. For easy handling, the model was manufactured with one inlet and multiple outlets. The problem of the basic model is nonuniform flow at the outlet of the gas torch with high velocity at the center region and low velocity at the edge. Hence, three kinds of models were designed to enhance uniform flow distribution at the outlets of the gas torch. Moreover, the temperature distribution on the back side of a steel plate was examined for the basic and modified gas torch models after combustion at the torch exit with multiple holes.

2. Description of Steel Preheating Process and Gas Torch Models

2.1. Description of Steel Preheating Process

Figure 1 shows steel-plate preheating by a gas torch using liquefied petroleum gas (LPG) as the fuel. The LPG passes the flow rate gauge and then enters the gas torch. In addition, compressed air enters the gas torch for combustion. The fuel and the compressed air are mixed together inside the torch. After leaving the exits, the fuel/air mixture is ignited, and the combustion flame is then used for preheating the steel plate. The steel plate in this study had a width, length, and thickness of 0.8 m, 1.5 m, and 0.02 m, respectively. Due to the nonuniform flow at the outlets of the basic model, the flame is also nonuniform during the preheating process of the steel plate, as shown in Figure 1a. Consequently, the temperature distribution at the back side of the steel plate is also nonuniform when using the basic gas torch model. Hence, three modified models were designed to enhance the flow uniformity at the outlets of the gas torch, as shown in Figure 1b.

2.2. The Basic Gas Torch Model

A diagram of a basic gas torch is shown in Figure 2. The basic gas torch is made of stainless steel and consists of one inlet and multiple outlets. The dimensions are listed in Table 1. A cylindrical tube with a diameter of 35 mm is connected to a rectangular block with 115 exit holes at the bottom surface. The fuel/air mixture enters the inlet at gauge pressure ranging from 100 to 500 Pa. Then, the flow spreads to the two sides of the gas torch and leaves the outlet holes.

2.3. Three New Models

Figure 3 shows the three new models used to improve the flow distribution at the outlets, which were compared with the basic model. The detailed dimensions of the inner and outer shapes of the new models are shown in Table 2. Model 1 had a long perforated strip that was divided into four parts with different hole diameters from the center to the right and left ends. The holes in the center region had a diameter of 3 mm. From the center hole to the end hole, the diameters sizes were followed by proportions of α = 1, 1.17, 1.33, and 1.5, respectively. The inlet flow approached the long perforated strip and split to the two sides along the strip. Part of the flow passed through the strip holes and then mixed together with the other flows.
Model 2 had a reverse Y-branch (two symmetric bypass pipes in the inlet region), a two-stage diffuser in the center flow region, and a cut corner shape at both ends. The two bypass pipes had a diameter of 15 mm. The angle and height of the bypass pipe based on the center pipe were 45 degrees and 63 mm, respectively. The two stages of the diffuser had angles of 160 degrees. Model 3 had an enlarged inlet with triangular shapes. The two triangle-shape parts had a height of 63 mm, an angle of 45 degrees, a short perforated strip in the center flow region, and a cut corner shape at both ends.

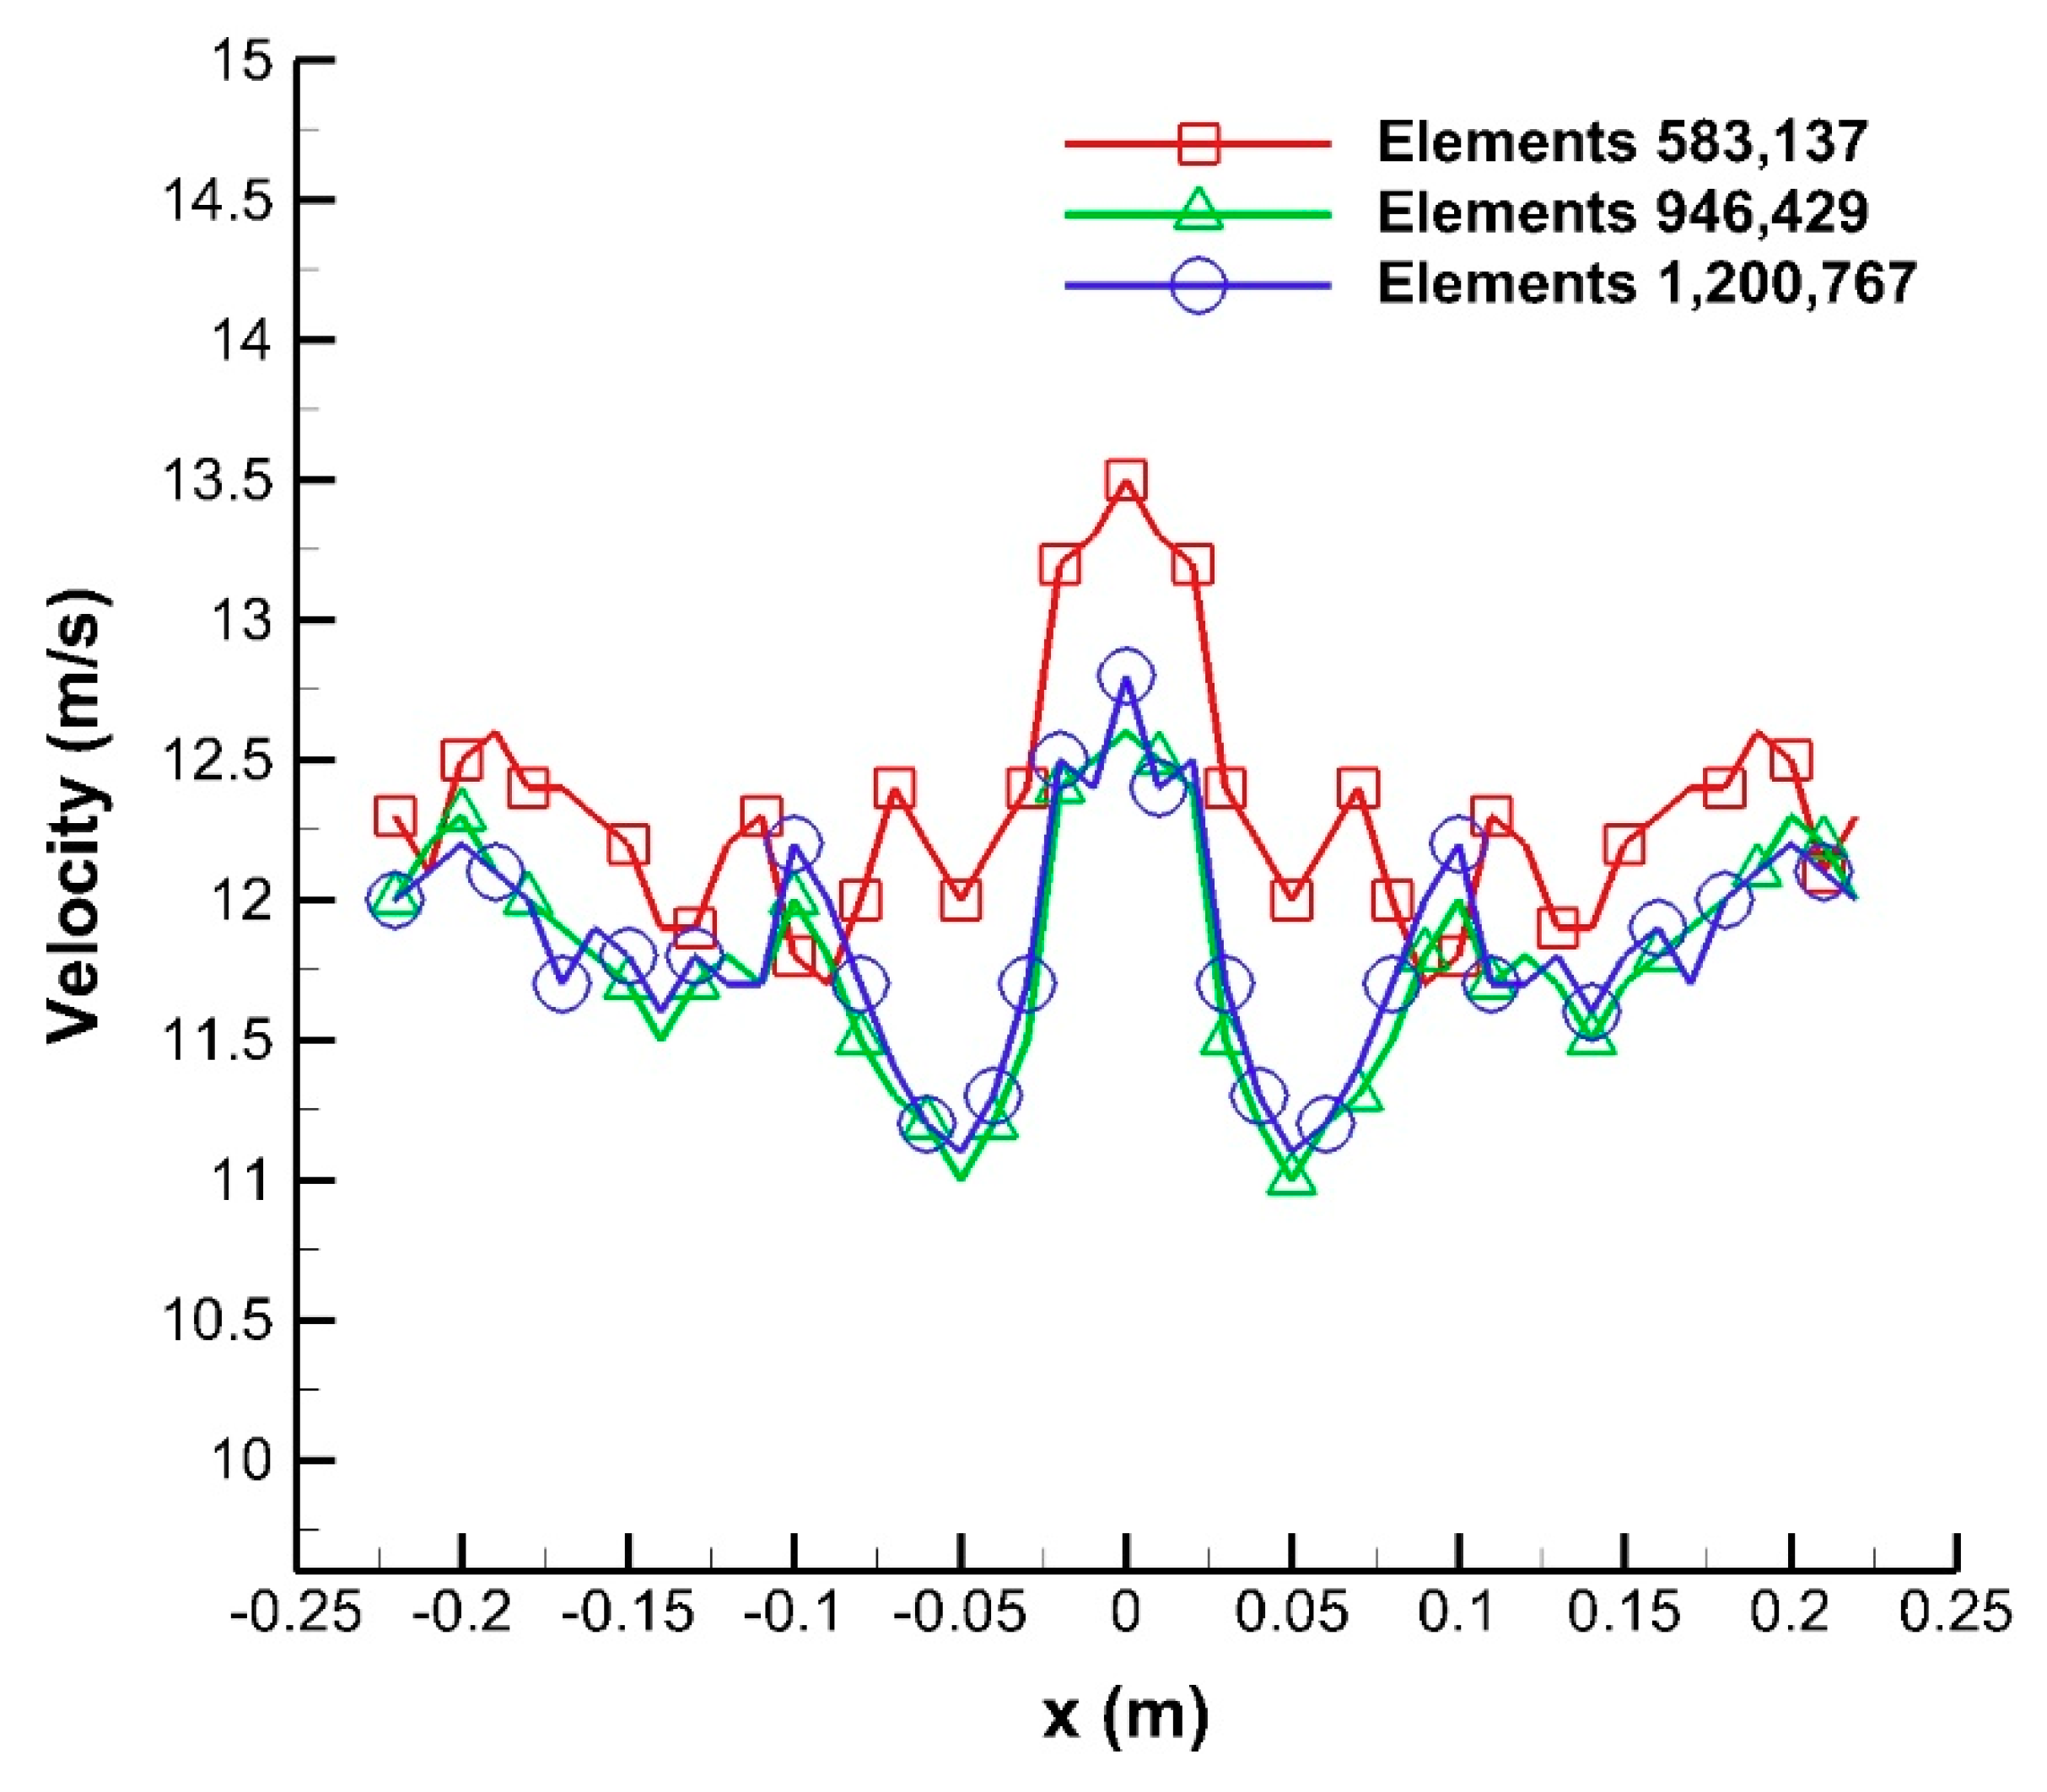
3. Numerical Simulation

Steady-state numerical simulations were done using ANSYS FLUENT 18.2 software based on finite volume discretization. The boundary conditions and numerical method for the basic and modified gas torches are shown in Table 3. The standard k-ε turbulence model was used in this study. The SIMPLE algorithm was adopted for coupling the pressure and velocity in the simulation. For more accuracy, the second-order upwind scheme was selected for the spatial discretization. The convergence criterion was set up as 10−4 for the momentum, continuity, and turbulence equations.
The numerical simulation was conducted to investigate the velocity profile inside and at the outlets of the gas torches. The meshes and boundary conditions of the basic model are shown in Figure 4. The inlet boundary condition was set as a pressure inlet of the fuel/air mixture. An ambient pressure outlet boundary condition was set at the outlet of the gas torch. A no-slip wall boundary condition was set for the other sides of the torch.
The governing equations for the continuity, momentum, kinetic energy, and dissipation energy of the turbulence model are the following:
Continuity equation:
. ( ρ u ) = 0  
Momentum equation:
. ( ρ u u ) = p + . ( μ + μ t ) [ ( u + u T ) 2 3 . u I ]  
The turbulence kinetic energy k and the rate of its dissipation ε are obtained from the following transport equations:
x i ( ρ k u i ) = x j [ ( μ + μ t σ k ) k x j ] + G k ρ ε  
x i ( ρ ε u i ) = x j [ ( μ + μ t σ ε ) ε x j ] + C 1 ε ε k G k C 2 ε ρ ε 2 k  
The turbulent viscosity is modeled as follows:
μ t = ρ C μ k 2 ε  
The production of turbulence kinetic energy is defined as follows:
G k = ρ u i u j ¯ u j x i  
ρ u i u j ¯ = μ t ( u i x j + u j x i ) 2 3 ( ρ k + μ t u k x k ) δ j  
The model constants C1ε, C2ε, Cµ, σk, and σε have the following default values: C1ε = 1.44, C2ε = 1.92, Cµ = 0.09, σk = 1.0, and σε = 1.3. Before investigating the velocity behavior of the gas torch, a grid independence check was carried out by changing the amounts of elements to 583,137, 946,429, and 1,200,767, as shown in Figure 5. To reduce the computation time, 946,429 elements were selected as the amount to simulate the gas torch fluid domain.

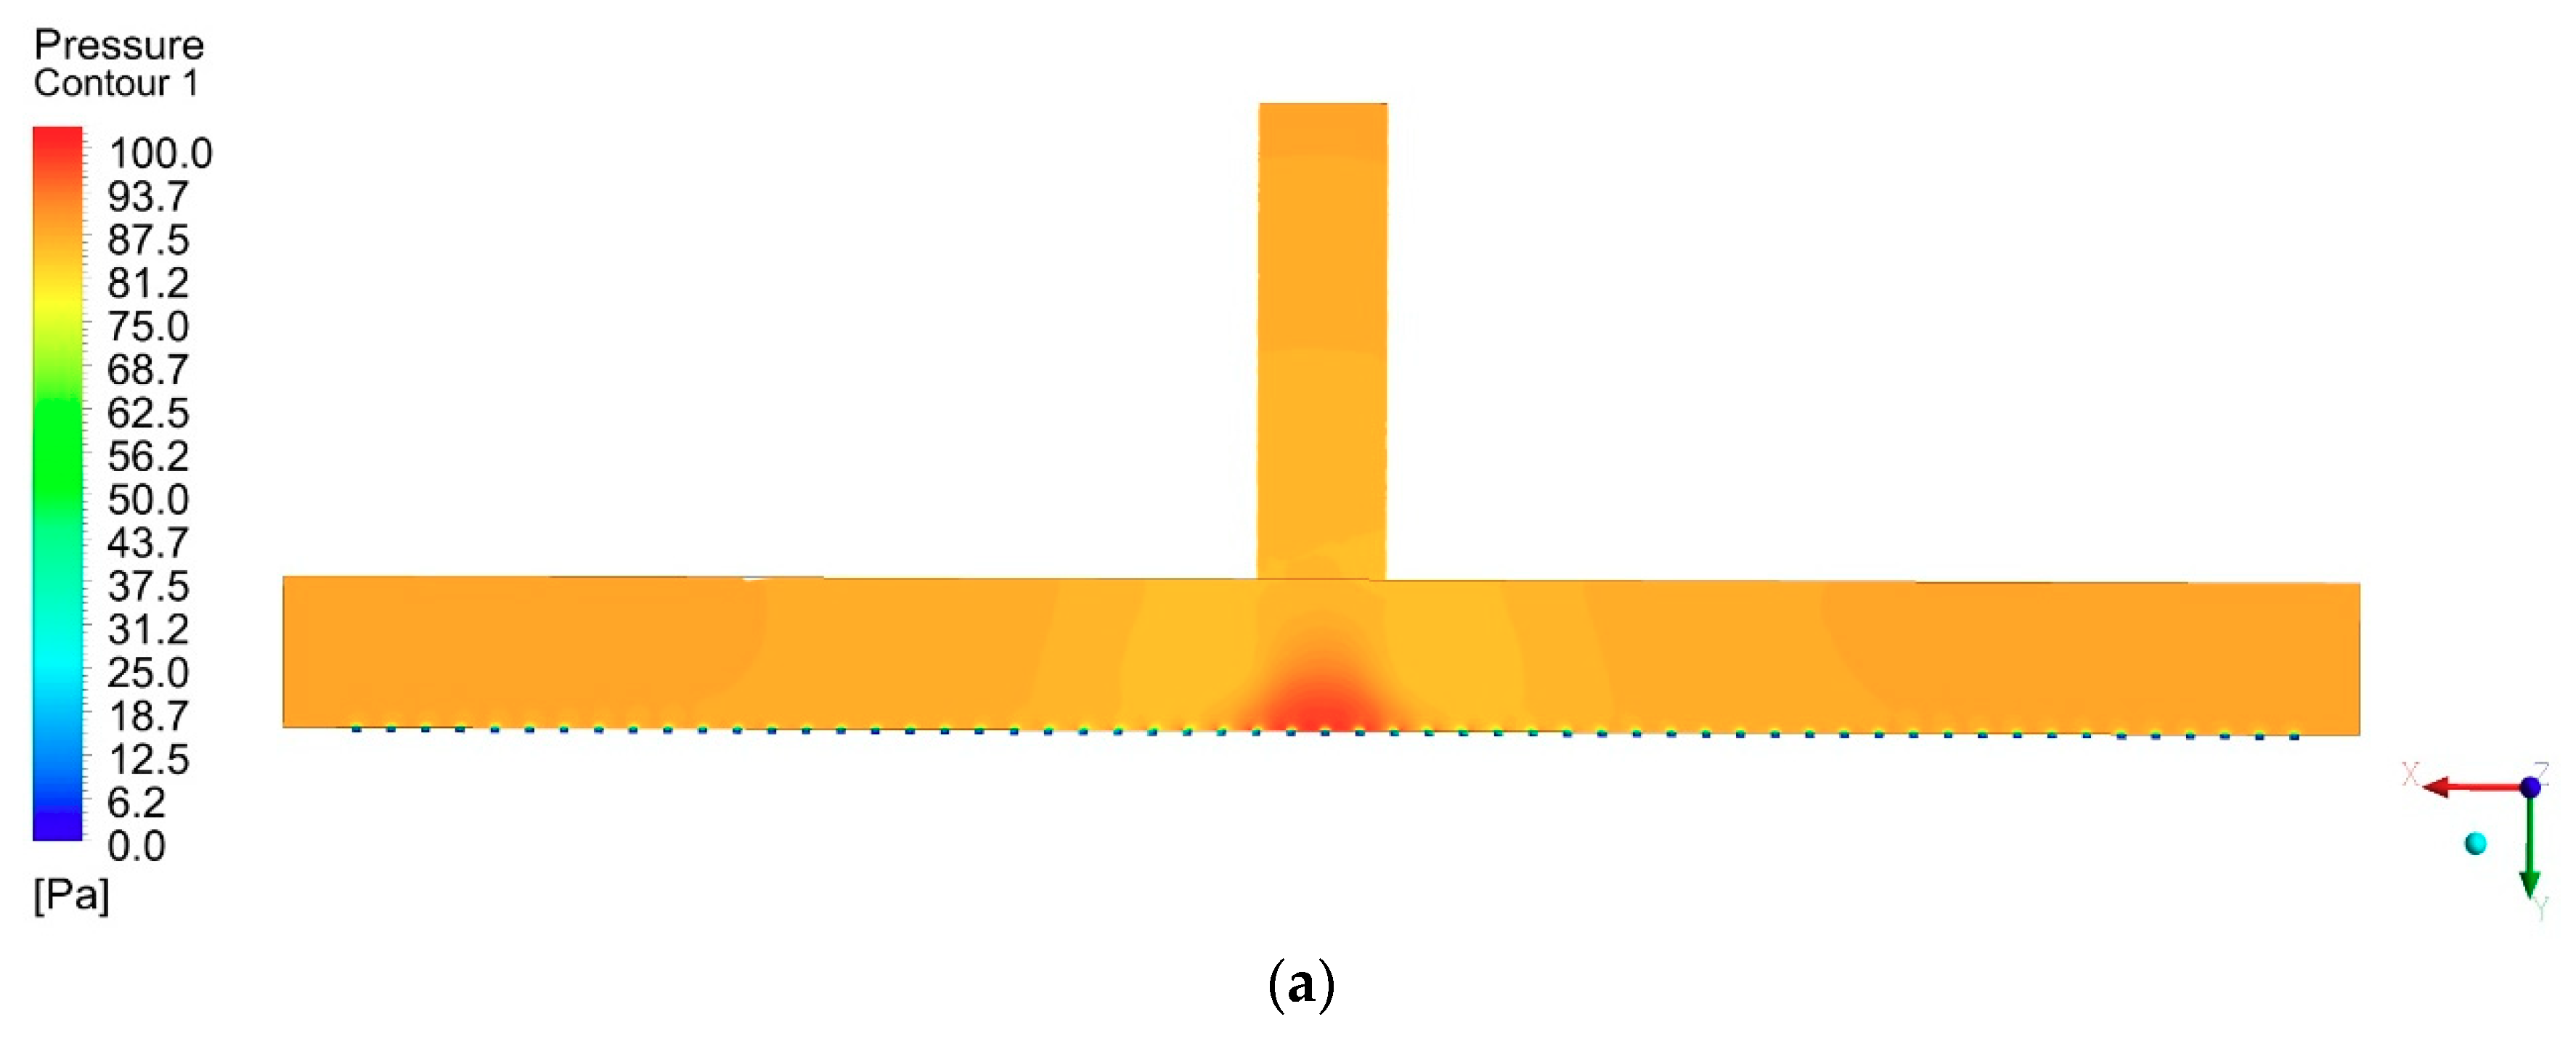
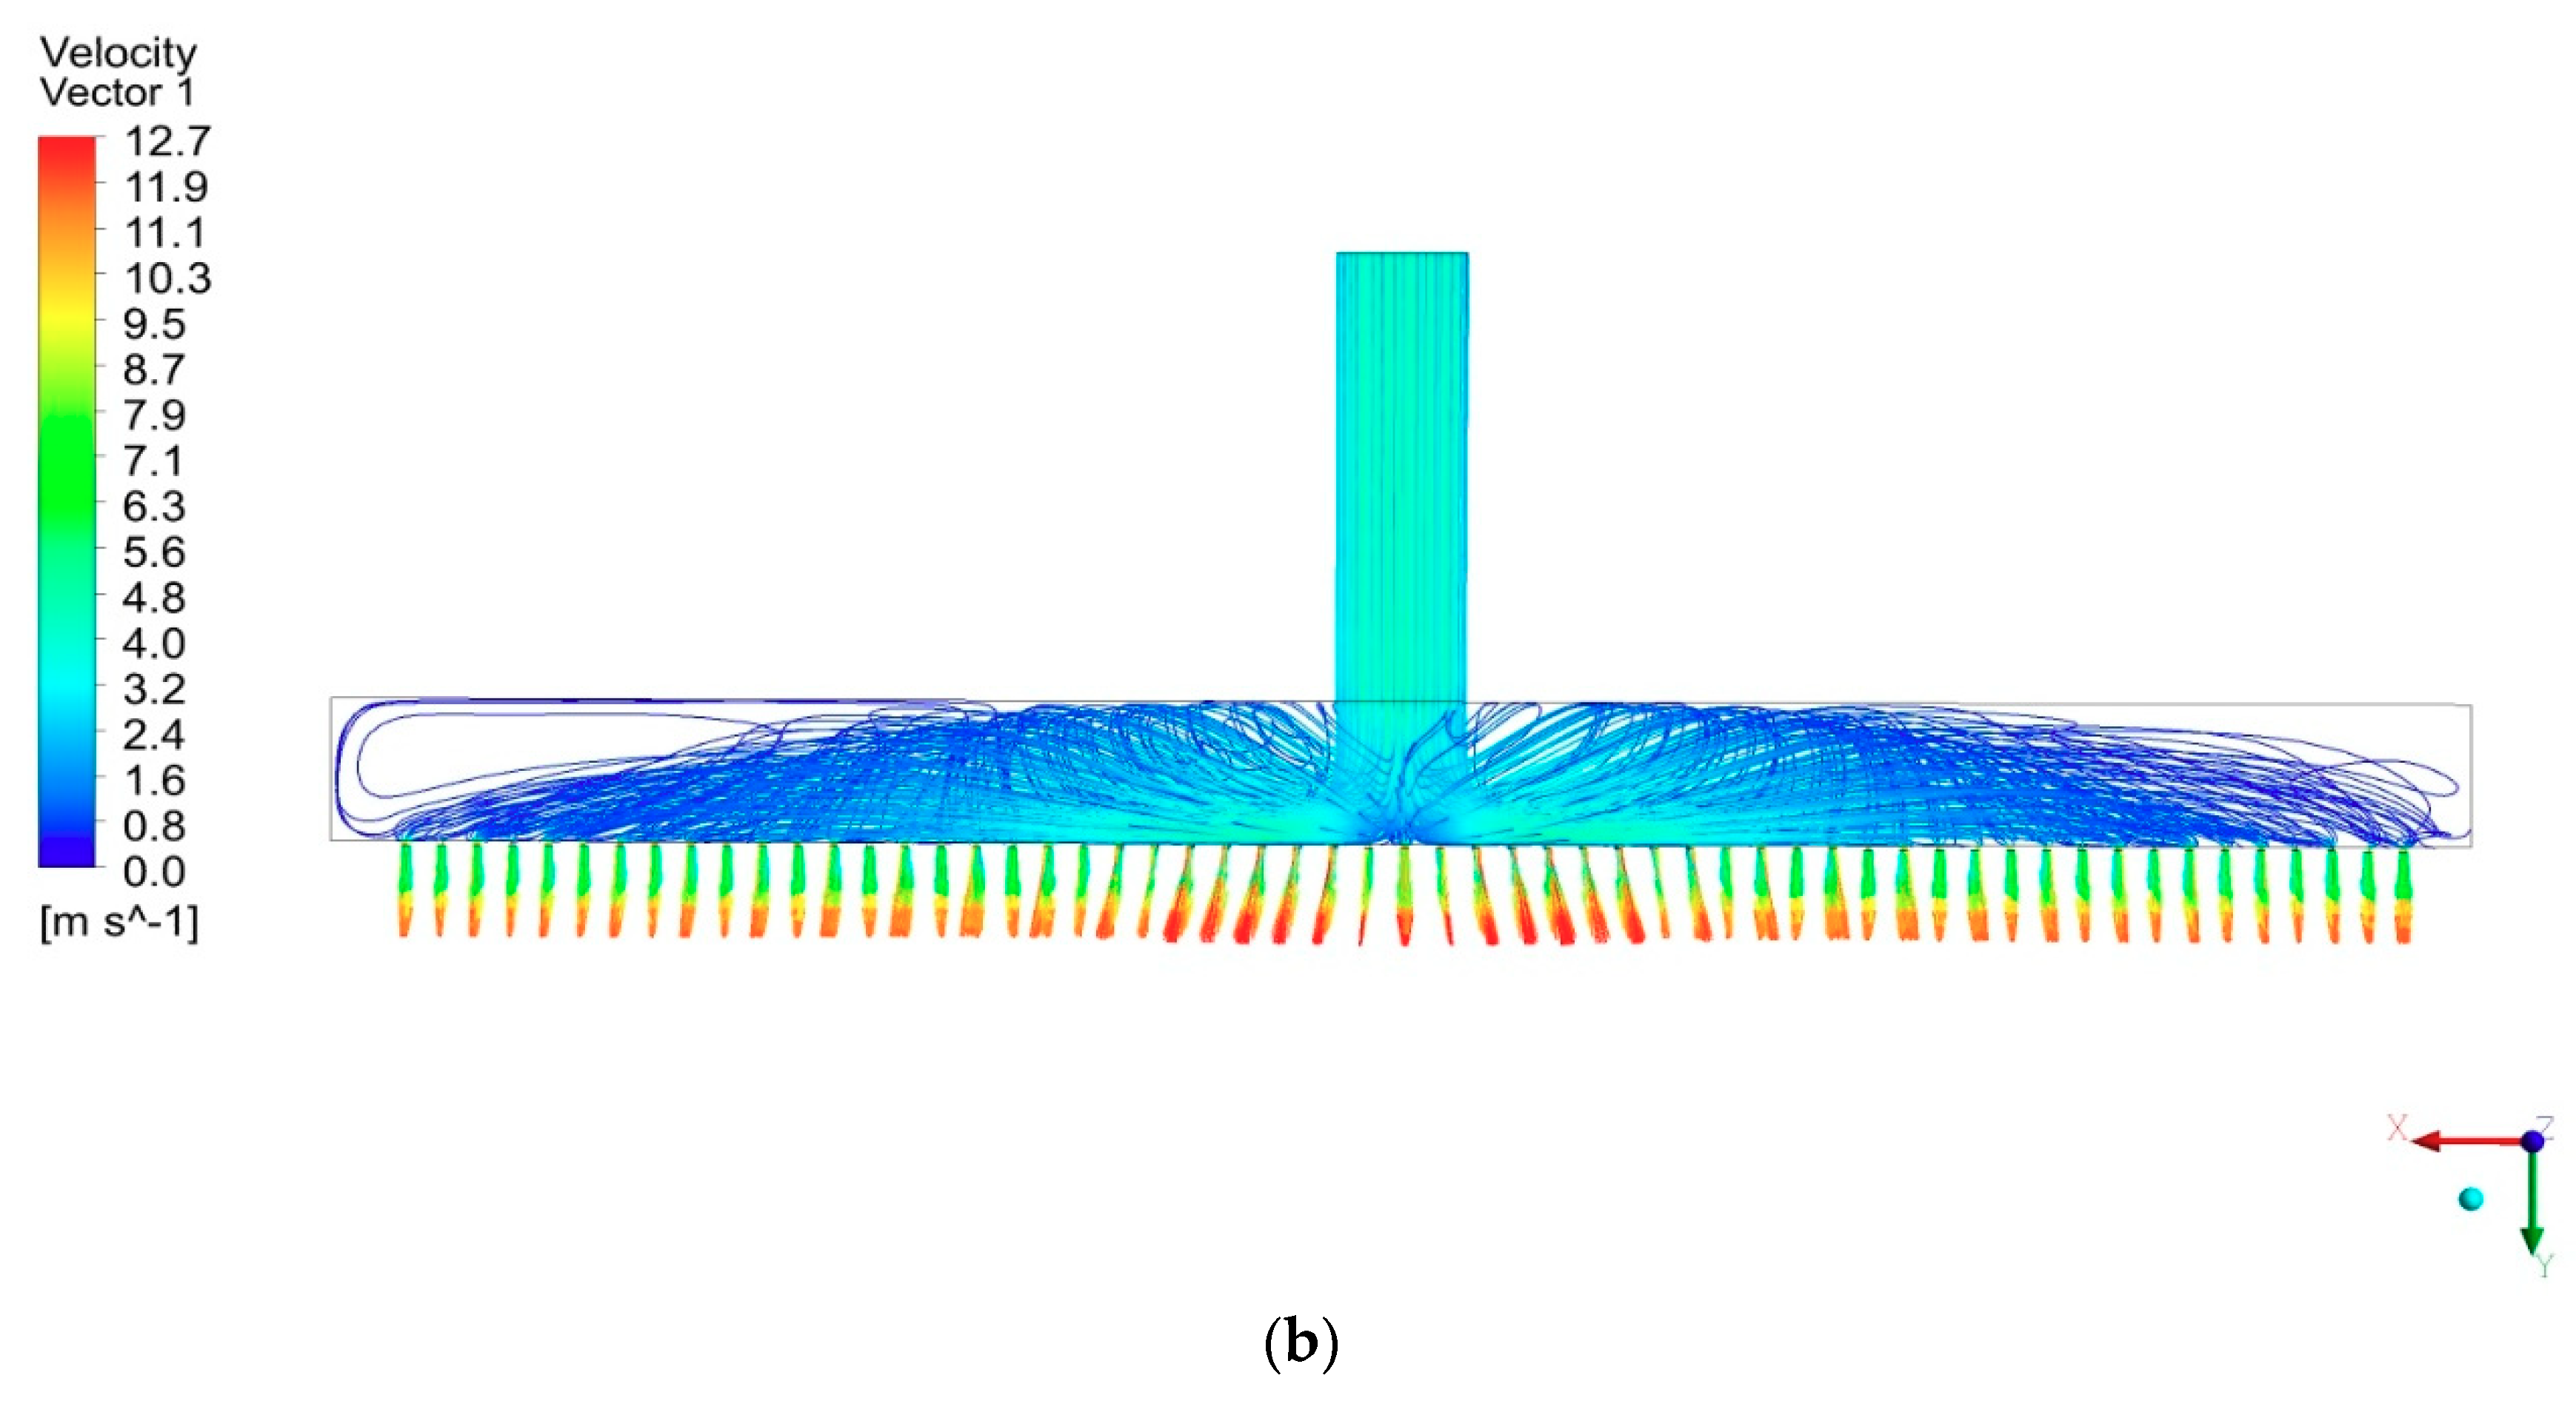
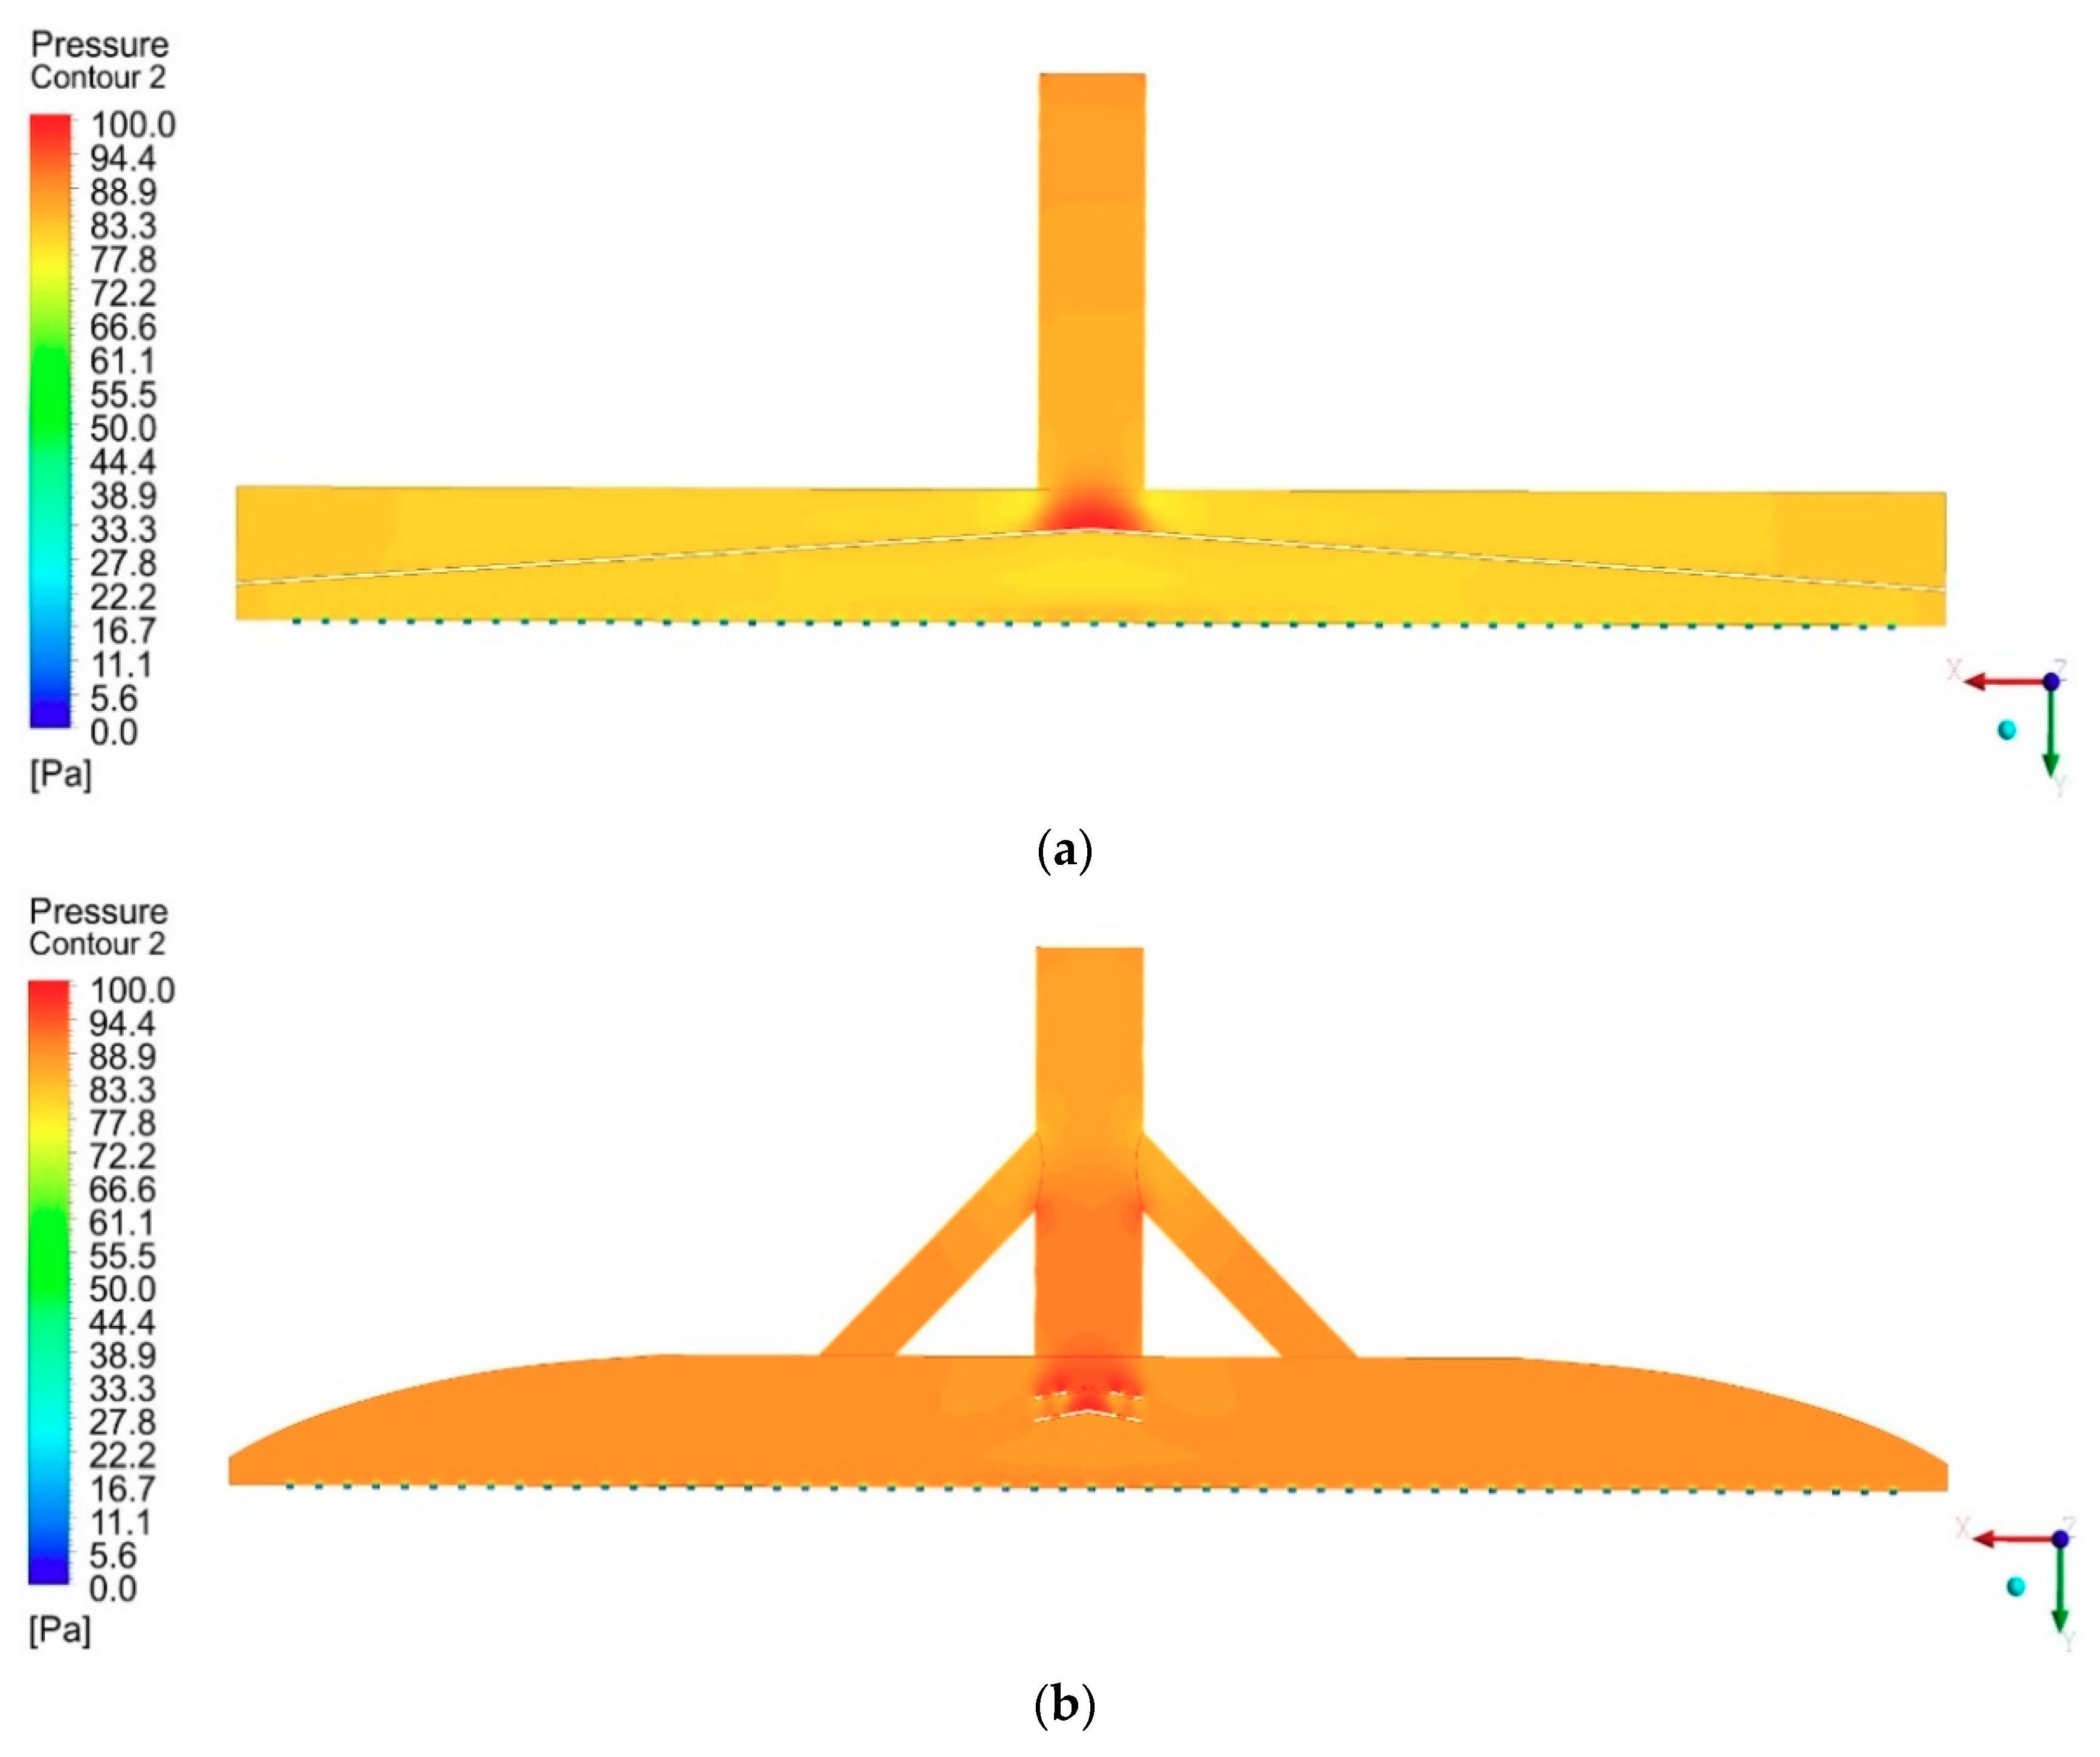
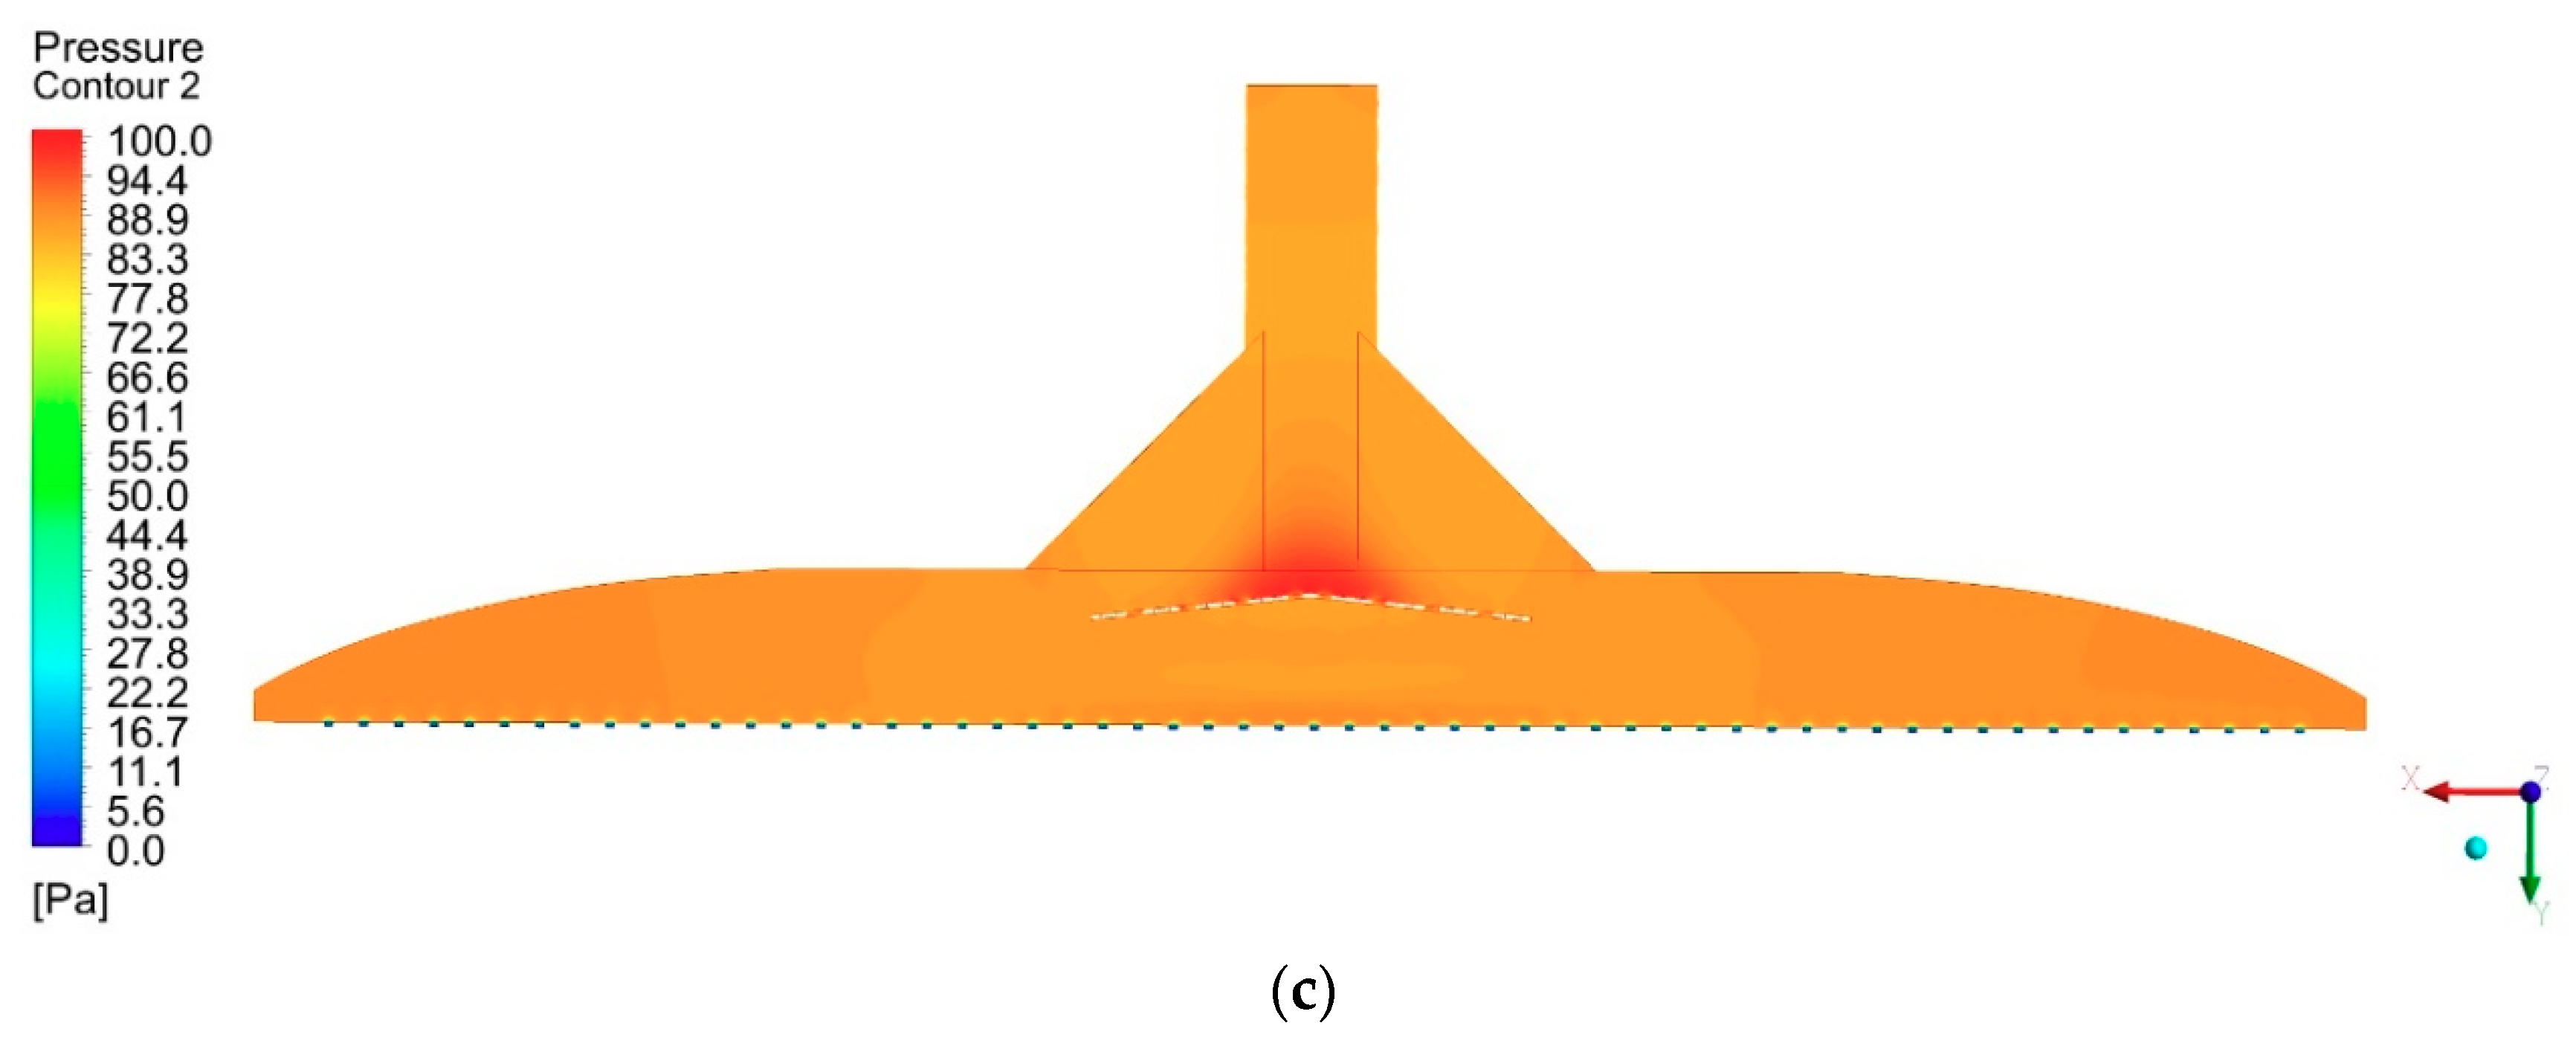
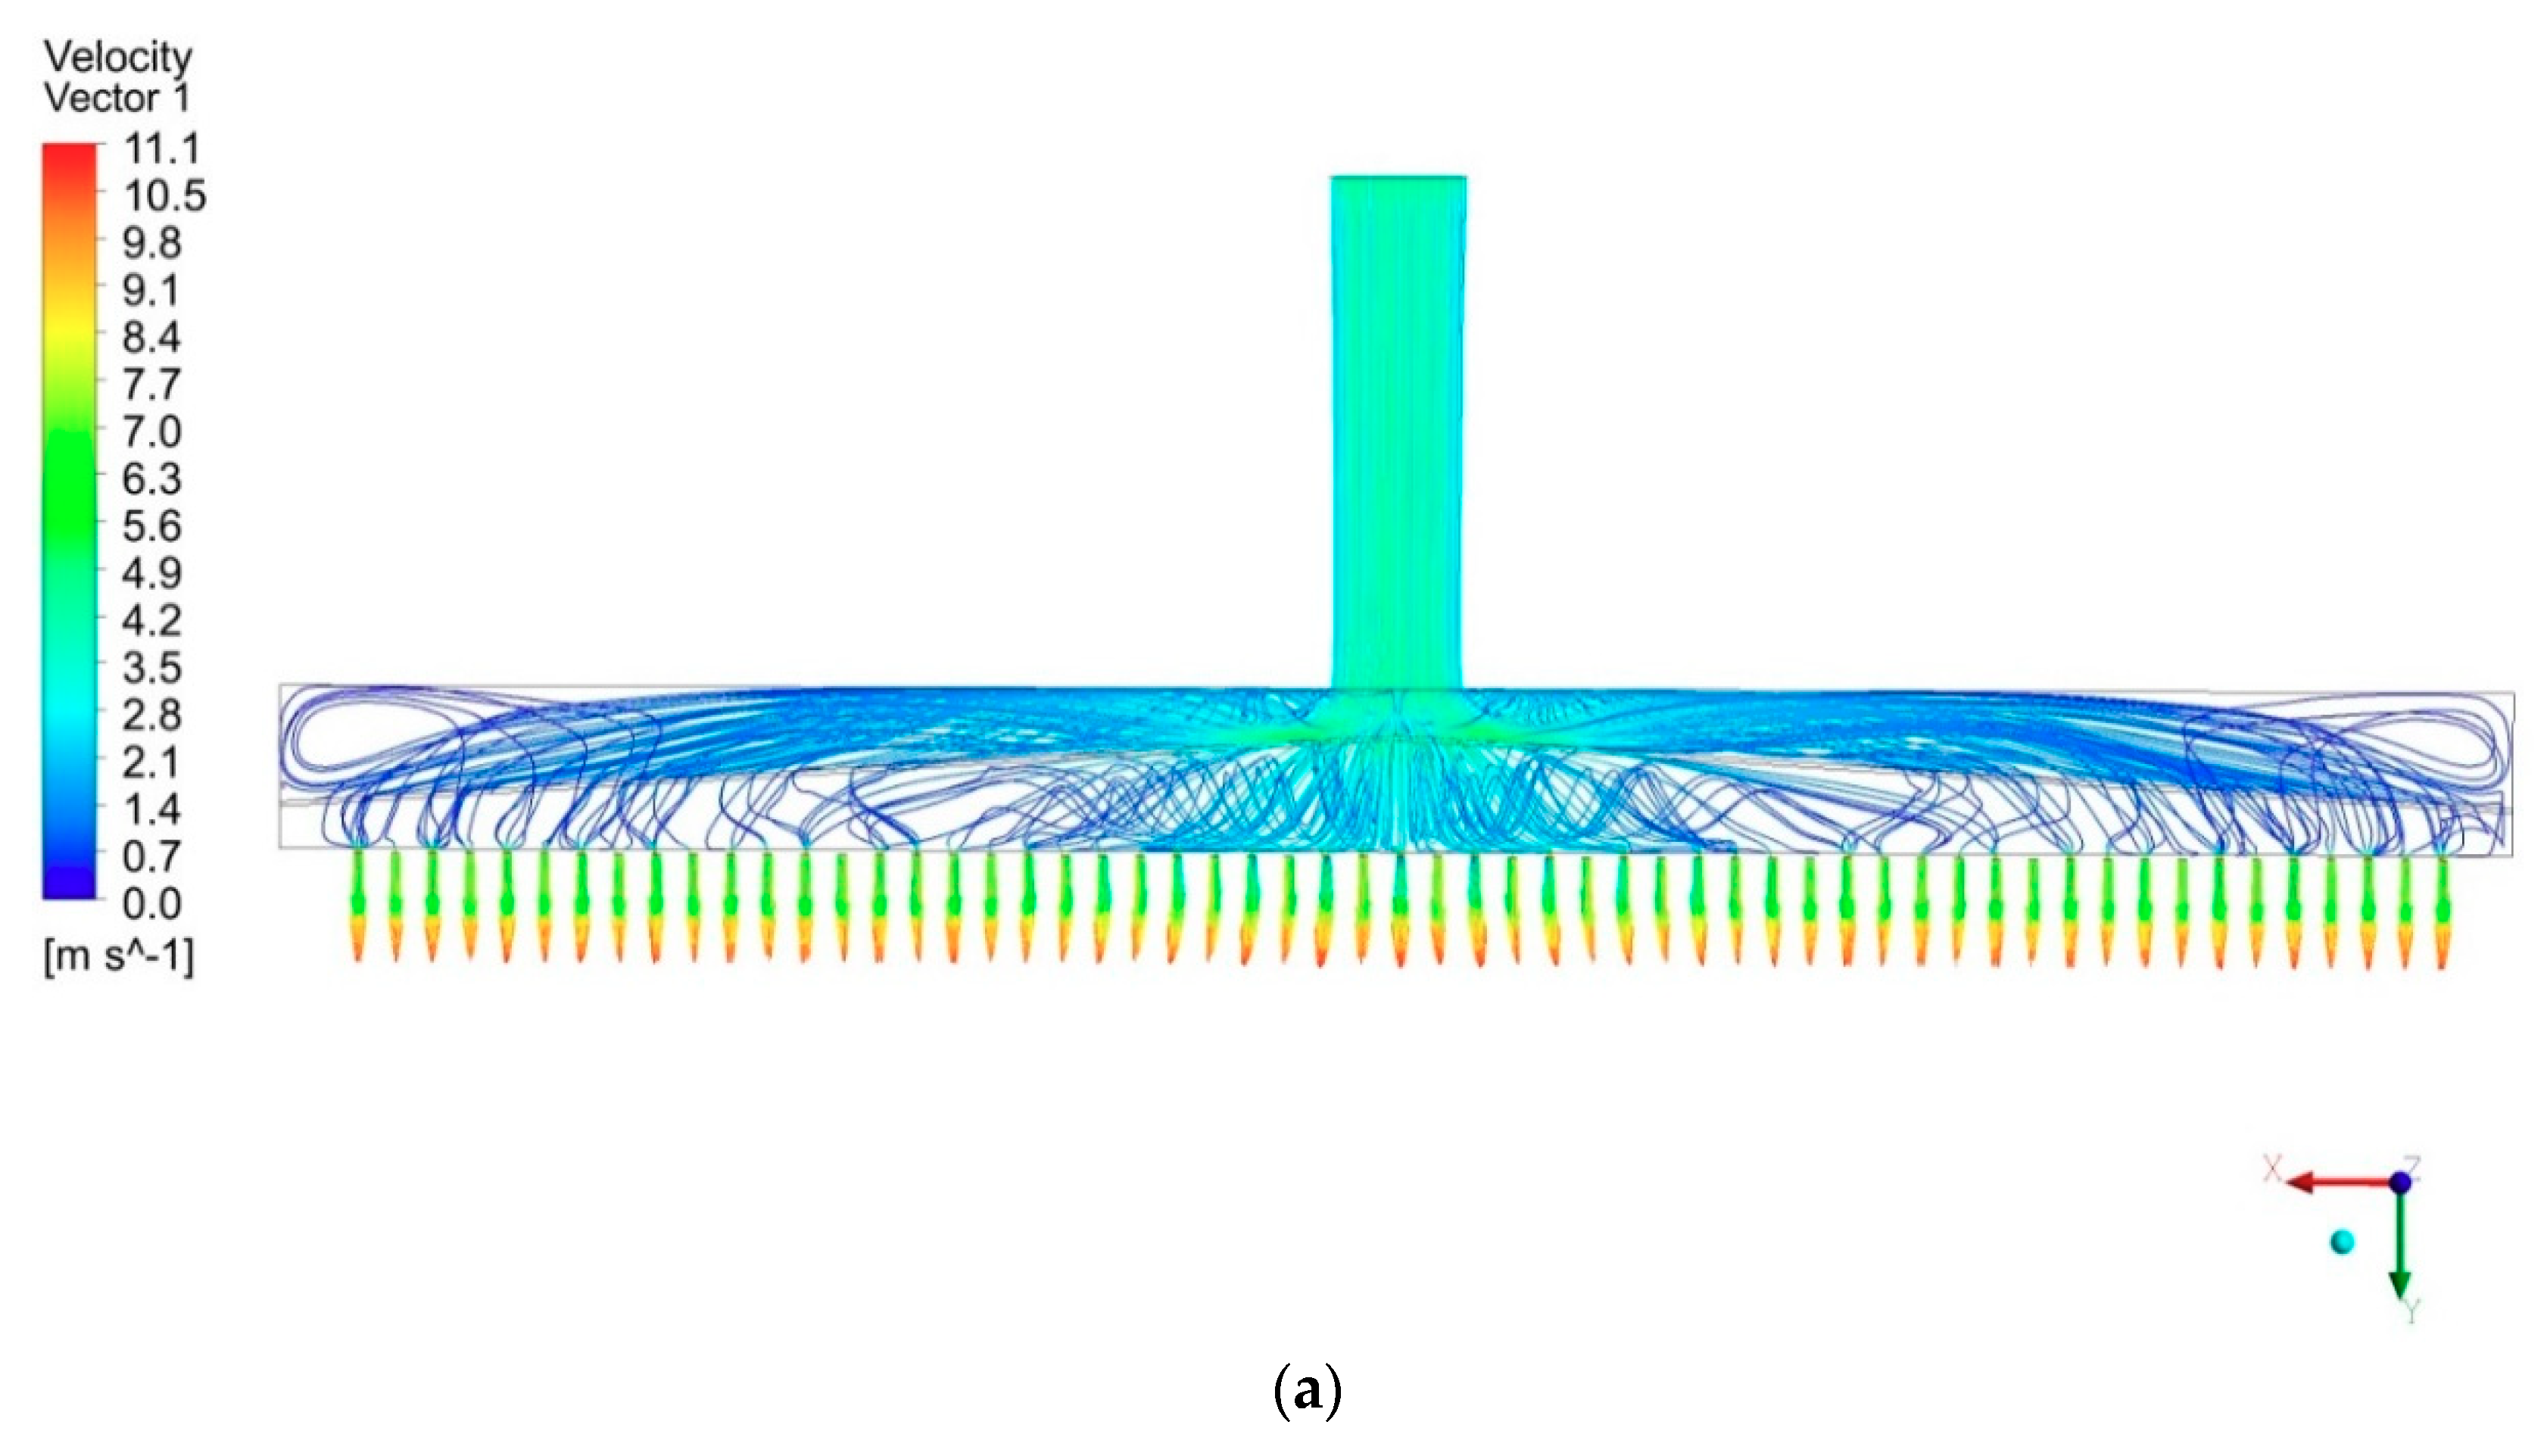
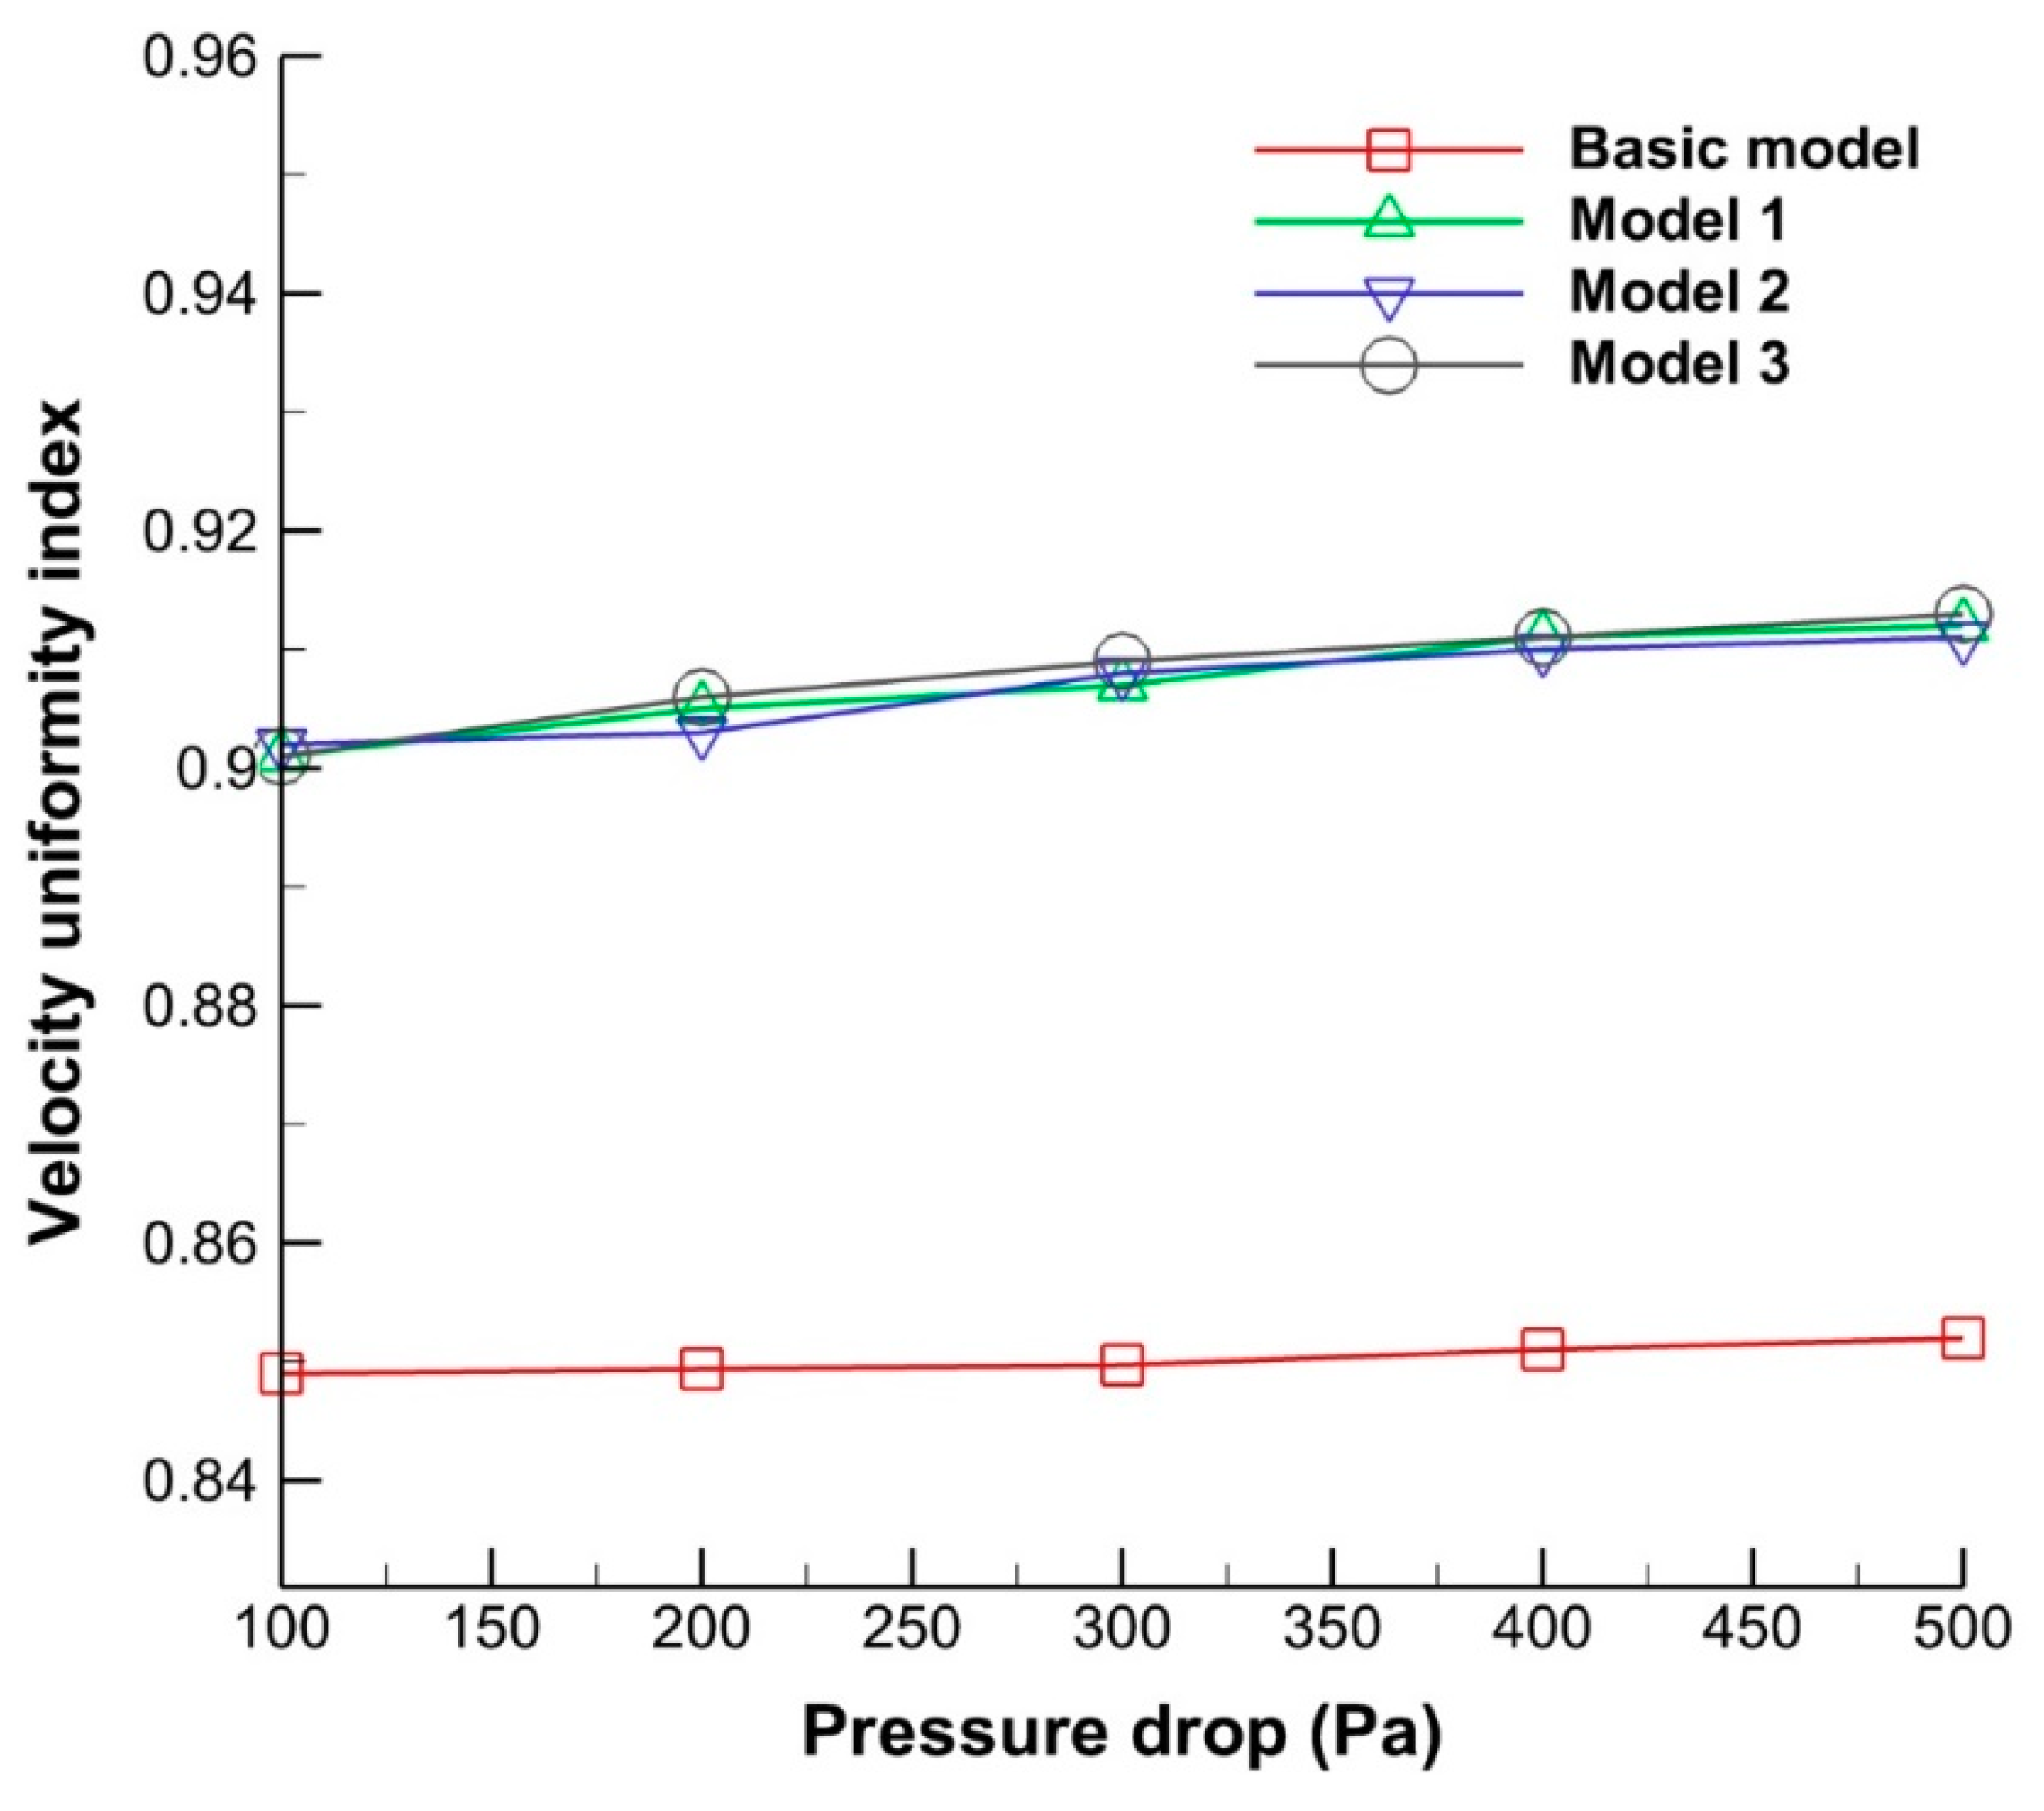
4. Comparison of Pressure Drop and Flow Field Distribution between the Basic and Modified Models

Figure 6a shows the pressure contours at the mid-plane, and Figure 6b shows the streamlines and velocity vectors of the basic gas torch. The flow tended to concentrate in the center region, and two corner sides of the gas torch had very low velocity. Hence, the exit velocity was high in the center region and low in the right and left side regions, as shown in Figure 6b. Consequently, the flow distribution at the outlet was nonuniform.
Figure 7 shows the pressure contours at the mid-plane of the three new models. Due to the flow impinging on the guide vanes at the center of the three modified models, the highest pressure was observed at the top on the guide vanes. The pressure then decreased as the central flow spread towards the right and left side regions. Compared with the basic model, all three new models had uniform pressure at the outlets of the gas torches. This led to enhanced uniformity of the flow velocity at the outlet.
The inner streamlines and velocity vectors at the outlets of the three new gas torches are shown in Figure 8. The highest velocity of all three models was around 11.1 m/s, which was less than velocity of 12.7 m/s of the basic model. In model 1, with a long perforated plate, one part of the flow passed through the perforated plate directly, and the rest spread to the two sides. In model 2, the main flow went through the diffuser with many holes, and the two split flows went through the two smaller pipes to produce uniform exit flow.
Model 3 was expected to operate with combined characteristics of model 1 and model 2 because it had combined structures from the inner strip from model 1 and the enlarged inlet and corner cuts at both sides from model 2. It was clear that there was a uniform velocity distribution at the outlets of the three new models. In these cases, the high velocity at the center was reduced, and the two side velocities were increased. Thus, the velocity uniformity along the x-direction was remarkably improved.
The exit velocity distribution along the lengthwise x-direction of the basic torch and new torches is shown in Figure 9. The flow velocity from the left side to the right side of the basic gas torch was around 11 to 12.7 m/s. The highest velocity was concentrated in the center region of the torch. Therefore, the flow distribution at the outlet of the basic torch was nonuniform. All three modified models had similar shapes of the velocity distribution from the left to the right of the torch. By modifying the inner and outer shapes of the torches, the flow field distribution along the x-direction became uniform from the left to the right side. This uniform flow at the outlets of the torches led to a uniform temperature distribution of the steel plate during the preheating process.
To evaluate the uniformity of the flow fields at the outlet of the torches, the velocity uniformity index was utilized as follows:
γ = 1 m = 1 n ( | u m u a ¯ | A m ) 2 | u a ¯ | m = 1 n A m  
where
u a ¯ = m = 1 n u m A m m = 1 n A m  
Here, γ is the velocity uniformity index, and n is the total number of outlet positions. um is the velocity at the mth position, and u a ¯ is the mean of all the velocities. The value of γ is between 0 and 1, and γ = 1 indicates a perfectly uniform distribution [21]. Figure 10 shows a comparison of the velocity uniformity index at the outlets between the basic torch and the three new torches as a function of the pressure drop. The velocity uniformity of the basic model was the lowest and ranged from 0.849 to 0.852. However, the three new models had high values of γ1 = 0.901–0.912, γ2 = 0.902–0.911, and γ3 = 0.901–0.914, respectively. The maximum percentage increase in the uniformity index between the three new models and the basic model was 7.3%. As the pressure drop increased, the velocity uniformity index of the three modified models increased.

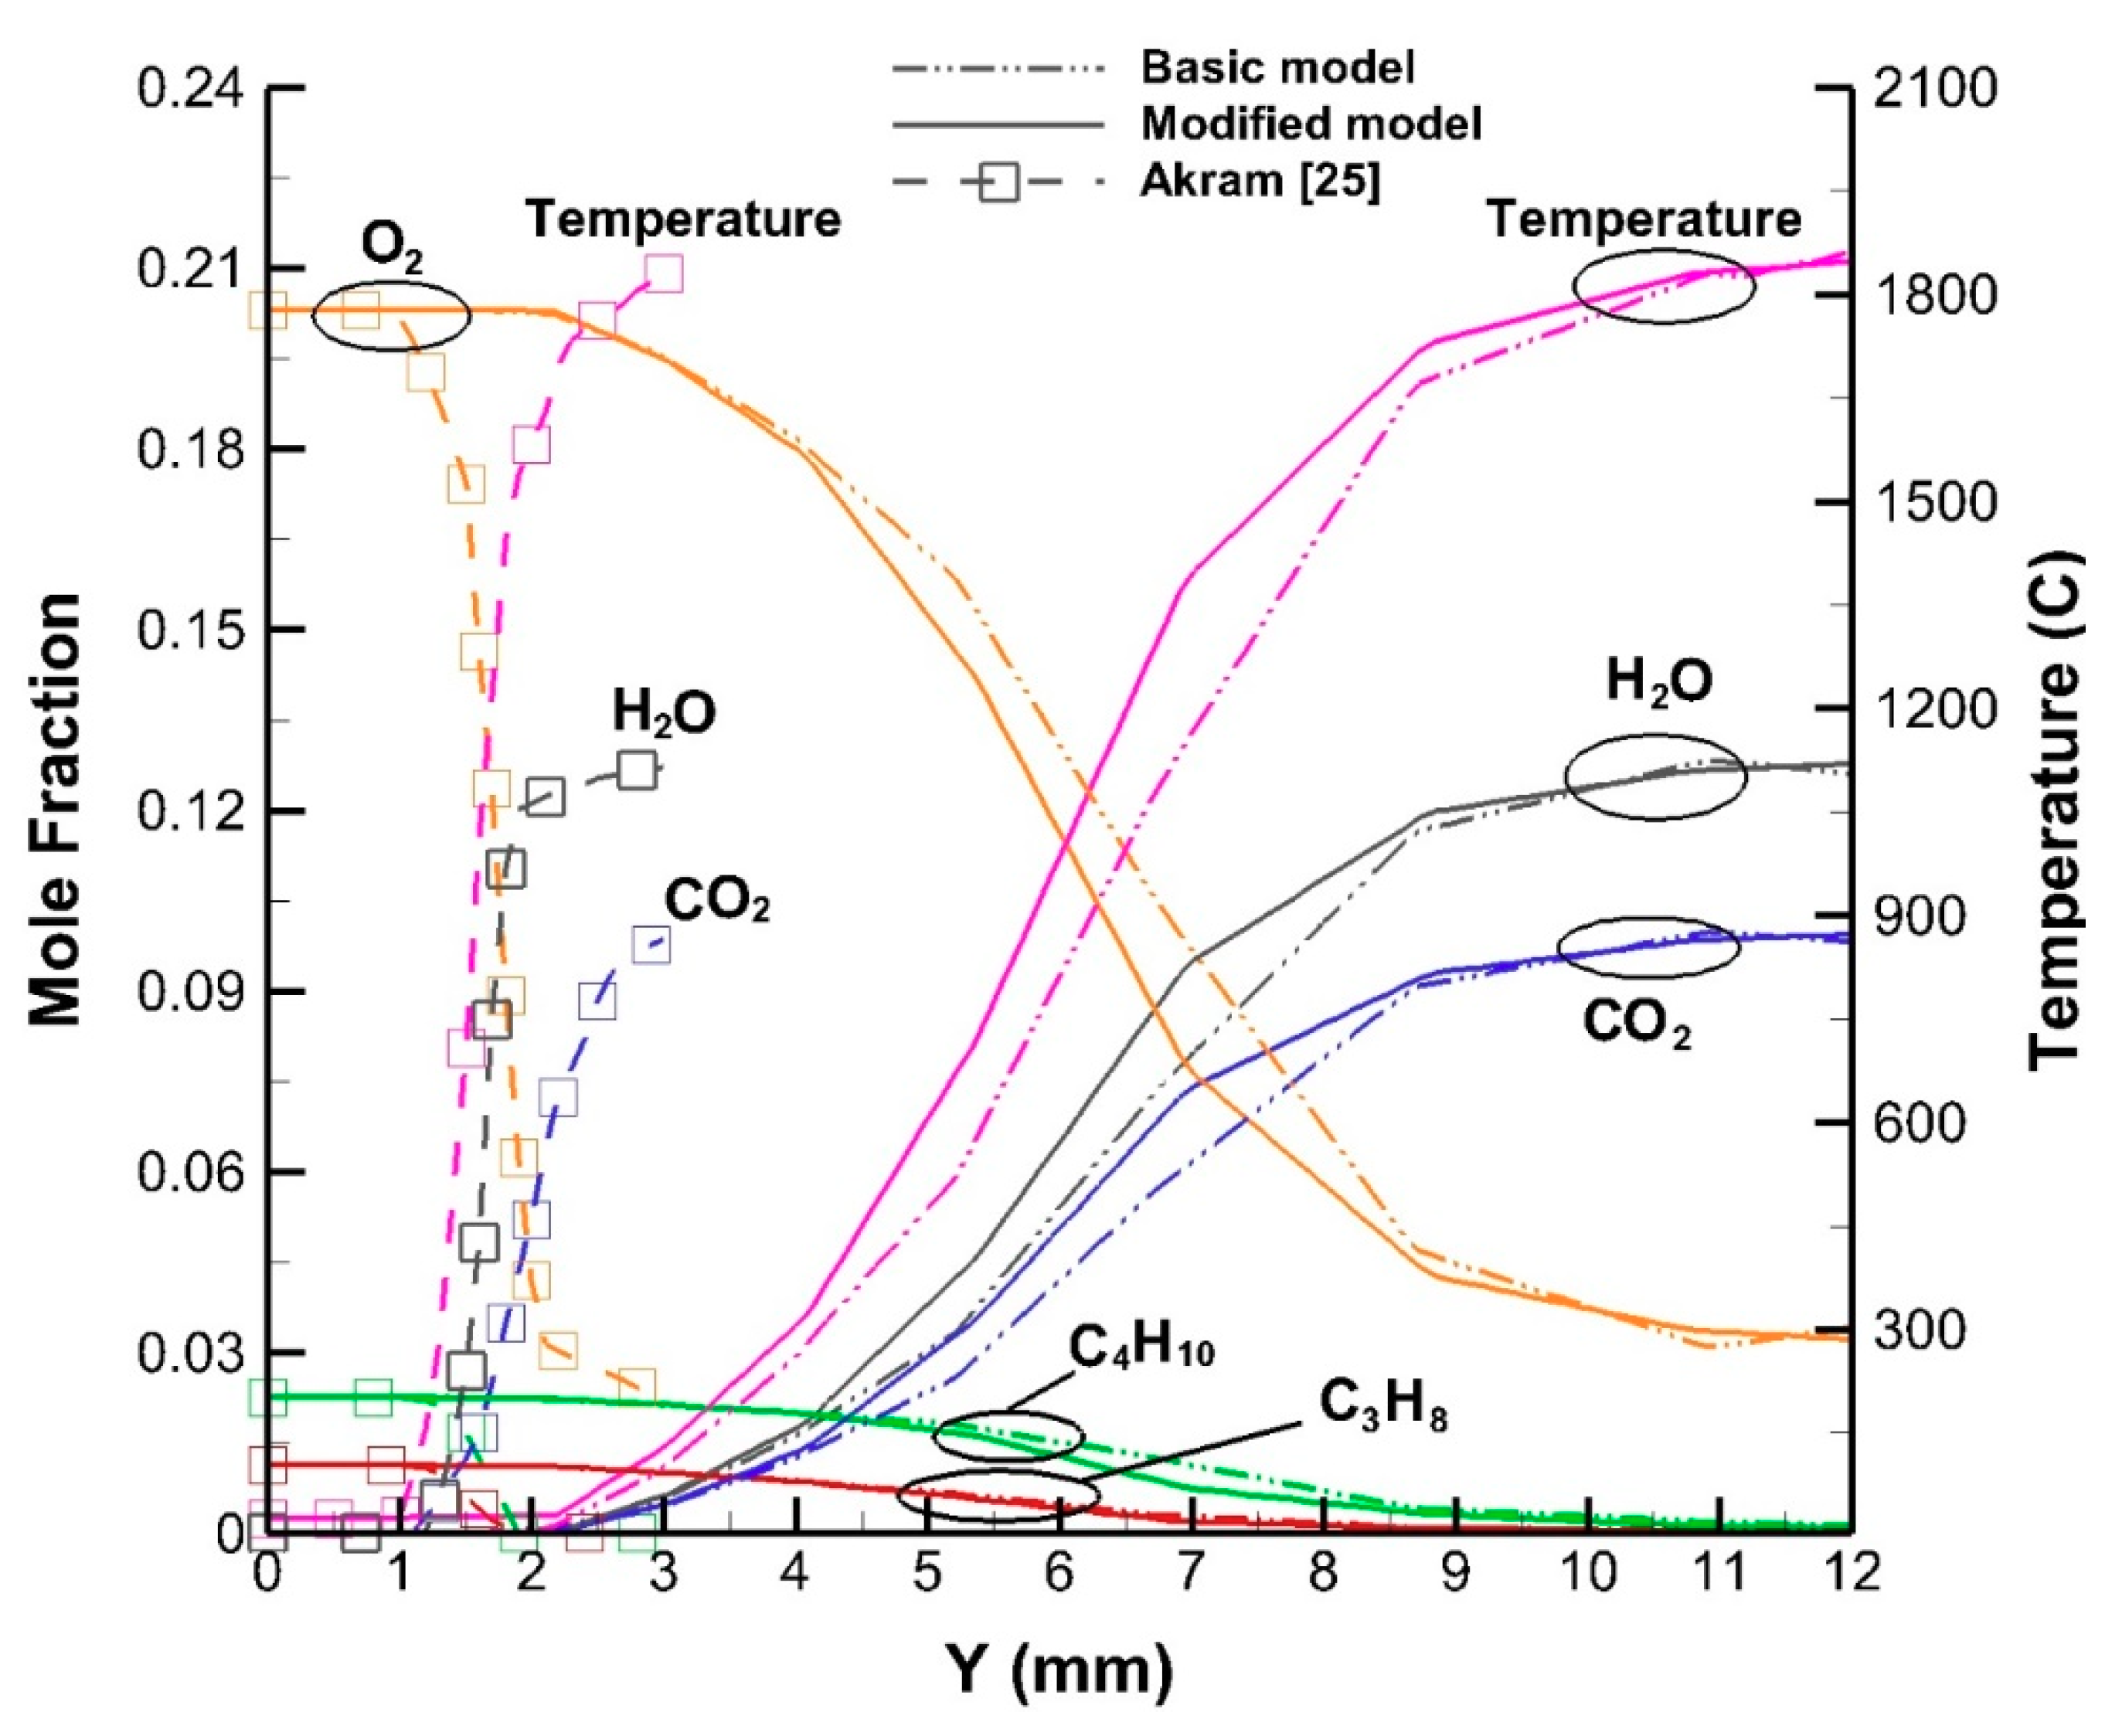
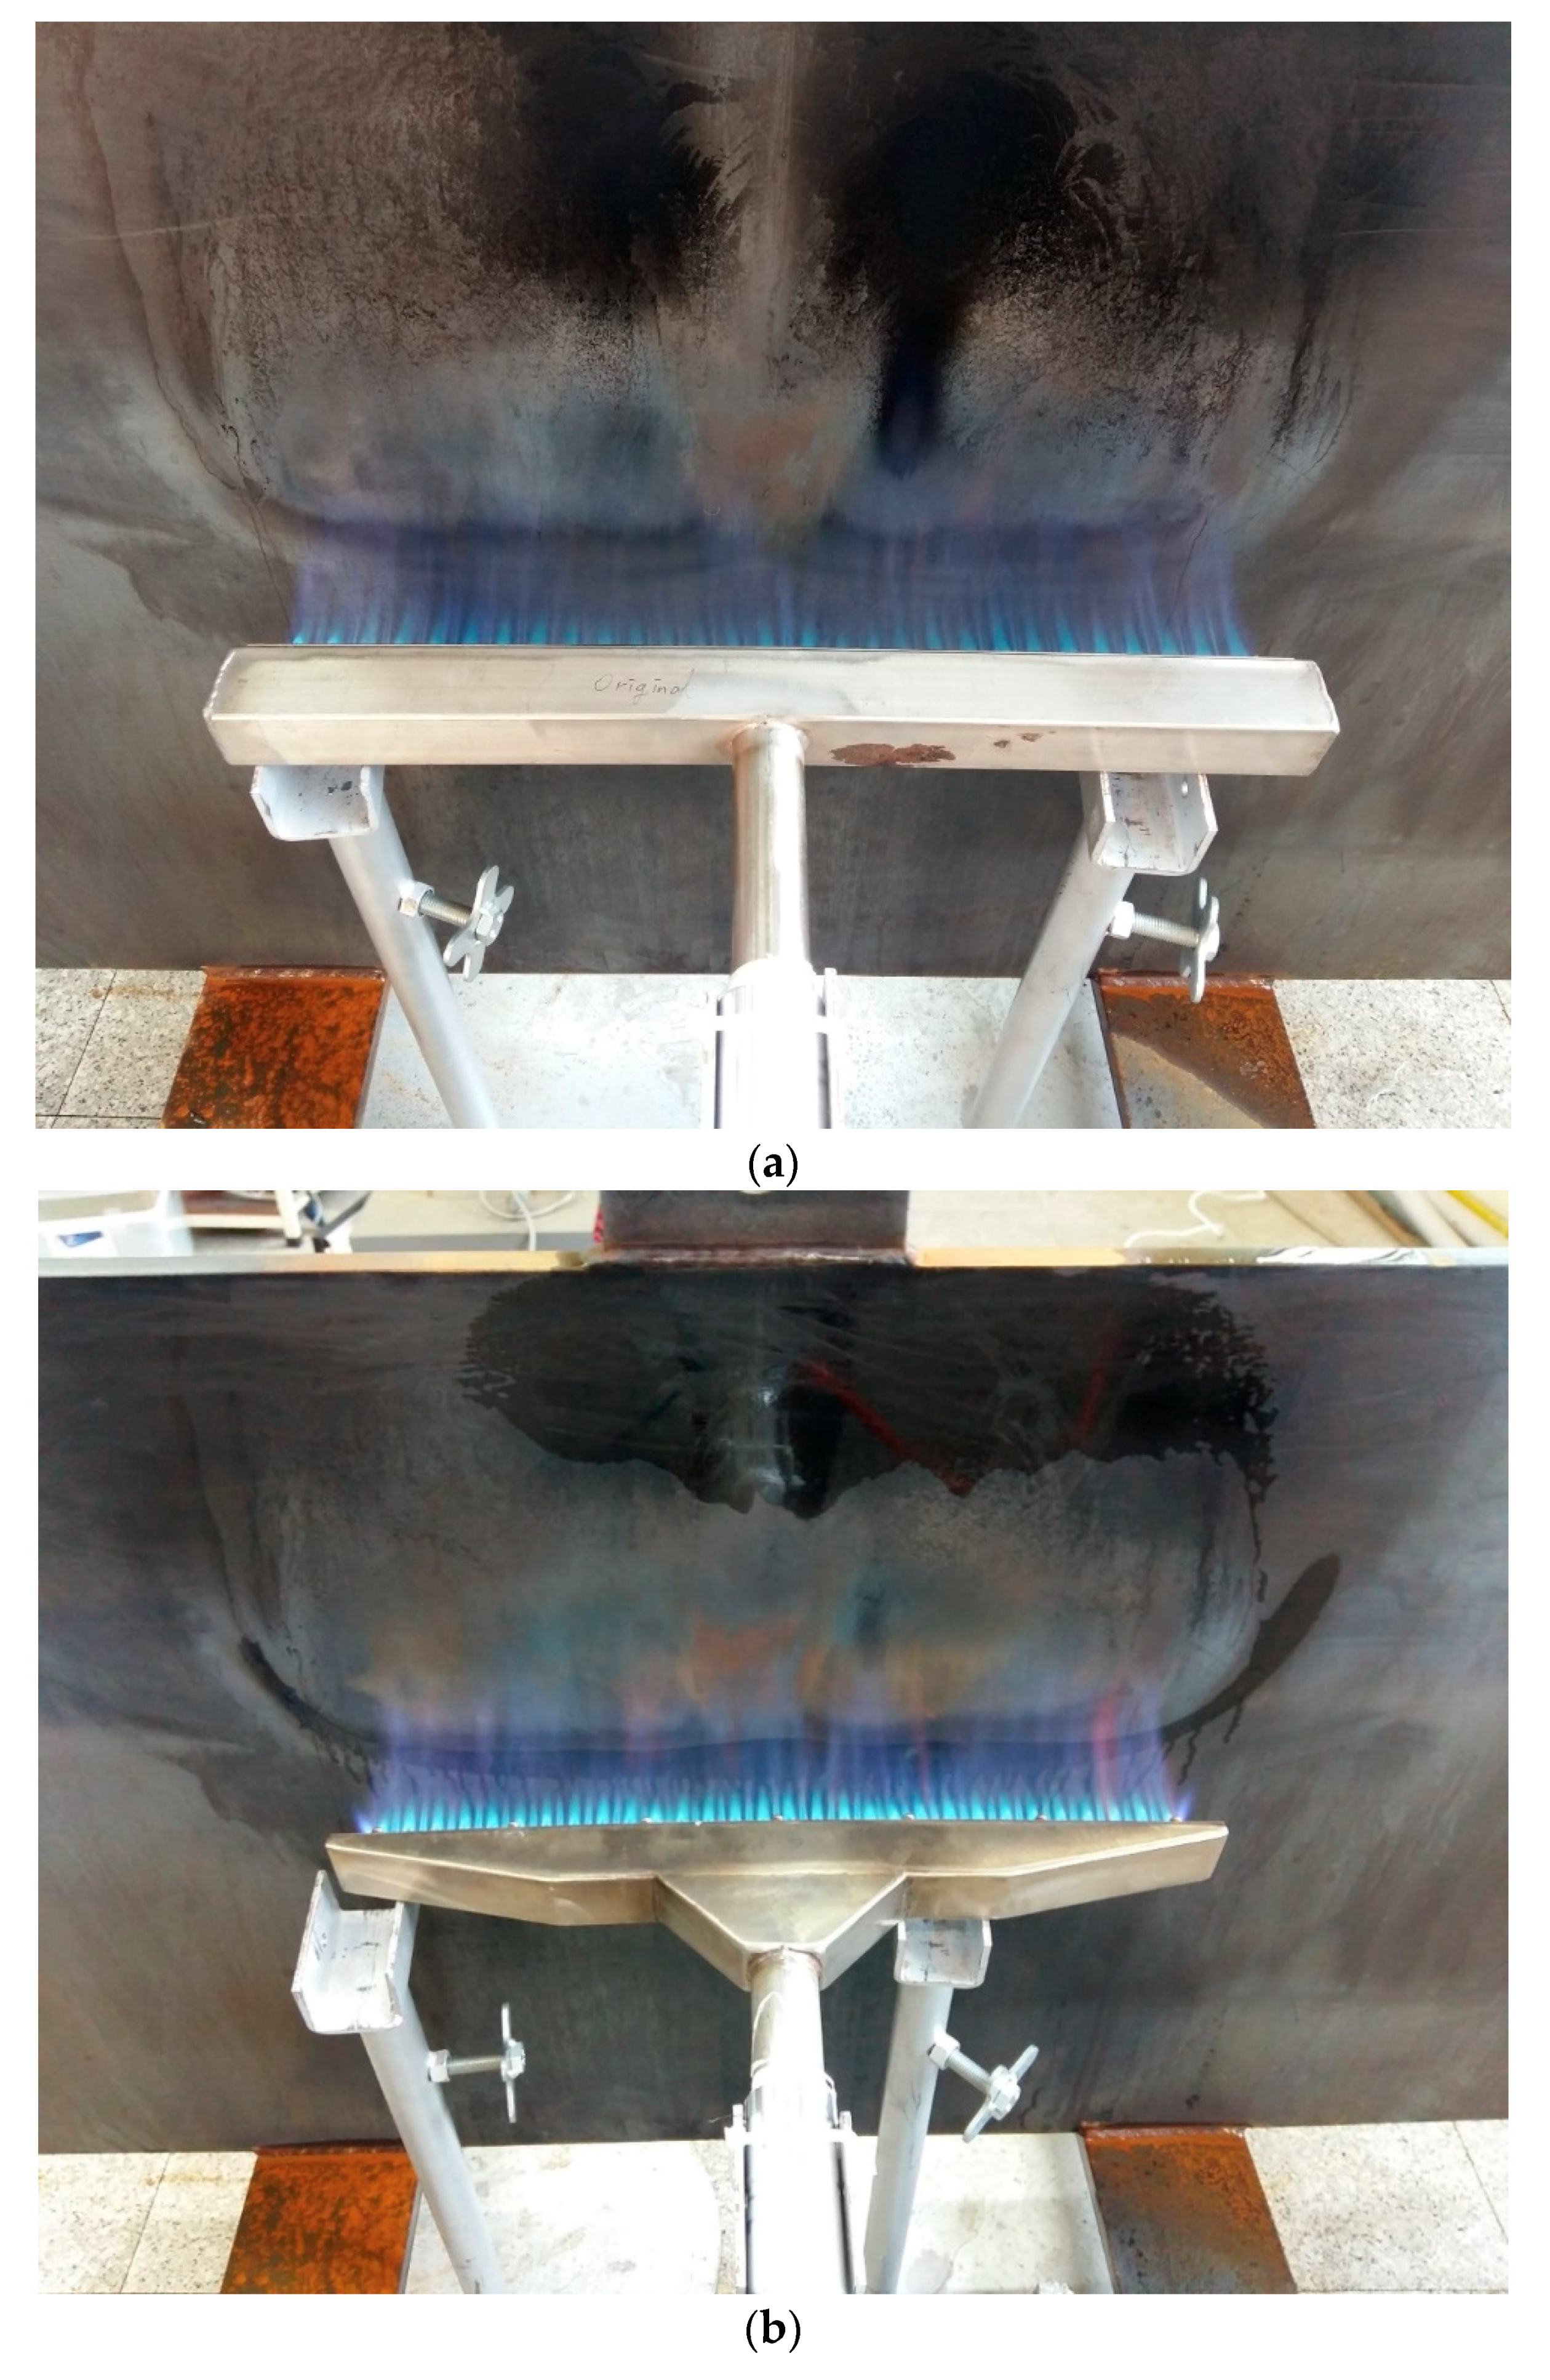
5. Comparison of Flame Structure and the Steel-Plate Temperature Distribution between the Basic and Modified Models

5.1. Mathematical Model

To investigate the temperature distribution as the combustion process occurs, the energy and species equations were applied and solved by ANSYS FLUENT 18.2 software [22].
Energy equation:
. ( u ( ρ E + p ) ) = . ( k T j h j J j ) + S h  
Equation (9) shows the energy transfer in a control volume. The term on the left-hand side represents the energy transfer due to convection. Two terms on the right-hand side represent net energy transfer around control surface due to conduction heat transfer and species diffusion. The last term represents source term, including chemical reaction, radiation (discrete ordinates (DO) radiation source term in this study), and so on.
where
E = h p ρ + u 2 2  
Enthalpy h is defined as follows:
h = j Y j h j + p ρ  
h j = T i n T c p , j d T  
Due to combustion process with radiational effect, the temperature from the exit of gas torch is selected at value of 27 °C, higher than ambient air temperature of 4 °C. The steel plate temperature is selected at value of 4 °C.
The species conservation equation is as follows:
. ( ρ u Y i ) = . J i + R i  
where Ri is the net rate of production of species by chemicals. In turbulent flows, the mass diffusion is computed as follows:
J i = ( ρ D i , m + μ t S c t ) Y i D T , i T T  
where Sct is the turbulent Schmidt number, which has a default value of 0.7. It should be noted that turbulent diffusion generally overwhelms laminar diffusion, and specification of the detailed laminar diffusion properties in turbulent flows is generally not necessary. For multicomponent mixing flow, the transport of enthalpy due to species diffusion can have a significant effect on the enthalpy field and should not be neglected.
. [ i = 1 n h i J i ]  
The turbulent–chemistry interaction model combines turbulent flow and complex chemical kinetics. Turbulence enhances the mixing of the reactants. Chemical reactions that involve temperature rise change the density and affect the flow. Therefore, the coupling between the turbulence and chemistry plays a crucial role in turbulent reactive flows. ANSYS FLUENT provides a turbulence–chemistry interaction model based on the work of Magnussen and Hjertager called the eddy-dissipation model. The net rate Ri,r of the production of species i due to reaction r is selected from the smaller of the two equations from the following:
R i , r = v i , r M w , i A ρ ε k Y R v R , r M w , R  
R i , r = v i , r M w , i A B ρ ε k P Y P j N v j , r M w , j  
where:
  • v′i,r is the stoichiometric coefficients for reactant i in reaction r
  • v″j,r is the stoichiometric coefficients for product i in reaction r
  • Mw is the molecular weight (kg/kmol)
  • k is the turbulence kinetic energy rate (J/kg)
  • ε is the turbulent dissipation rate (m2/s3)
  • YP is the mass fraction of product species, P
  • YR is the mass fraction of a particular reactant, R
  • A is an empirical constant equal to 4.0
  • B is an empirical constant equal to 0.5
The reaction rates are assumed to be controlled by the turbulence, so the Arrhenius chemical kinetic calculations can be neglected.

5.2. Boundary Conditions for Turbulent Combustion

The selected computational domain was from the gas torch outlet to the steel plate. The hole diameters of the torch outlet and the distance from the outlet to the steel plate were denoted by d and Y, respectively. The boundary conditions and mesh model were established as shown in Figure 11. Due to the symmetry of the model and the steel plate, a quarter of the model was utilized for the simulation to reduce the computation time. Due to the quarter model, symmetric boundary conditions were selected at two surfaces, as shown in Figure 11b.
A pressure outlet boundary condition was set at the two outside faces. The velocity inlet boundary condition of the jet holes was used for the LPG/air mixture. Because of the nonuniform flow at the outlet of the torch, the basic model had the highest Reynolds number of 3901 at the center area and the lowest Reynolds number of 3176 at the end of the torch. The Reynolds number of every flame jet was selected as 3483 for the modified model with uniform flow at the outlet of the torch.
The other top surfaces except the LPG/air inlet were treated as ambient air inlets. A no-slip condition was selected for the wall boundary condition imposed on the impinging jet. The grid independence of the solution was checked for three different amounts of elements of 808,045, 1,829,319, and 3,792,625. The flow temperature deviation between the medium and largest amounts of elements was less than 3%. Therefore, to save calculation time for the simulation, the medium grid size of 1,829,319 was chosen.
Due to the high temperature in the combustion process, radiation losses are important [23,24]. In order to examine the effect of radiation, the DO radiation model was used. The DO model covers the entire range of optical thickness and can be used to solve problems ranging from surface-to-surface radiation to radiation participating in combustion problems. The default boundary conditions were selected for the DO radiation model in ANSYS FLUENT 18.2 [21]. The absorption coefficient was modeled using the weighted sum of gray gases model (WSGGM). The DO equation has the following form:
. ( I ( r , s ) s ) + ( a + σ s ) I ( r , s ) = a n 2 σ T 4 π + σ s 4 π 0 4 π I ( r , s ) ϕ ( s , s ) d Ω
where,
  • r is the position vector
  • s is the direction vector
  • s is the scattering direction vector
  • a is the absorption coefficient
  • n is the refractive index
  • σ s is the scattering coefficient
  • σ is the Stefan–Boltzmann constant (5.669 × 10⁻⁸ W·m−2·K−4)
  • I is the radiation intensity
  • T is the local temperature
  • ϕ is the phase function
  • Ω is the solid angle
Equation (15) means that the net radiation intensity around a control volume (the first term on the left-hand side) is equal to the sum of the extinction (the second term on the left-hand side), emission (the first term on the right-hand side), and scattering term (the second term on the right-hand side). The Reynolds number is calculated based on the LPG/air mixture gases at the jet hole outlet of the torch:
Re = ρ m ix v m ix d μ m ix  
The equivalence ratio is defined as follows:
ϕ = ( F / A ) a c t u a l ( F / A ) s t o i c  
Due to the uniform flow and almost the same velocity magnitude at the outlets of the modified torches in Figure 9 and Figure 10, model 3 was selected to carry out the simulation and experiment and then compared with the basic model. Figure 12 shows the temperature contour of a combustion flame zone at the center line view in the steel preheating zone for the basic and modified model with an LPG/air mixture as a fuel.
The highest temperature for the basic model approached 1877 °C at an equivalence ratio (Φ) of 1.0 and steel-plate distance of 0.1 m. This temperature was slightly higher than that of 1869 °C for the modified model. This was due to the fact that higher flame temperature in a narrow center region could be obtained from a higher Reynolds number. Thus, the basic model had a longer flame structure near the center region than the modified model. The ambient air near the jet holes was entrained to the flame zone due to the high-speed jet stream. The entrained air also participated in the combustion process. The primary jet line at the center line of the torch was associated with the main combustion process, and the combustion flame of the primary jetline made a major contribution to the steel-plate heating.
Figure 13 shows the species mole fraction and temperature variations of the stoichiometric of the LPG/air mixture as a function of the jet flow direction at the center region for the basic model, modified model, and Akram experiment model [25]. For the basic model, before the combustion happened, the mole fractions of C3H8, C4H10, and O2 were approximately 0.01, 0.02, and 0.2, respectively. The temperature of the unburned mixture was 27 °C (300 K). After the combustion happened, the reactant mole fractions decreased quickly and CO2 and H2O were generated. Thus, the products and their mole fractions increased quickly. The flame temperature increased very fast in a short distance when the combustion happened.
For the modified model, because of the smaller Reynolds number than the basic model, the turbulent combustion had higher temperature and higher product mole fractions in all positions except the starting position (Y = 0 mm) and the last position (Y = 12 mm) than the basic model case. The trends of the species mole fraction and temperature variations of the stoichiometric LPG/air mixture for the basic and modified models coincided well with those of Akram et al. [25], who performed a study on laminar combustion. The present turbulent combustion showed the trends in a longer y-distance of 12 mm, while the trends of Akram et al.’s laminar combustion showed the trends in a shorter distance of 3 mm due to lower momentum.

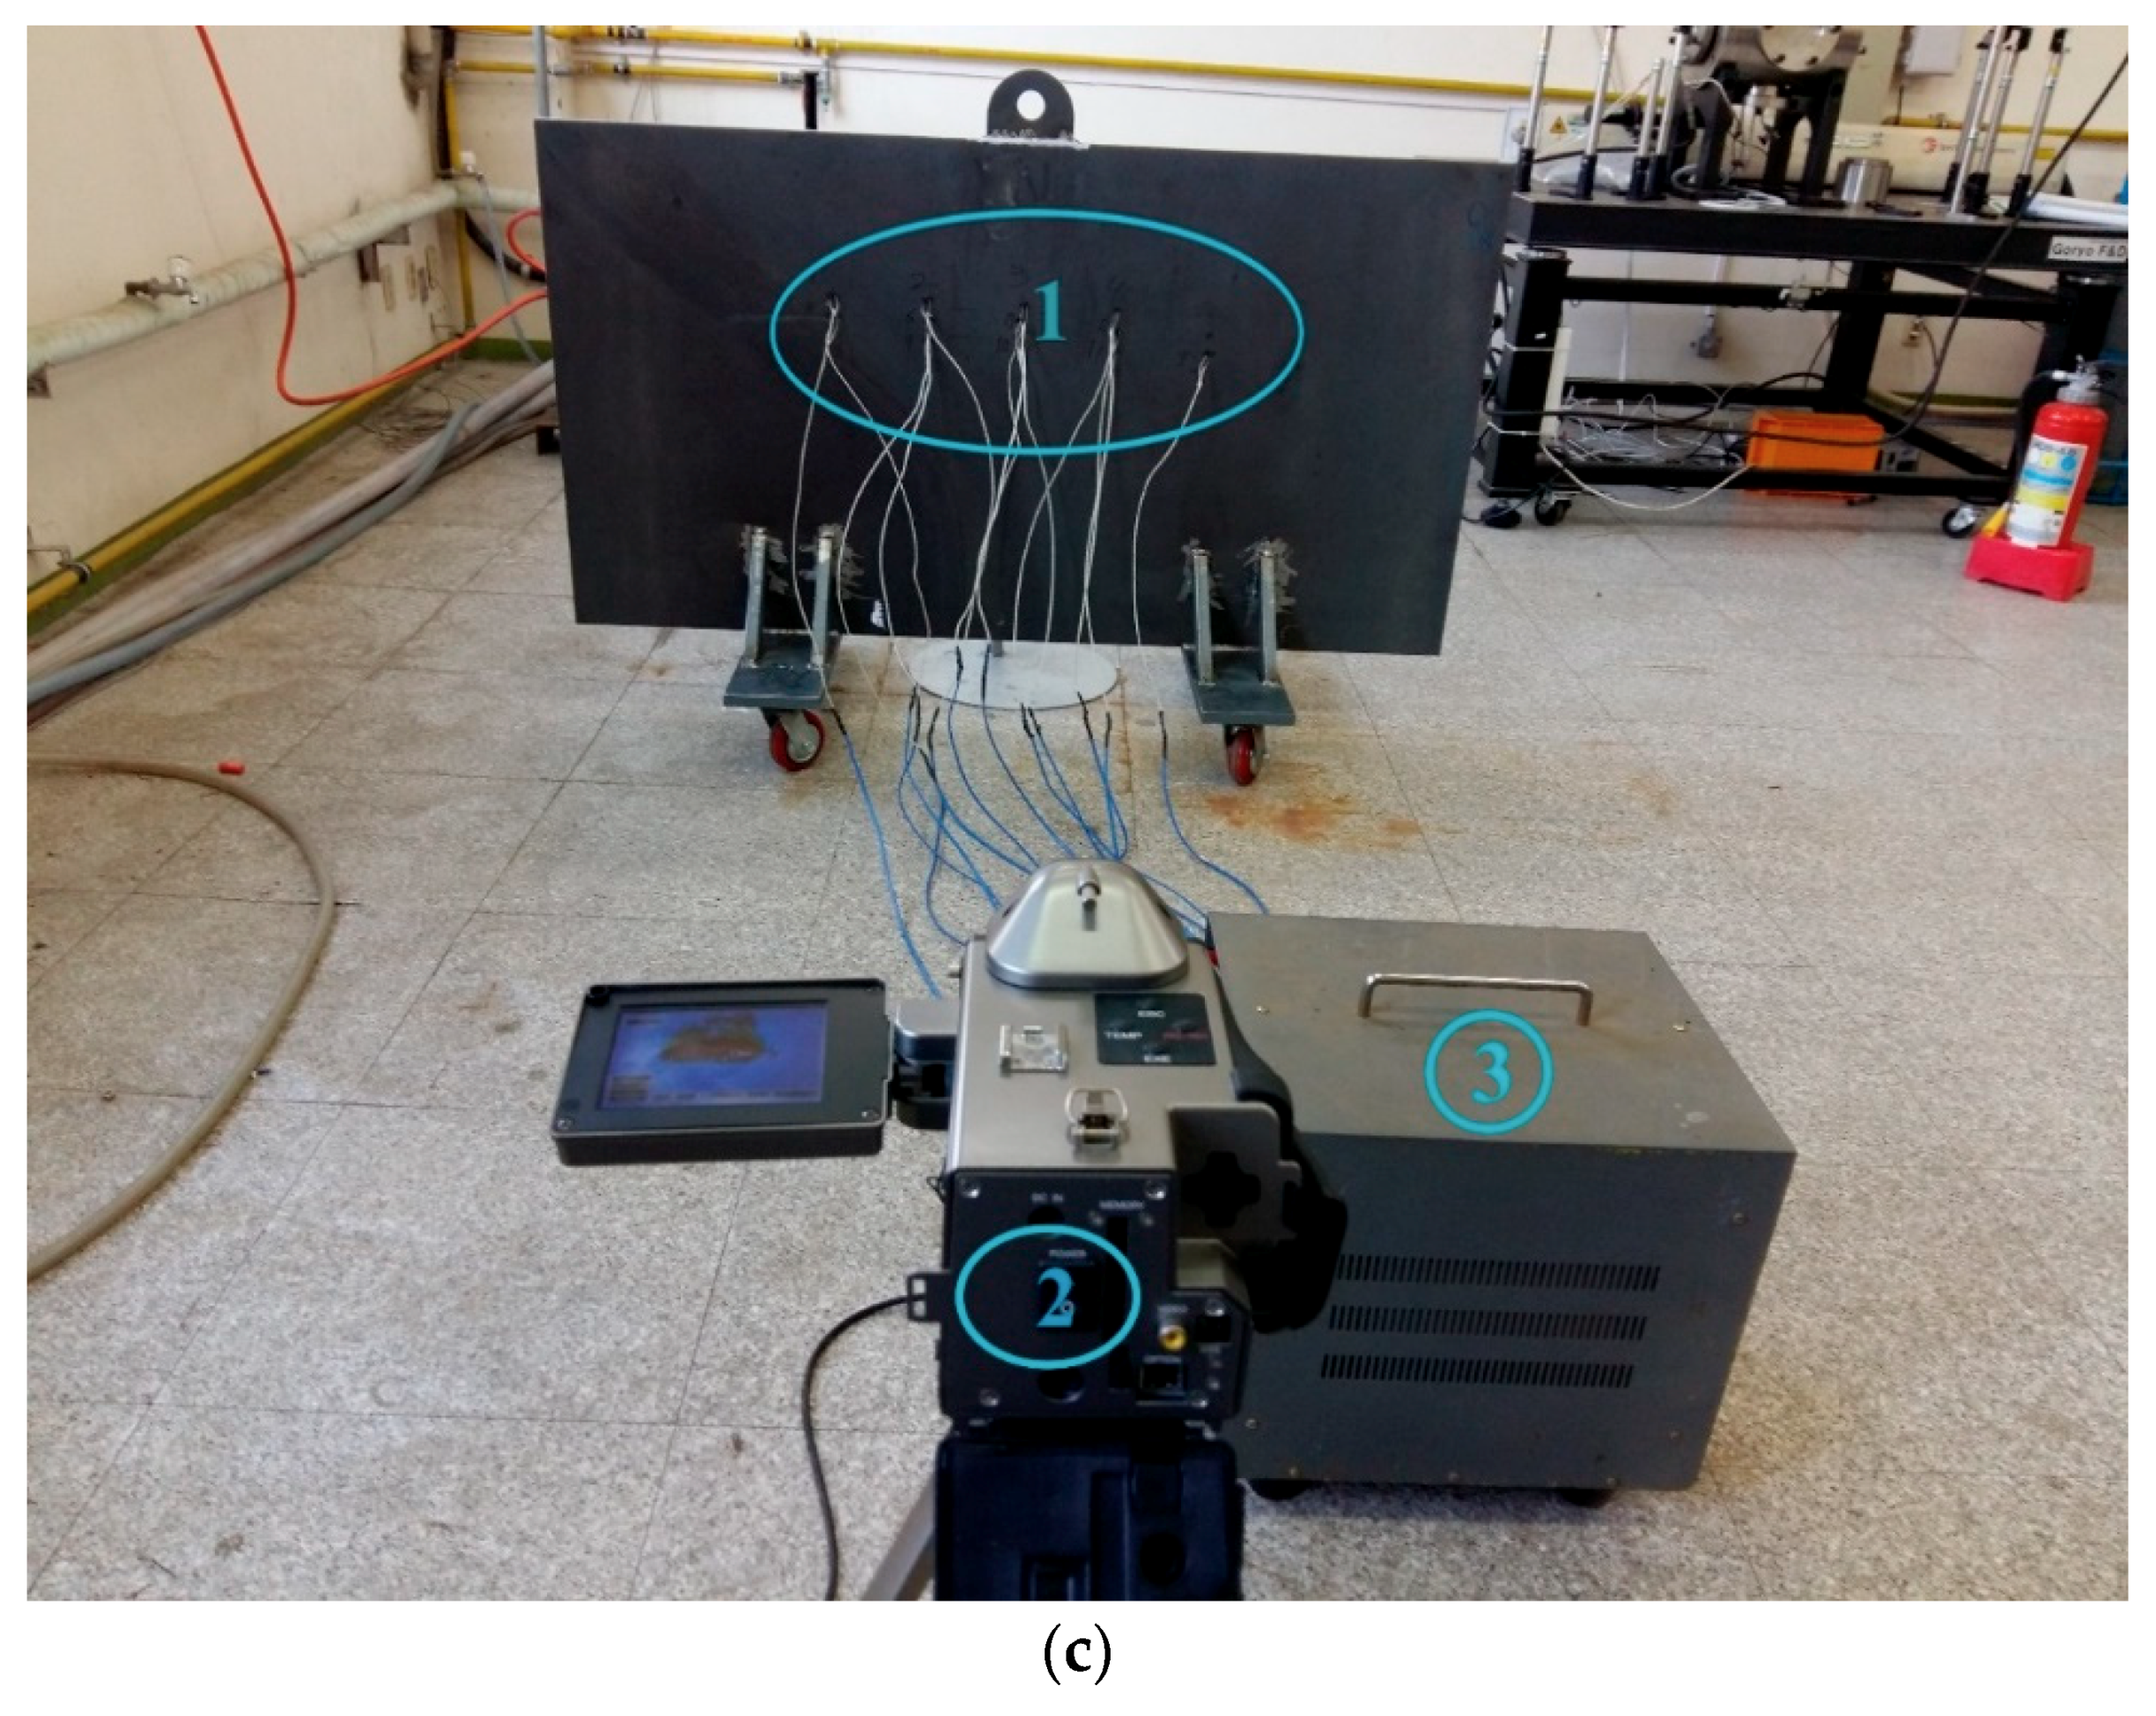
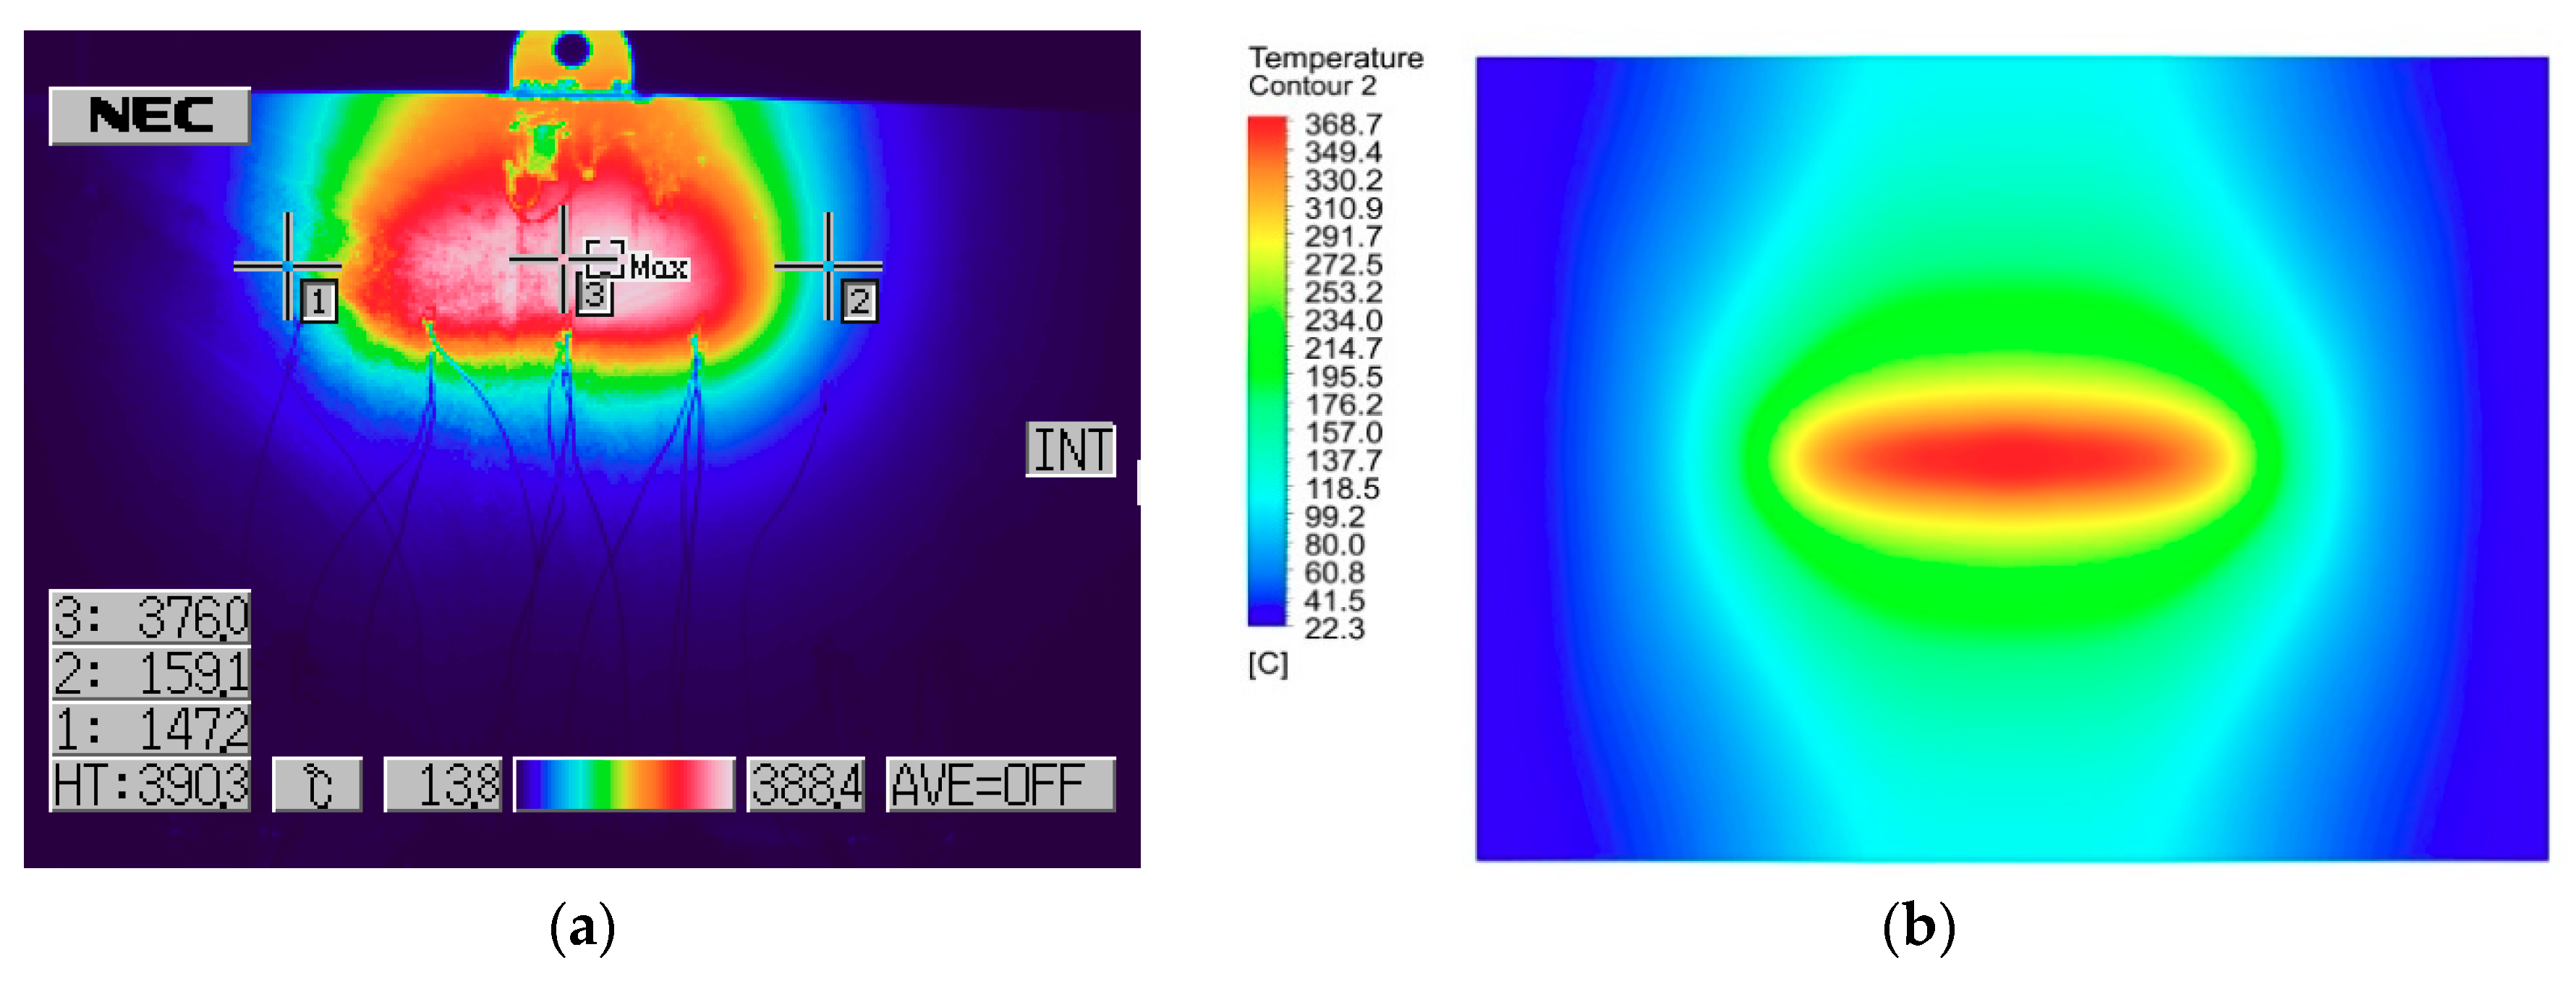
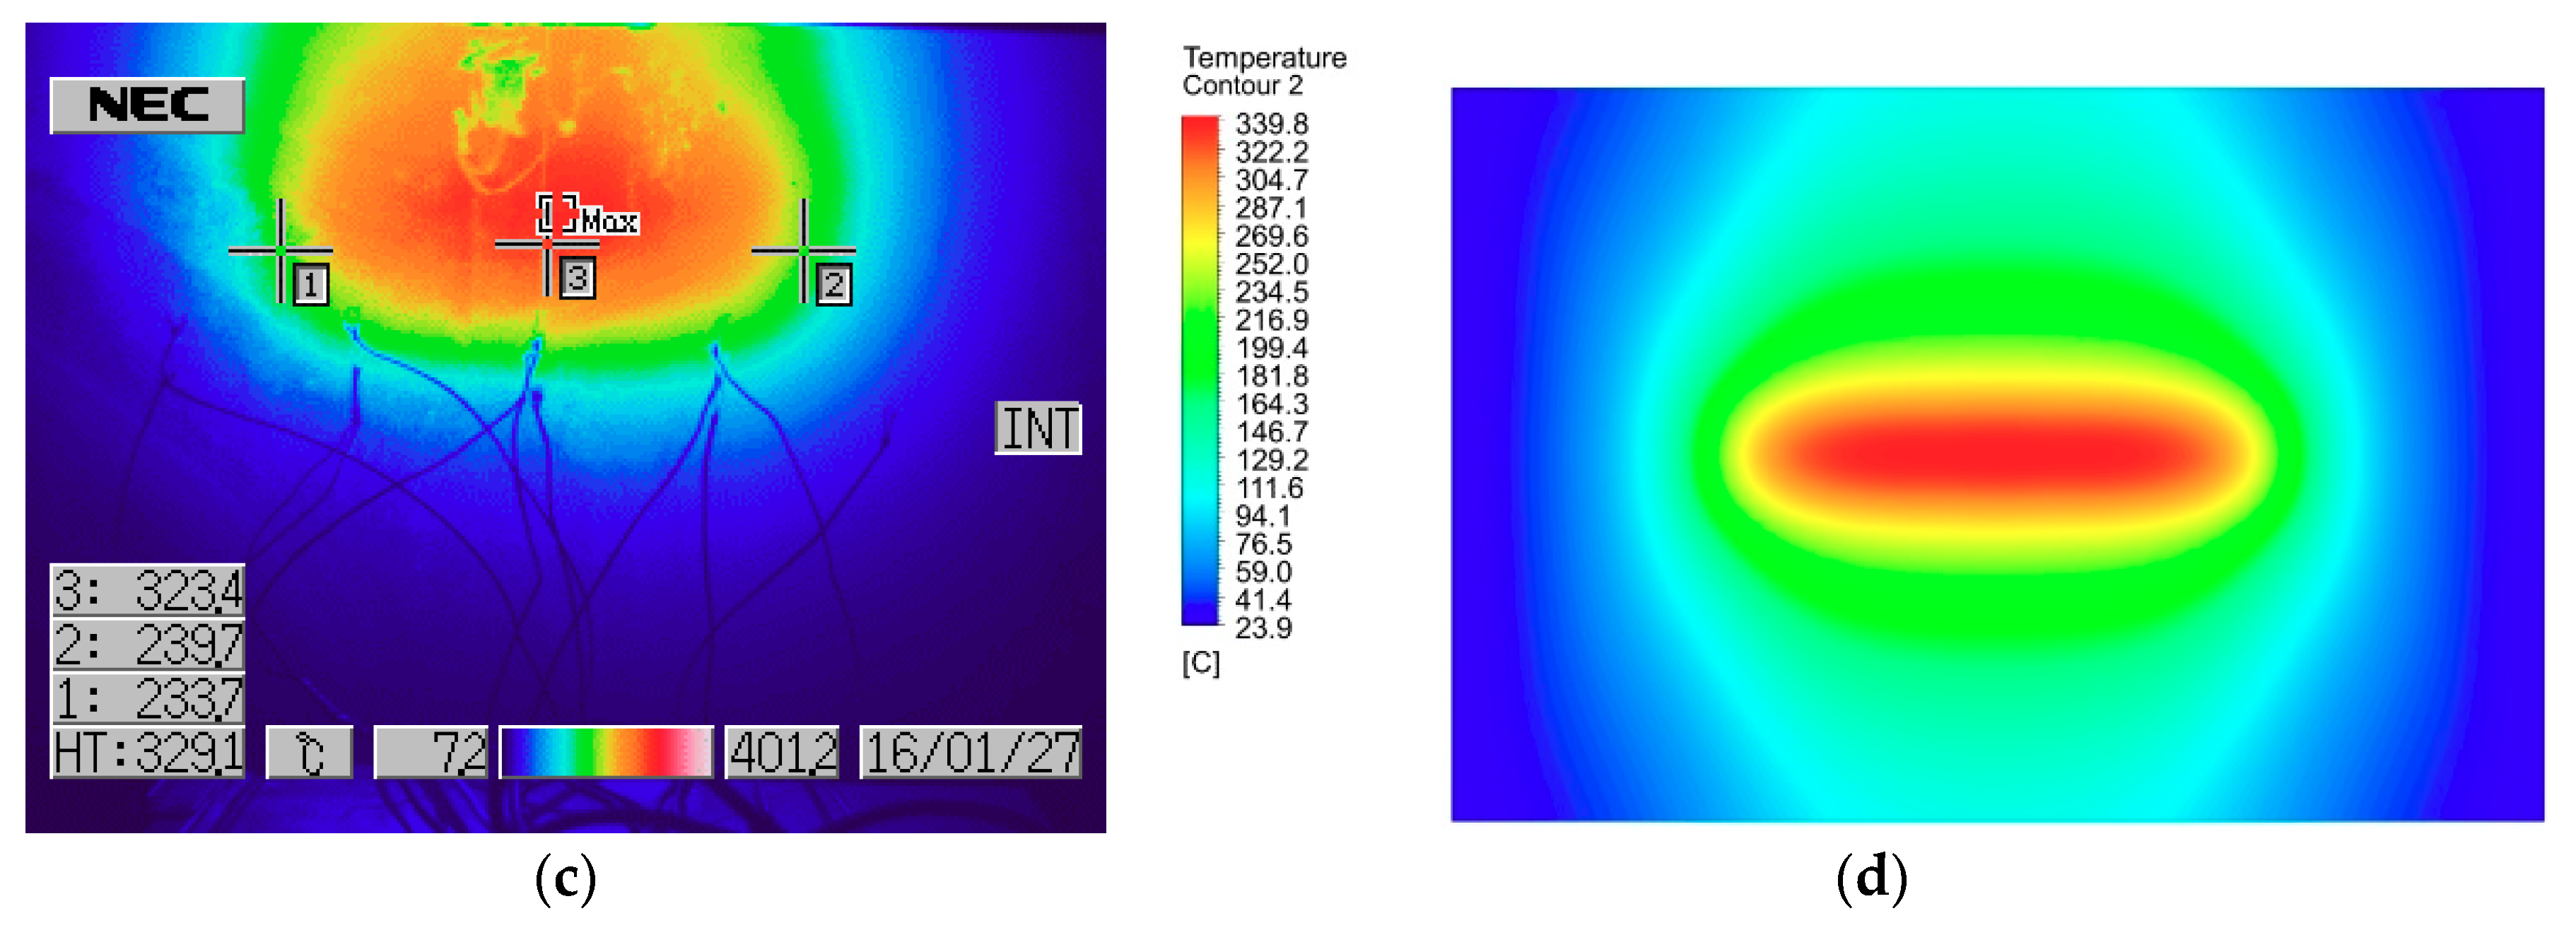
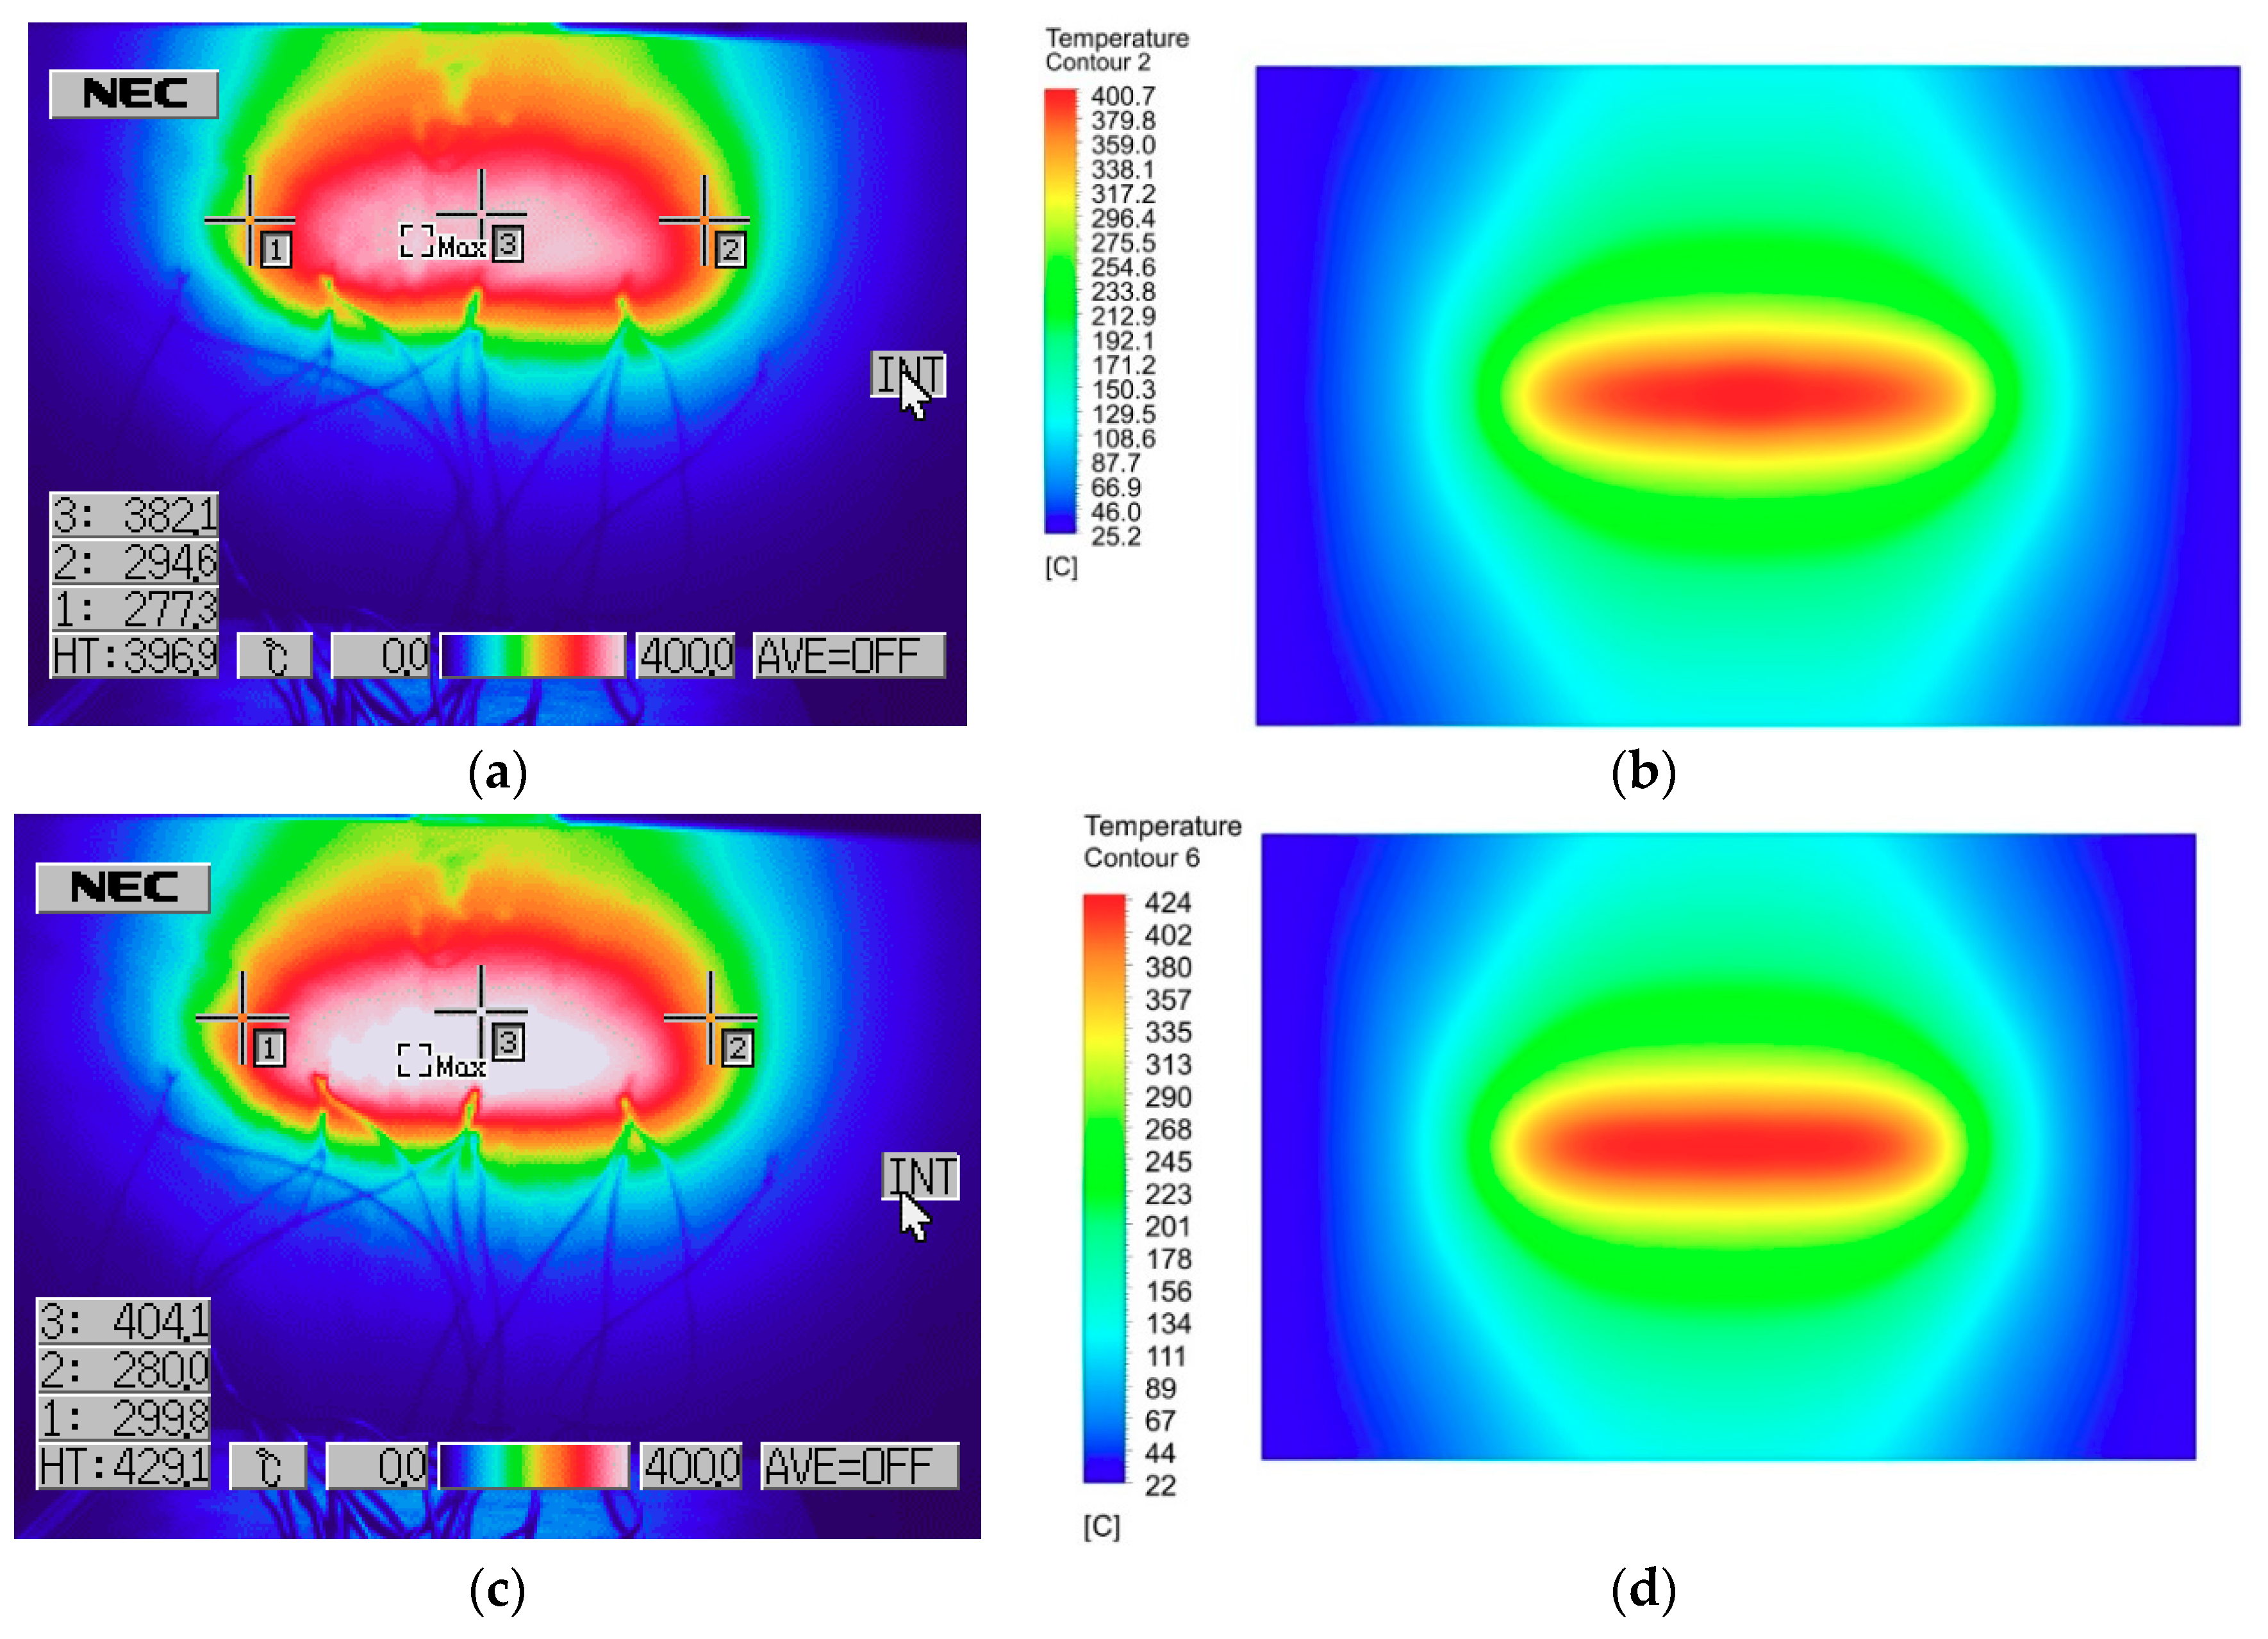
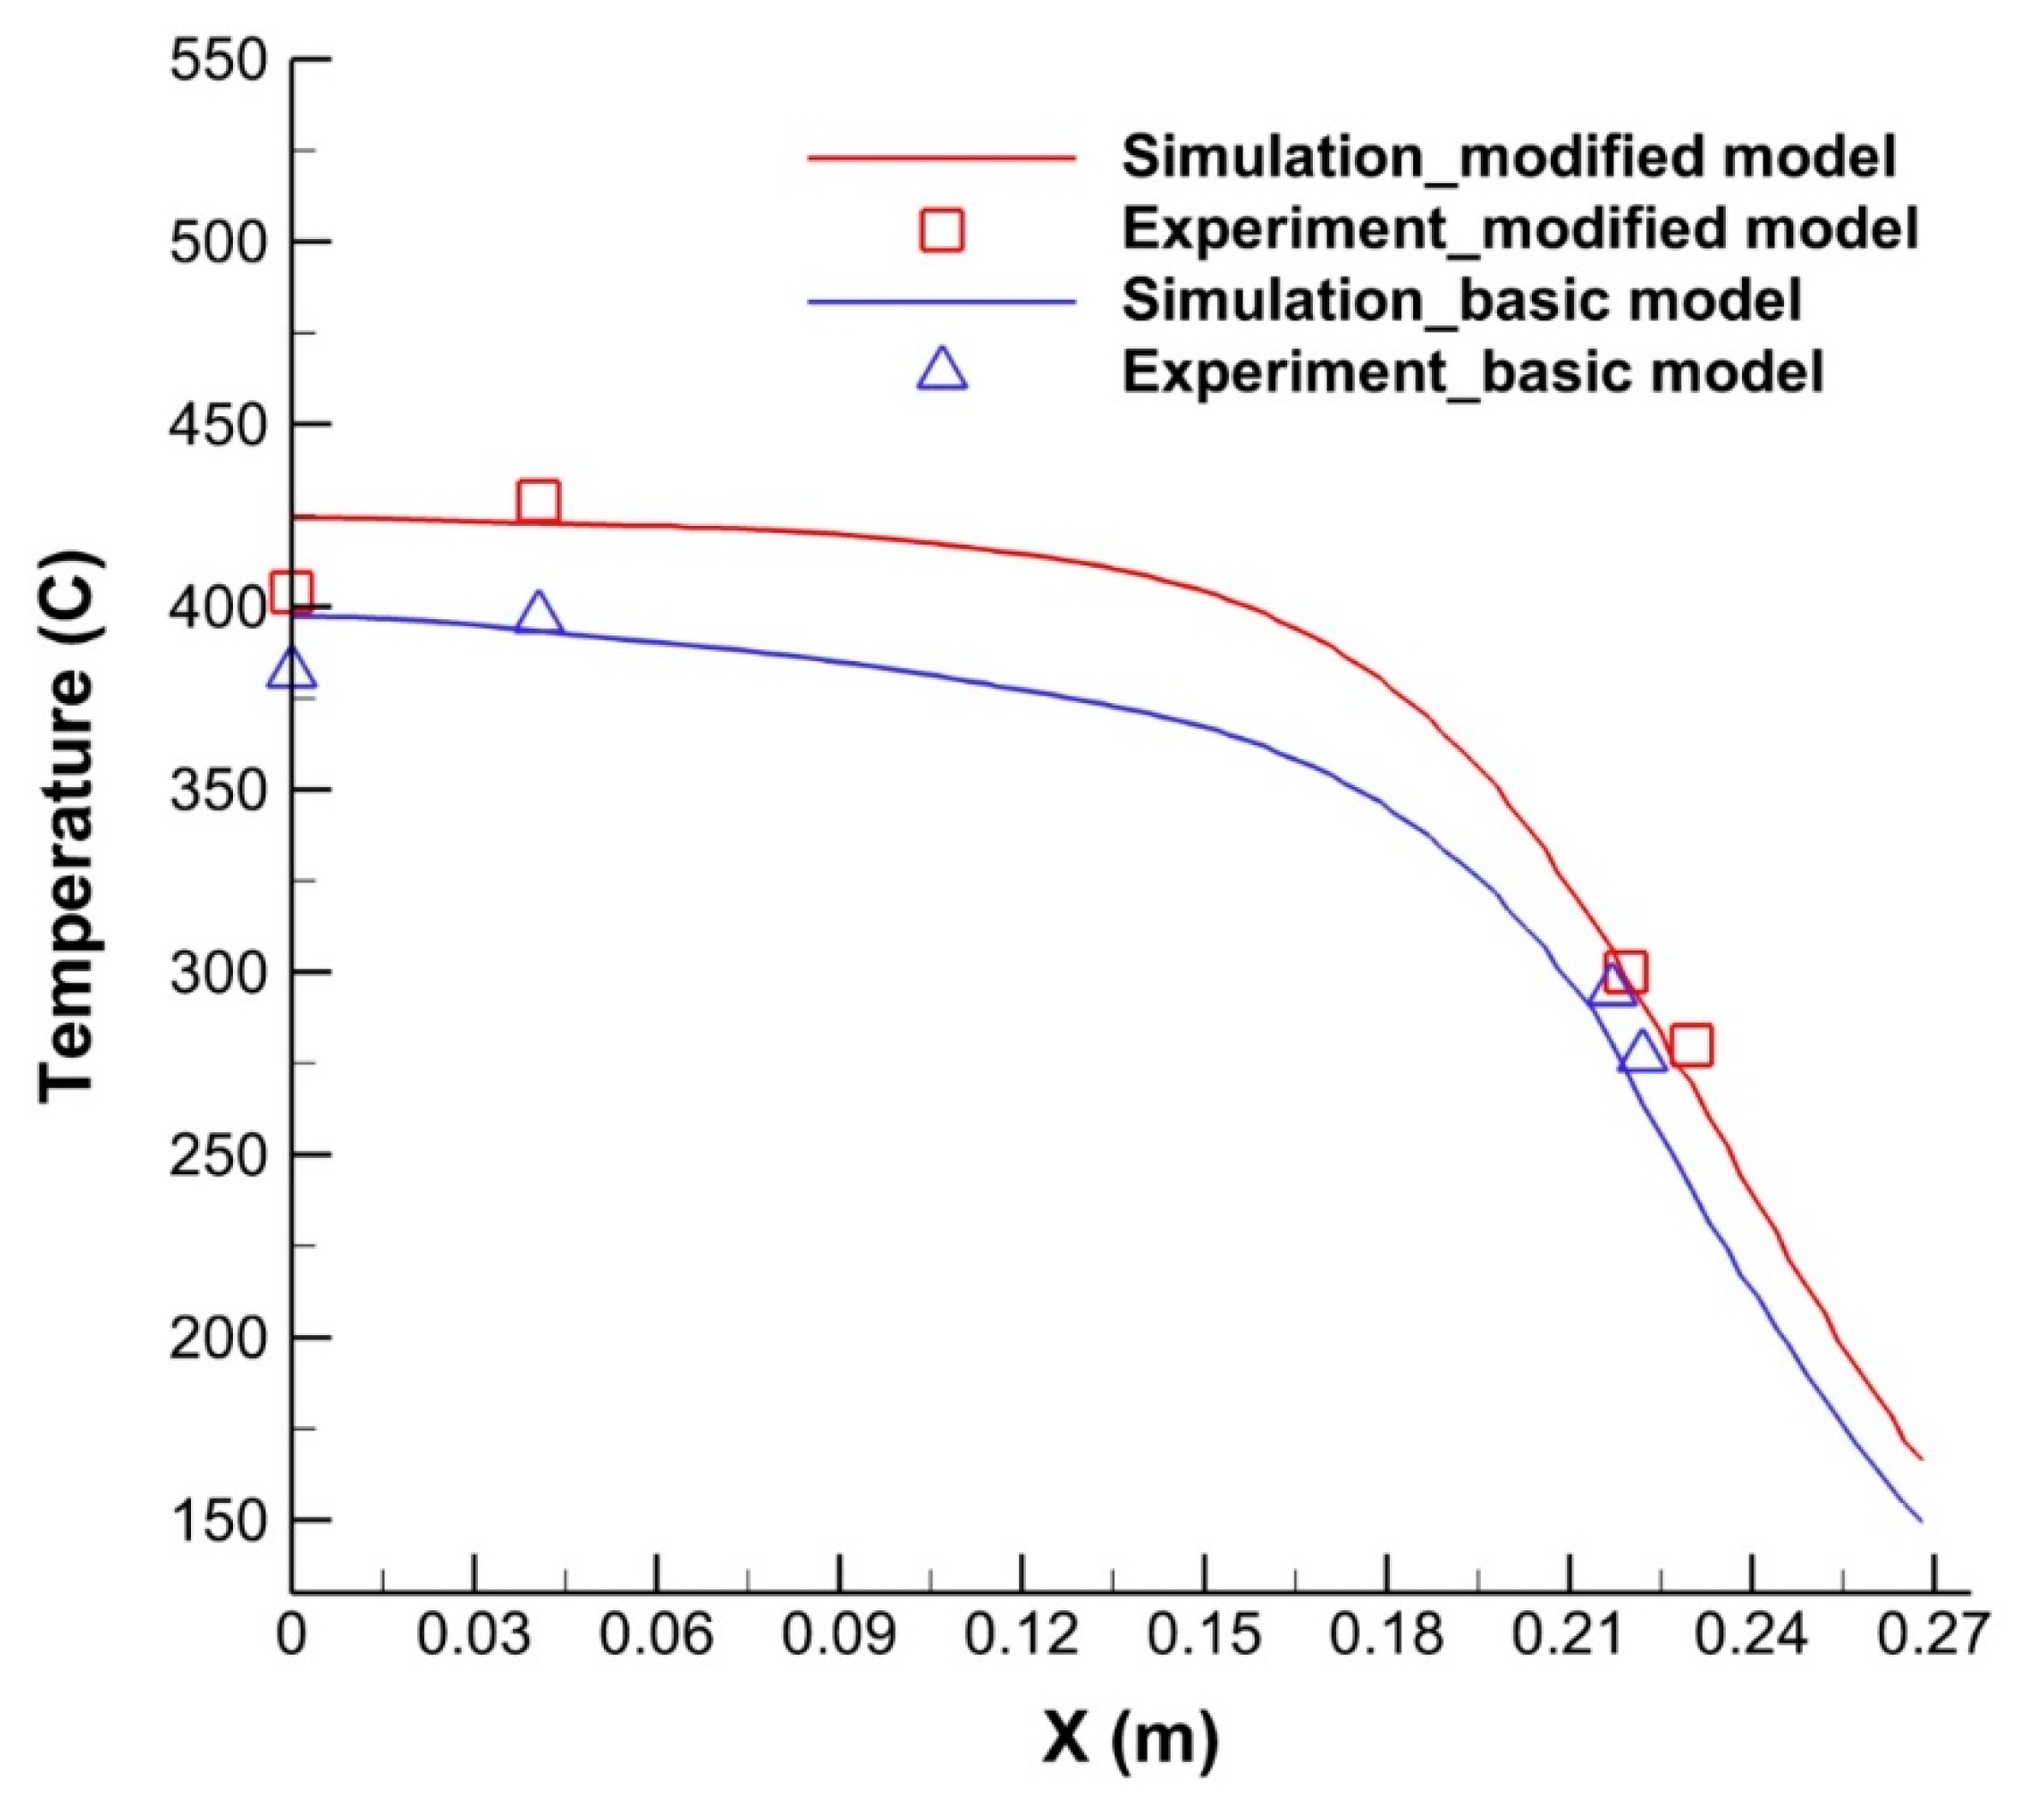
5.3. Comparison of the Temperature Distribution at the Back Side of a Steel Plate between the Experiment and Simulation

An experiment was conducted to obtain validation for the numerical simulation results by ANSYS FLUENT 18.2 software. An experimental apparatus was designed for the basic and modified models in the steel preheating process, as shown in Figure 14. The uniformity of the three modified torches was nearly the same, as revealed in Figure 9 and Figure 10, so model 3 was selected to carry out the experiment and compared with the basic model. The full steel plate had a width, length, and thickness of 0.8 m, 1.5 m, and 0.02 m, respectively. The distance between the outlets of the torch and the steel plate was 0.1 m.
Figure 14a,b show that the LPG/air mixture was ignited to start the preheating processes after moving out of the basic and modified torches at the outlet. A TVS-200EX infrared camera was used to measure the temperature distribution on the back side of the steel plate, as shown in Figure 14c. As the camera image of the temperature distribution could cover a wide range of the heating region of the steel plate, temperatures measured by thermocouples were used as a reference.
The experiment and simulation results for the basic and modified models are shown in Figure 15 and Figure 16. In the basic model in Figure 15a, most of the high-temperature region was concentrated in the center region because the nonuniform flow at the center region of the torch caused high temperature in this region. Consequently, the temperature difference between the center and the edge was large (about 229 °C). However, in the modified model in Figure 15c, the temperature difference between the center and the edge was much smaller (about 90 °C) due to the uniform flow distribution at the torch outlets.
The temperature distributions at the back side of the steel plate from the numerical simulation (Figure 15b,d) showed good agreement with those from the experiment (Figure 15a,c). In the complete combustion, as shown in Figure 16, the temperature distribution on the steel plate was higher than that in the incomplete combustion because the fuel was completely burned in complete combustion and it released the maximum amount of energy. The modified model (Figure 16c) showed a wider and more uniform temperature region than the basic model (Figure 16a) due to the uniform flow at the outlet of the torch. The simulation results (Figure 16b,d) also had good agreement with the experimental ones (Figure 16a,c) for both the basic model and the modified model.
Figure 17 shows the lengthwise temperature distribution at the back side of the steel plate from the center to the edge for complete combustion (Φ = 1.0). In the basic model, the temperature decrease from the center to x = 0.15 m was around 30 °C, while in the modified model, the temperature decrease along the same distance was around 12 °C. The temperature then decreased promptly due to the heat transfer to the cool ambient air. However, the temperature difference of the modified model was still less than that of the basic model. The numerical simulation results for the two models in these cases also showed good agreement with the experimental results.

6. Conclusions

The uniform flow distribution at the outlet of a gas torch and turbulent combustion for steel preheating were studied using ANSYS FLUENT 18.2 and experiments. The flow uniformity at the outlets of the torch was improved by the three new models. The velocity distribution at the outlets was also nearly uniform along the lengthwise direction, which was in contrast with that of the basic model, and the velocity uniformity was better. The maximum percentage of the uniformity index between the three new models and basic model was 7.3%. Moreover, for either complete or incomplete combustion, the basic model had a larger temperature difference at the steel plate between the center and the edge than the modified model.
The temperature differences for the basic and modified models were 229 °C and 90 °C, respectively. The numerical simulation results using ANSYS FLUENT also showed good agreement with the experimental results for both complete and incomplete combustion. With a trade-off between the capital cost of the new design and the operating cost to save fuel energy and obtain good quality for steel preheating, a suitable geometry for a gas torch can be selected for actual applications, particularly in preheating steel plates.

Author Contributions

Conceptualization, G.S.L. and H.V.N.; Methodology, G.S.L., H.V.N., T.T.N. and T.Z.; Software, T.T.N. and H.V.N.; Validation, G.S.L., T.T.N., J.G. and T.Z.; Formal Analysis, T.T.N., H.V.N. and G.S.L.; Investigation, T.T.N., H.V.N., T.Z. and J.G.; Resources, G.S.L.; Data Curation, G.S.L., H.V.N., T.T.N. and T.Z.; Writing-Original Draft Preparation, T.T.N.; Writing-Review & Editing, G.S.L.; Visualization, T.T.N., J.G. and T.Z.; Supervision, G.S.L.; Project Administration, G.S.L. and J.G.; Funding Acquisition, G.S.L.

Funding

This research was funded by the Ministry of Trade, Industry, and Energy (MOTIE) [grant number: R0006185] and also funded by the Korea Small and Medium Business Administration [grant number: C0275689].

Acknowledgments

This work was supported by the Fostering Local Specialization Industry Crisis Type (Shipbuilding Equipment) Technology Development Program funded by the Ministry of Trade, Industry, and Energy (MOTIE) [Project Name: R0006185] and also by the Program for Cooperative R&D between Industry, Academia, and Research Institutes [Project Name: C0275689] funded by the Korea Small and Medium Business Administration.

Conflicts of Interest

The authors declare no conflicts of interest.

Nomenclature

AEmpirical constant equal to 4.0
BEmpirical constant equal to 0.5
dJet hole diameter at the outlet of gas torch (2 mm)
Di,mMass diffusion coefficient for species i
DT,iThermal diffusion coefficient
hiEnthalpy of species i
JiDiffusion flux of species i
KTurbulent kinetic energy per unit mass (J/kg)
Mw,iMolecular weight of species i
RiNet rate of production of species i
ReReynolds number
ShSource term
SctThe turbulent Schmidt number
TTemperature (C)
ui,ujVelocity (m/s)
v′i,rStoichiometric coefficient for reactant i in reaction r
v″i,rStoichiometric coefficient for product i in reaction r
YiLocal mass fraction of each species
YPMass fraction of any product species, P
YRMass fraction of a particular reactant, R
εTurbulent dissipation rate (m2s−3)
δjUnit tensor
γUniformity index
Subscripts
adAdiabatic
hhole
iSpecies
jetJet holes
mixLPG/air mixture
pY-branch pipe
PProducts
RReactants
stoicStoichiometric
ttriangle shape

References

  1. Liu, H.; Li, P.; Lew, J.V.; Daniel, J.R. Experimental study of the flow distribution uniformity in flow distributors having novel flow channel bifurcation structures. Exp. Therm. Fluid Sci. 2012, 37, 131–145. [Google Scholar] [CrossRef]
  2. Liu, H.; Li, P. Even distribution dividing of single-phase fluids by symmetric bifurcation of flow channels. Int. J. Heat Fluid Flow 2013, 40, 165–179. [Google Scholar] [CrossRef]
  3. Liu, H.; Li, P.; Wang, K. The flow downstream of a bifurcation of a flow channel for uniform flow distribution via cascade flow channel bifurcations. App. Therm. Eng. 2015, 81, 114–127. [Google Scholar] [CrossRef]
  4. Liu, H.; Li, P.; Lew, J.V. CFD study on flow distribution uniformity in fuel distributors having multiple structural bifurcations of flow channels. Int. J. Hydrogen Energy 2010, 35, 9186–9198. [Google Scholar] [CrossRef]
  5. Huang, C.; Lv, W.J.; Wang, J.G.; Wang, J.Y.; Wang, H.L. Uniform distribution design and performance evaluation for uu-type parallel mini-hydro cyclones. Sep. Purif. Technol. 2014, 125, 194–201. [Google Scholar] [CrossRef]
  6. Commenge, J.M.; Saber, M.; Falk, L. Methodology for multi-scale design of isothermal laminar flow networks. Chem. Eng. J. 2011, 173, 541–551. [Google Scholar] [CrossRef]
  7. Commenge, J.M.; Falk, L.; Corriou, J.P.; Matlosz, M. Optimal design for flow uniformity in microchannel reactors. AIChE J. 2002, 48, 345–358. [Google Scholar] [CrossRef]
  8. Luo, L.; Fan, Z.; Gall, H.L.; Zhou, X.; Yuan, W. Experimental study of constructal distributor for flow equidistribution in a mini cross flow heat exchanger (MCHE). Chem. Eng. Proc. 2008, 47, 229–236. [Google Scholar] [CrossRef]
  9. Luo, L.; Wei, M.; Fan, Y.; Flamant, G. Heuristic shape optimization of baffled fluid distributor for uniform flow distribution. Chem. Eng. Sci. 2015, 123, 542–556. [Google Scholar] [CrossRef]
  10. Luo, L.; Tondeur, D. Multiscale optimization of flow distribution by constructal approach. China Particuol. 2005, 3, 329–336. [Google Scholar] [CrossRef]
  11. Lalot, S.; Florent, P.; Lang, S.K.; Bergles, A.E. Flow maldistribution in heat exchangers. Appl. Therm. Eng. 1999, 19, 847–863. [Google Scholar] [CrossRef]
  12. Fan, Z.; Zhou, X.; Luo, L.; Yuan, W. Experimental investigation of the flow distribution of a 2-dimensional constructal distributor. Exp. Therm. Fluid Sci. 2008, 33, 77–83. [Google Scholar] [CrossRef]
  13. Purimetla, A.; Cui, J. CFD studies on burner secondary airflow. Appl. Math. Model. 2009, 33, 1126–1140. [Google Scholar] [CrossRef]
  14. Zhang, T.H.; Liu, F.G.; You, X.Y. Optimization of gas mixing system of premixed burner based on CFD analysis. Energy Convers. Manag. 2014, 85, 131–139. [Google Scholar] [CrossRef]
  15. Heggemann, M.; Hirschberg, S.; Spiegel, L.; Bachmann, C. CFD Simulation and experimental validation of fluid flow in liquid distributors. Inst. Chem. Eng. 2007, 85, 59–64. [Google Scholar]
  16. Perta, E.S.D.; Agizza, M.A.A.; Sorrentino, G.; Boccia, L.; Pindozzi, S. Study of aerodynamic performances of different wind tunnel configurations and air inlet velocities, using computational fluid dynamics (CFD). Comput. Electron. Agric. 2016, 125, 137–148. [Google Scholar] [CrossRef]
  17. Remie, M.J.; Cremers, M.G.G.; Schreel, K.R.A.M.; Goey, L.P.H. Analysis of the heat transfer of an impinging laminar flame jet. Int. J. Heat Mass Transf. 2007, 50, 2816–2827. [Google Scholar] [CrossRef]
  18. Sahu, S.; Dewangan, M. Analysis of heat transfer characteristics of flame impinging to a plane surface perpendicular to flame jet axis. Int. J. Eng. Res. Technol. 2013, 2, 578–593. [Google Scholar]
  19. Tajik, A.R.; Kuntikana, P.; Prabhu, S.V.; Hindasageri, V. Effect of preheated mixture on heat transfer characteristics of impinging methane–air premixed flame jet. Int. J. Heat Mass Transf. 2015, 86, 550–562. [Google Scholar] [CrossRef]
  20. Chien, Y.C.; Dunn-Rankin, D. Electric field induced changes of a diffusion flame and heat transfer near an impinging surface. Energies 2018, 11, 1235. [Google Scholar]
  21. Liu, Y.F.; Xiang, Q.; Li, Z.; Yao, S.Z.; Liang, X.Y.; Wang, F. Experiment and simulation investigation on the characteristics of diesel spray impingement based on droplet impact phenomenon. Appl. Sci. 2018, 8, 384. [Google Scholar] [CrossRef]
  22. ANSYS FLUENT Theory Guide; ANSYS Inc.: Canonsburg, PA, USA, 2013; pp. 133–720.
  23. Sorrentino, G.; Ceriello, G.; Joannon, M.; Sabia, P.; Ragucci, R.; Oijen, J.; Cavaliere, A.; Goey, L.P.H. Numerical investigation of moderate or intense low-oxygen dilution combustion in a cyclonic burner using a flamelet generated manifold approach. Energy Fuels 2018, 32, 10242–10255. [Google Scholar] [CrossRef]
  24. Attarha, M.J.; Sattari-Far, I. Study on welding temperature distribution in thin welded plates through experimental measurements and finite element simulation. J. Mater. Process. Technol. 2011, 211, 688–694. [Google Scholar] [CrossRef]
  25. Akram, M.; Kumar, S.; Saxena, P. Experimental and computational determination of laminar burning velocity of liquefied petroleum gas-air mixtures at elevated temperatures. J. Eng. Gas Turbines Power 2013, 135, 1–5. [Google Scholar] [CrossRef]
Figure 1. Comparison of typical flow field and temperature distribution of a steel plate: (a) basic gas torch; (b) modified gas torch.
Applsci 08 02197 g001
Figure 2. Diagram of a basic gas torch.
Applsci 08 02197 g002
Figure 3. The inner and outer shapes of three new gas torch models: (a) model 1; (b) model 2; (c) model 3.
Applsci 08 02197 g003aApplsci 08 02197 g003b
Figure 4. Meshes and boundary conditions of a three-dimensional gas torch.
Applsci 08 02197 g004
Figure 5. Grid independence check for velocity at the outlets along the lengthwise (x) direction.
Applsci 08 02197 g005
Figure 6. (a) Basic gas torch pressure contours; (b) inner streamlines and velocity vectors at the outlets.
Applsci 08 02197 g006aApplsci 08 02197 g006b
Figure 7. Pressure contours at the middle plane of the three new gas torches: (a) model 1; (b) model 2; (c) model 3.
Applsci 08 02197 g007aApplsci 08 02197 g007b
Figure 8. Figure8. Inner streamlines and velocity vectors at the outlet of the three new gas torches: (a) model 1; (b) model 2; (c) model 3.
Applsci 08 02197 g008aApplsci 08 02197 g008b
Figure 9. Exit velocity distribution along the lengthwise direction of the basic and three new gas torches.
Applsci 08 02197 g009
Figure 10. Comparison of velocity uniformity index at the outlet between the basic torch and the three new gas torches as a function of pressure drop.
Applsci 08 02197 g010
Figure 11. Schematic diagram of steel preheating process with gas torch, fluid domain, and steel plate. (a) A half model (x-y plane cut view); (b) three-dimensional magnified view of the quarter model; (c) mesh model of the quarter model.
Applsci 08 02197 g011aApplsci 08 02197 g011b
Figure 12. The temperature contours of a combustion flame zone at the center-line view during the steel-plate preheating process: (a) basic model; (b) modified model.
Applsci 08 02197 g012aApplsci 08 02197 g012b
Figure 13. The species mole fraction and temperature variations of the stoichiometric LPG/air mixture for the basic model, modified model, and Akram’s results [25].
Applsci 08 02197 g013
Figure 14. Experimental apparatus setup: (a) basic model; (b) modified model; (c) back side (1: thermocouples, 2: TVS-200EX infrared camera, 3: recorder for thermocouples).
Applsci 08 02197 g014aApplsci 08 02197 g014b
Figure 15. Steel-plate temperature distribution at the back side with incomplete combustion (Φ = 1.4): (a) basic model experiment; (b) basic model simulation; (c) modified model experiment; (d) modified model simulation.
Applsci 08 02197 g015aApplsci 08 02197 g015b
Figure 16. Steel-plate temperature distribution at the back side with complete combustion (Φ = 1.0): (a) basic model experiment; (b) basic model simulation; (c) modified model experiment; (d) modified model simulation.
Applsci 08 02197 g016
Figure 17. Comparison of the temperature distribution at the back side of the steel plate from the center to the edge for complete combustion.
Applsci 08 02197 g017
Table 1. Specifications of a basic gas torch.
ParametersDimensions (mm)
Inlet diameter35
Outlet diameter (d)2
Rectangular shape length480
Number of holes115
Table 2. The dimensions of inner and outer shapes of the three new models.
Model 1Model 2Model 3
Guide vane holes diameters (dh)3–4.5 mm3 mm3–3.5 mm
Guide vane length (l)480 mm30 mm100 mm
Guide vane width (w)25 mm25 mm25 mm
Guide vane angle (α)160 degrees160 degrees160 degrees
Outer shape height (hp, ht)-63 mm63 mm
Outer shape angle (αp, αt)-45 degrees45 degrees
Y-branch pipes diameter (dp)-15 mm-
Table 3. Boundary conditions and numerical method.
Gauge pressure inlet100–500 Pa
Gauge pressure outlet0 Pa
WallsNon-slip wall
Turbulent modelStandard k-ε
Convergence criterion10−4

