1. Introduction
Over the past two decades, terahertz (THz) and gigahertz (GHz) technologies have grown in importance and visibility as emerging techniques to be applied in a variety of fields. This has been possible thanks to recent advances in combining optical and electronic methods, which have enabled the generation and detection of very high signal-to-noise ratio and high data-acquisition rates—in particular in the spectral range between 0.1 and 3 THz [
1,
2,
3,
4,
5,
6], often referred to as the “Terahertz gap”, because these frequencies lie in a region where two means of generation: electronic, for low frequencies, and optical, for high frequencies, reach their technological limits [
7,
8]. For this reason, a small number of studies about the interactions between radiation and matter has been carried out at these frequencies, due to the difficulty in generating and detecting THz radiation.
Experimental results from various research fields have suggested that spectra in the THz spectral region mainly depend on molecular and intermolecular behavior such as hydrogen bond and phonon absorptions [
9], although not all the absorption bands occurring in the THz region are unambiguously assigned [
10,
11]. However, as compared with IR spectroscopic techniques, THz-TD spectroscopy has the advantage that it measures the transient electric field, and not simply its intensity [
8]. Coherent detection allows the direct determination of both the amplitude and the phase of each of the spectral components making up the pulse. This means that it is possible to compute the absorption coefficient and refractive index of the sample from the amplitude and phase. In this respect, THz spectroscopy provides a convenient method for determining the complex permittivity [
12,
13]. In the GHz region considered in the present paper (20–150 GHz), the presence of inhomogeneity or material discontinuities in the subsurface can be detected non-invasively by recording the dielectric contrast in composite materials by means of a measurement of the resonance frequency (F maps) and quality factor (Q maps) [
14,
15,
16].
The “National Agency for New Technologies, Energy and Sustainable Economic Development” (ENEA) has a long-term experience in powerful sources operating in this spectral range. Indeed, several free electron devices, ranging from conventional Free Electron Lasers (FELs) [
17,
18,
19] to Cherenkov [
20] and grating [
21,
22] FELs, were developed at the ENEA Center of Frascati between the 1980’s and the 1990’s. Most of these sources were able to produce radiation in the sub-mm region using powers that exceeded the kW level. It was then natural to make an investigation as to the possibility of developing imaging devices in the THz region. The development of FEL sources and applications in the THz region continued for more than two decades [
23,
24,
25] and led to the development of sources based upon innovative interaction schemes, also in the region between 0.4 and 0.8 THz.
Despite all the aspects that have already been presented and discussed in several scientific papers and books, it is evident that more research work will have to be conducted in order to optimize the results obtained with THz–GHz techniques. This is why the authors have been involved in research projects between different international academic and museum-research groups already engaged in exploring new opportunities for using GHz and THz methodologies in the art conservation field. For instance, the THz-ARTE project between Italian teams, the Italian National Agency for New Technologies, Energy and Sustainable Economic Development (ENEA) in Frascati and the “Nello Carrara” Institute of Applied Physics of the National Research Council (IFAC-CNR) in Florence, and the Japanese teams, Institute for Information and Communications Technology (NICT) in Tokyo and the Nara National Institute for Cultural Properties (NNRICP) in Nara, was focused on extending the imaging techniques mentioned above to the use of CW sources in the 20 GHz–0.3 THz range and to develop new ones, in order to provide additional information on the optical properties, not only of the sample surface, but also of the underlying materials, thus supplying information regarding the internal structure of the samples.
2. THz Imaging: First Measurements at the ENEA Center of Frascati
The first THz imaging measurements, which were carried out at the ENEA center of Frascati in 2005, made use of a Compact Free Electron Laser that operated in the spectral region between 0.1 and 0.15 THz. This source is able to provide coherent radiation with an output power of about 1.5 kW in 4 μs pulses at a maximum pulse repetition rate of 10 Hz. The first measurements were carried out on a living plant, in order to see whether it was possible to detect the hydration level of the plant’s leaves under different stress conditions, and also on the electronic chip of a smart card [
26]. The experiments were successful, showing that it is possible to follow the hydration processes in living plants and to detect the metallic part of the smartcard chip under its plastic surface. More tests were carried out in order to optimize the lateral resolution of the images, thus overcoming the diffraction limit. An upgrade of the system was a 3D mechanical scanner for the sample [
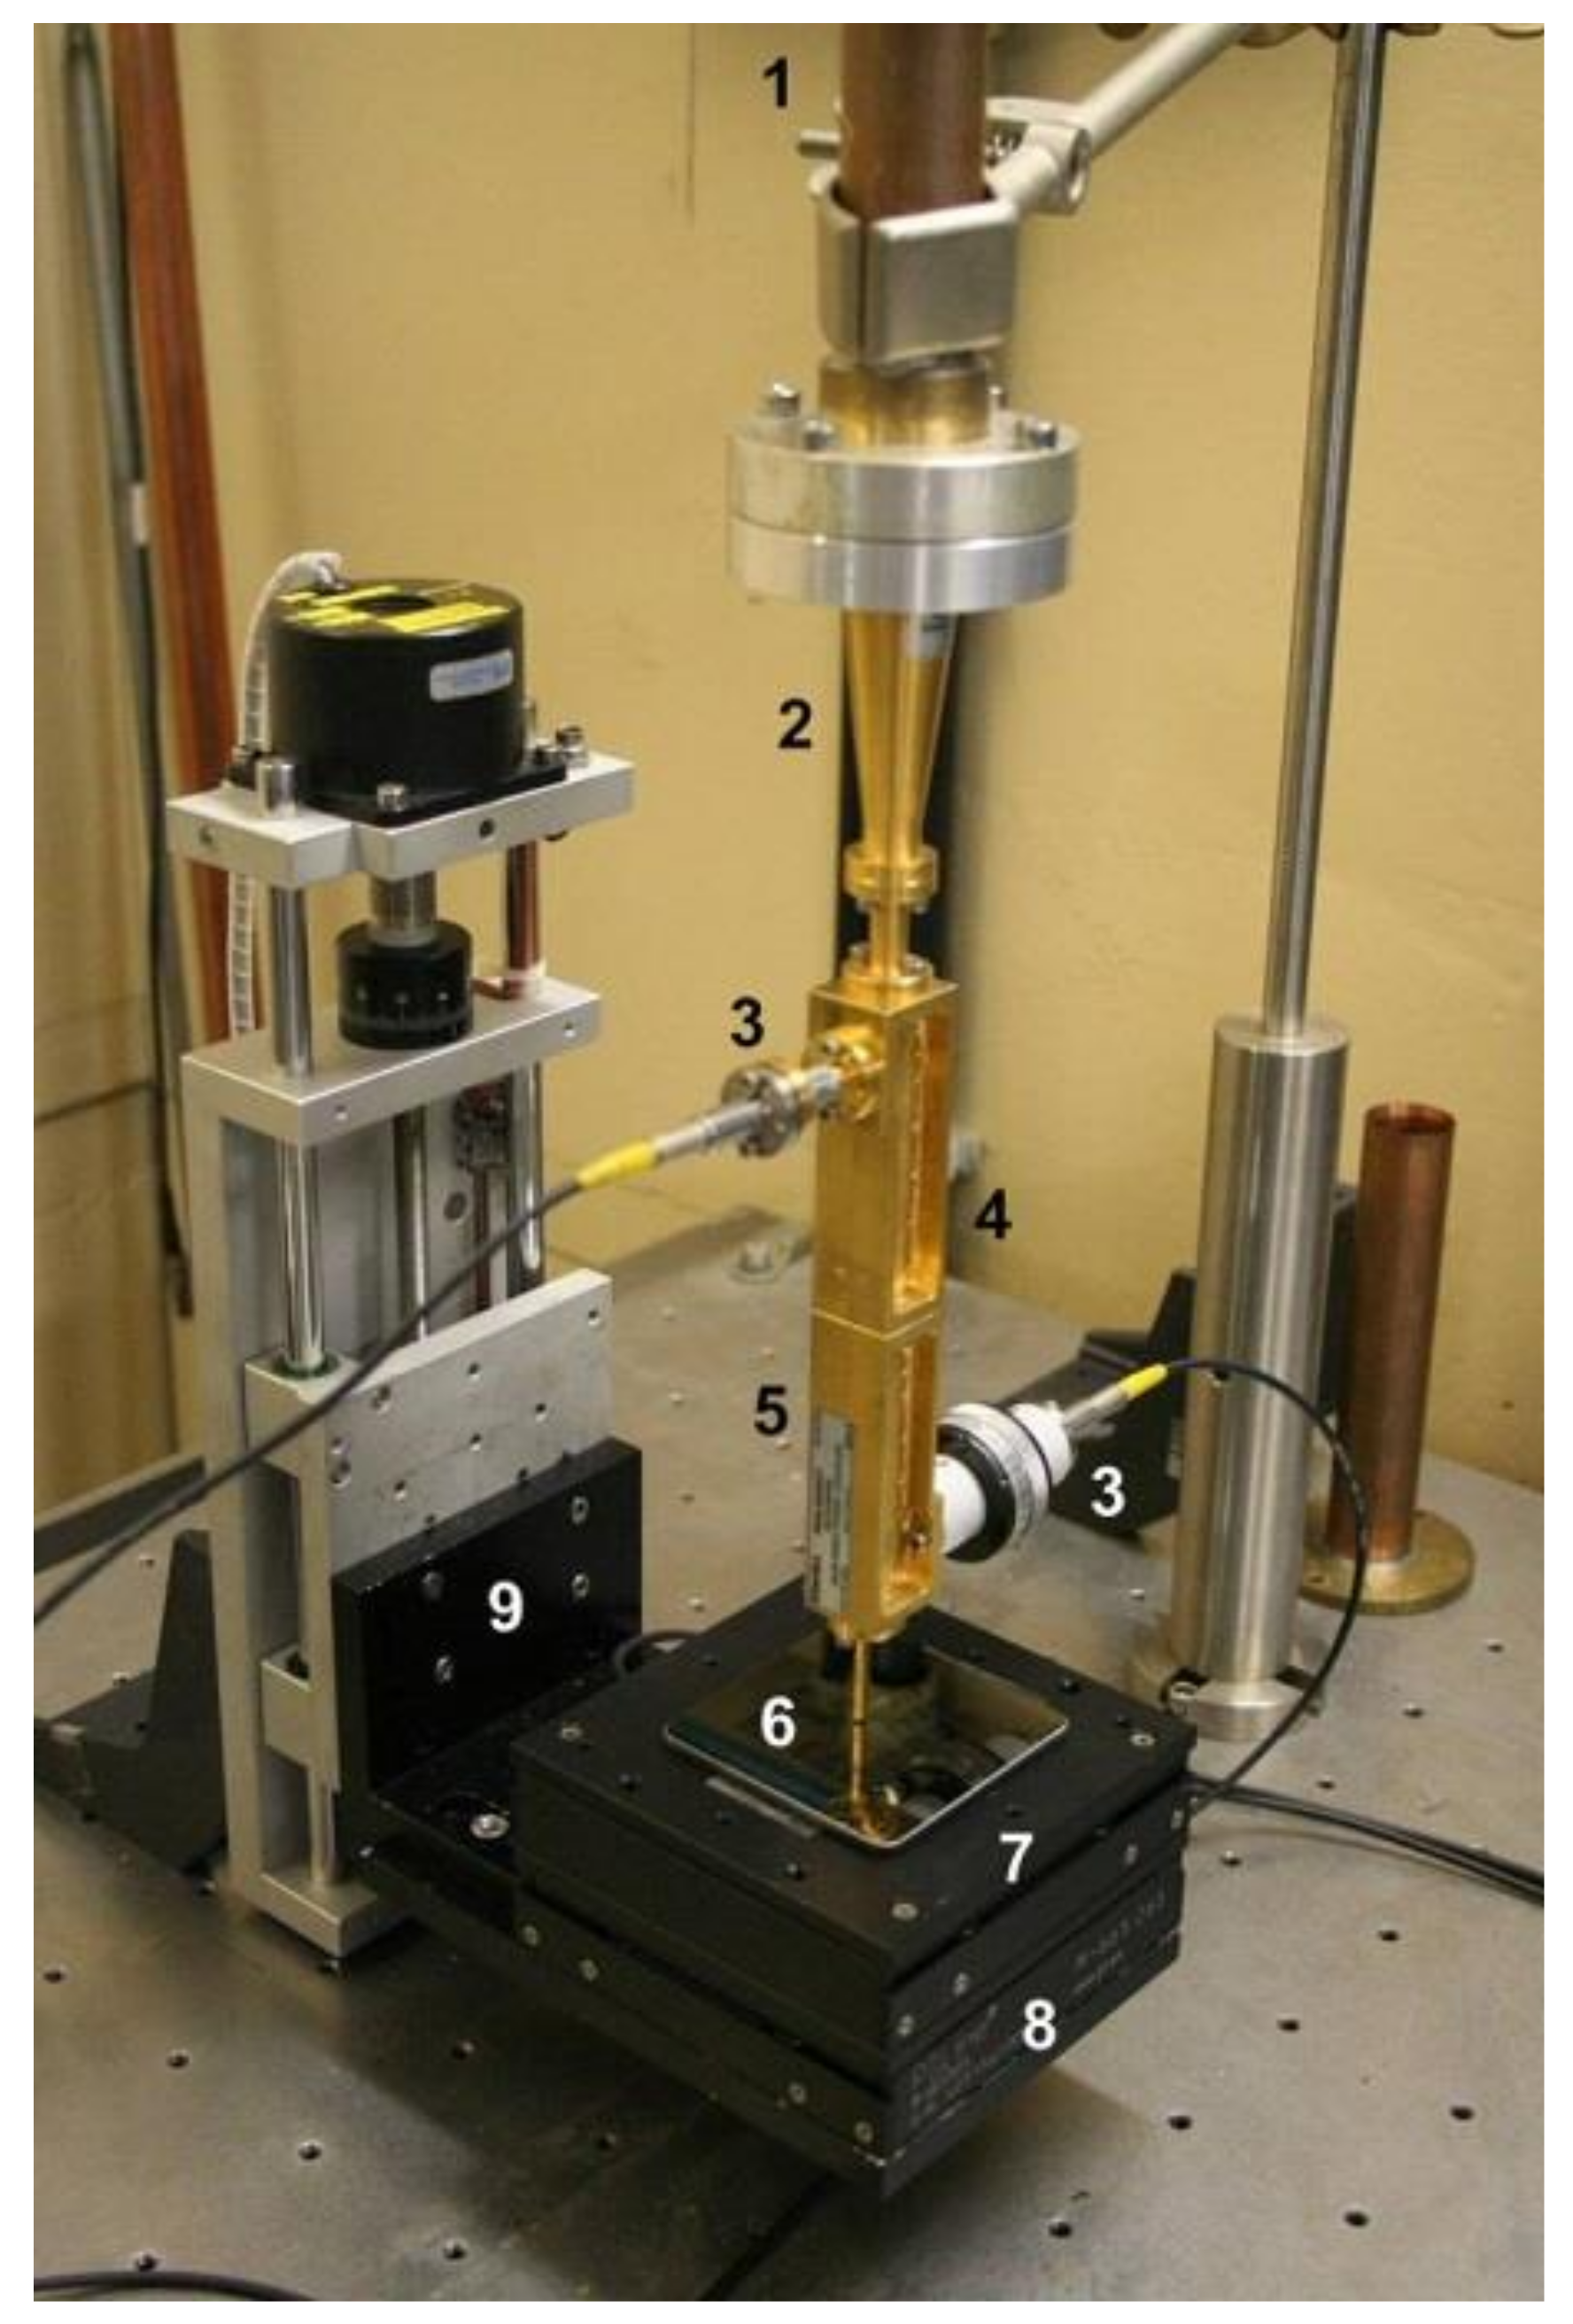
27]: an XY translational stage driven by piezomotors with a 50-mm travel range on both axes was coupled to a stepper-motor driven stage for the
z-axis, in order to provide complete control of the sample position under the irradiation head. The imaging system is shown in
Figure 1: radiation coming from the FEL is delivered to the control room by means of a copper light-pipe. Radiation is coupled into a focusing cone and injected into a waveguide system consisting of two WR6 10 dB directional couplers. A truncated WR6 waveguide is attached to the second directional coupler for launching the radiation toward the sample under investigation. Two directional couplers, providing a reference signal of the FEL radiation incident on the sample and the signal reflected by the sample, respectively, are necessary in order to normalize the output for the FEL signal fluctuations. Both signals are detected by Schottky diodes at room temperature.
Since the radiation is linearly polarized, when considering a TE
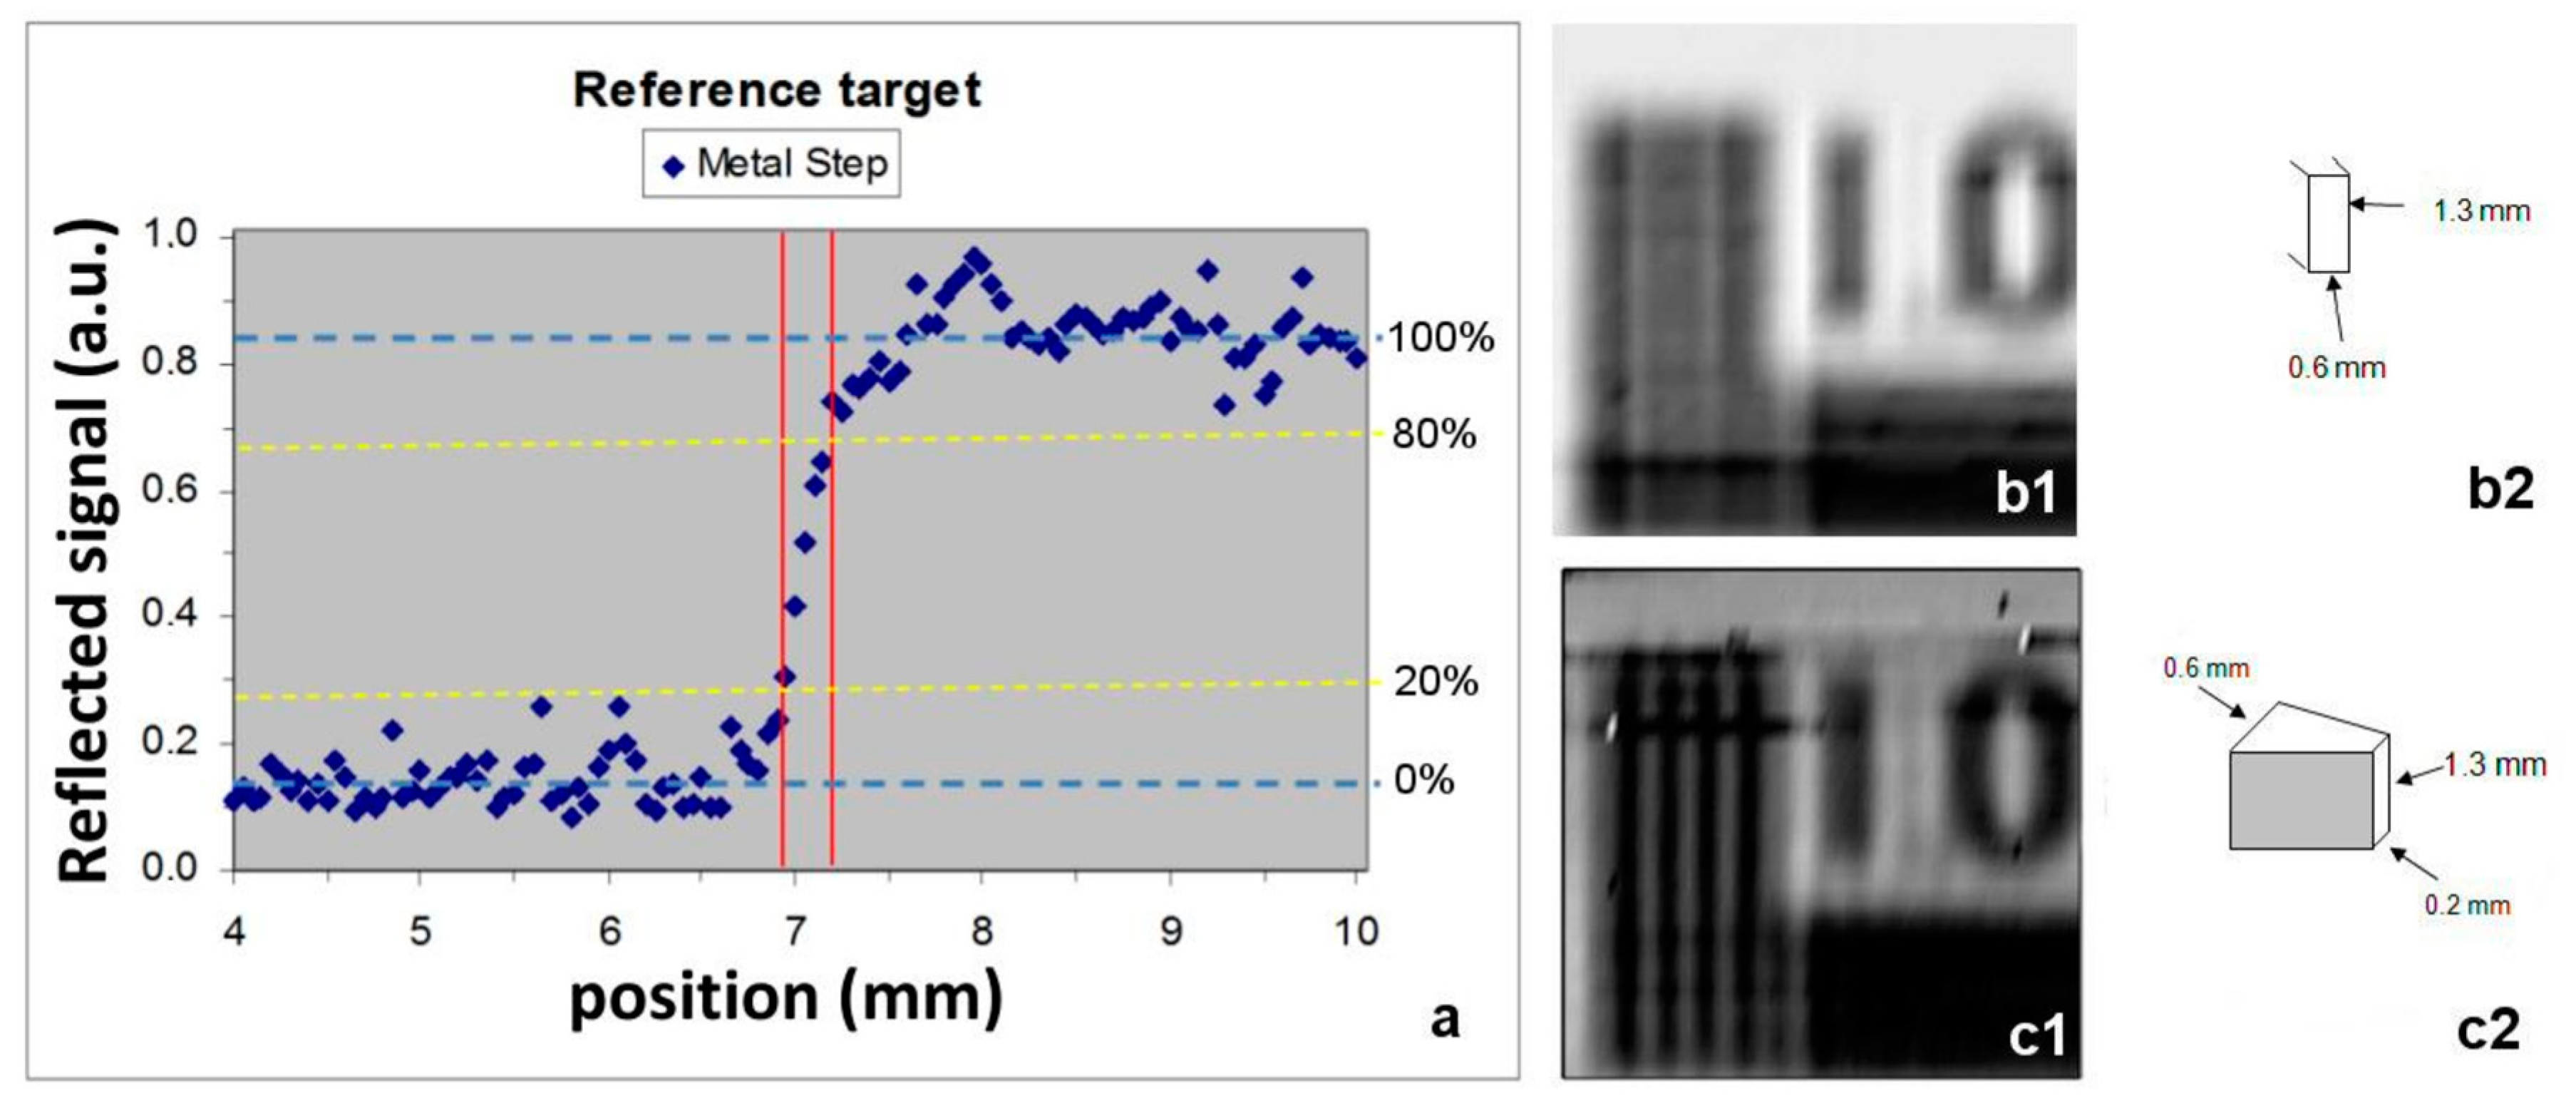
01 mode, the boundary conditions must be imposed on only one of the dimensions of the guide, while the other one can be reduced in order to obtain a better lateral resolution. Utilizing a tapered waveguide, with the shorter dimension tapered up to 0.2 mm, it was possible to overcome the diffraction limit, obtaining a 200-μm lateral resolution in one dimension. Resolution in the other dimension remains limited by the cutoff frequency, corresponding to half of the radiation wavelength in a rectangular waveguide. In order to obtain a higher resolution in both directions, it is possible to perform a second imaging scan by rotating the sample by 90° and utilizing software techniques to combine the results of the two scans. Resolution measurements were carried out with the knife-edge method and by means of Heidenhain reference targets. The THz image of a Heidenhain reference target, which was taken by using the probe head in
Figure 2(b2), is shown in
Figure 2(b1). In
Figure 2(c1), the same target was scanned using the tapered head shown in
Figure 2(c2). Enhancement of the resolution is evident. A knife-edge measurement was carried out using the tapered probe head shown in c2. The result, which is reported in
Figure 2a, confirms the resolution enhancement.
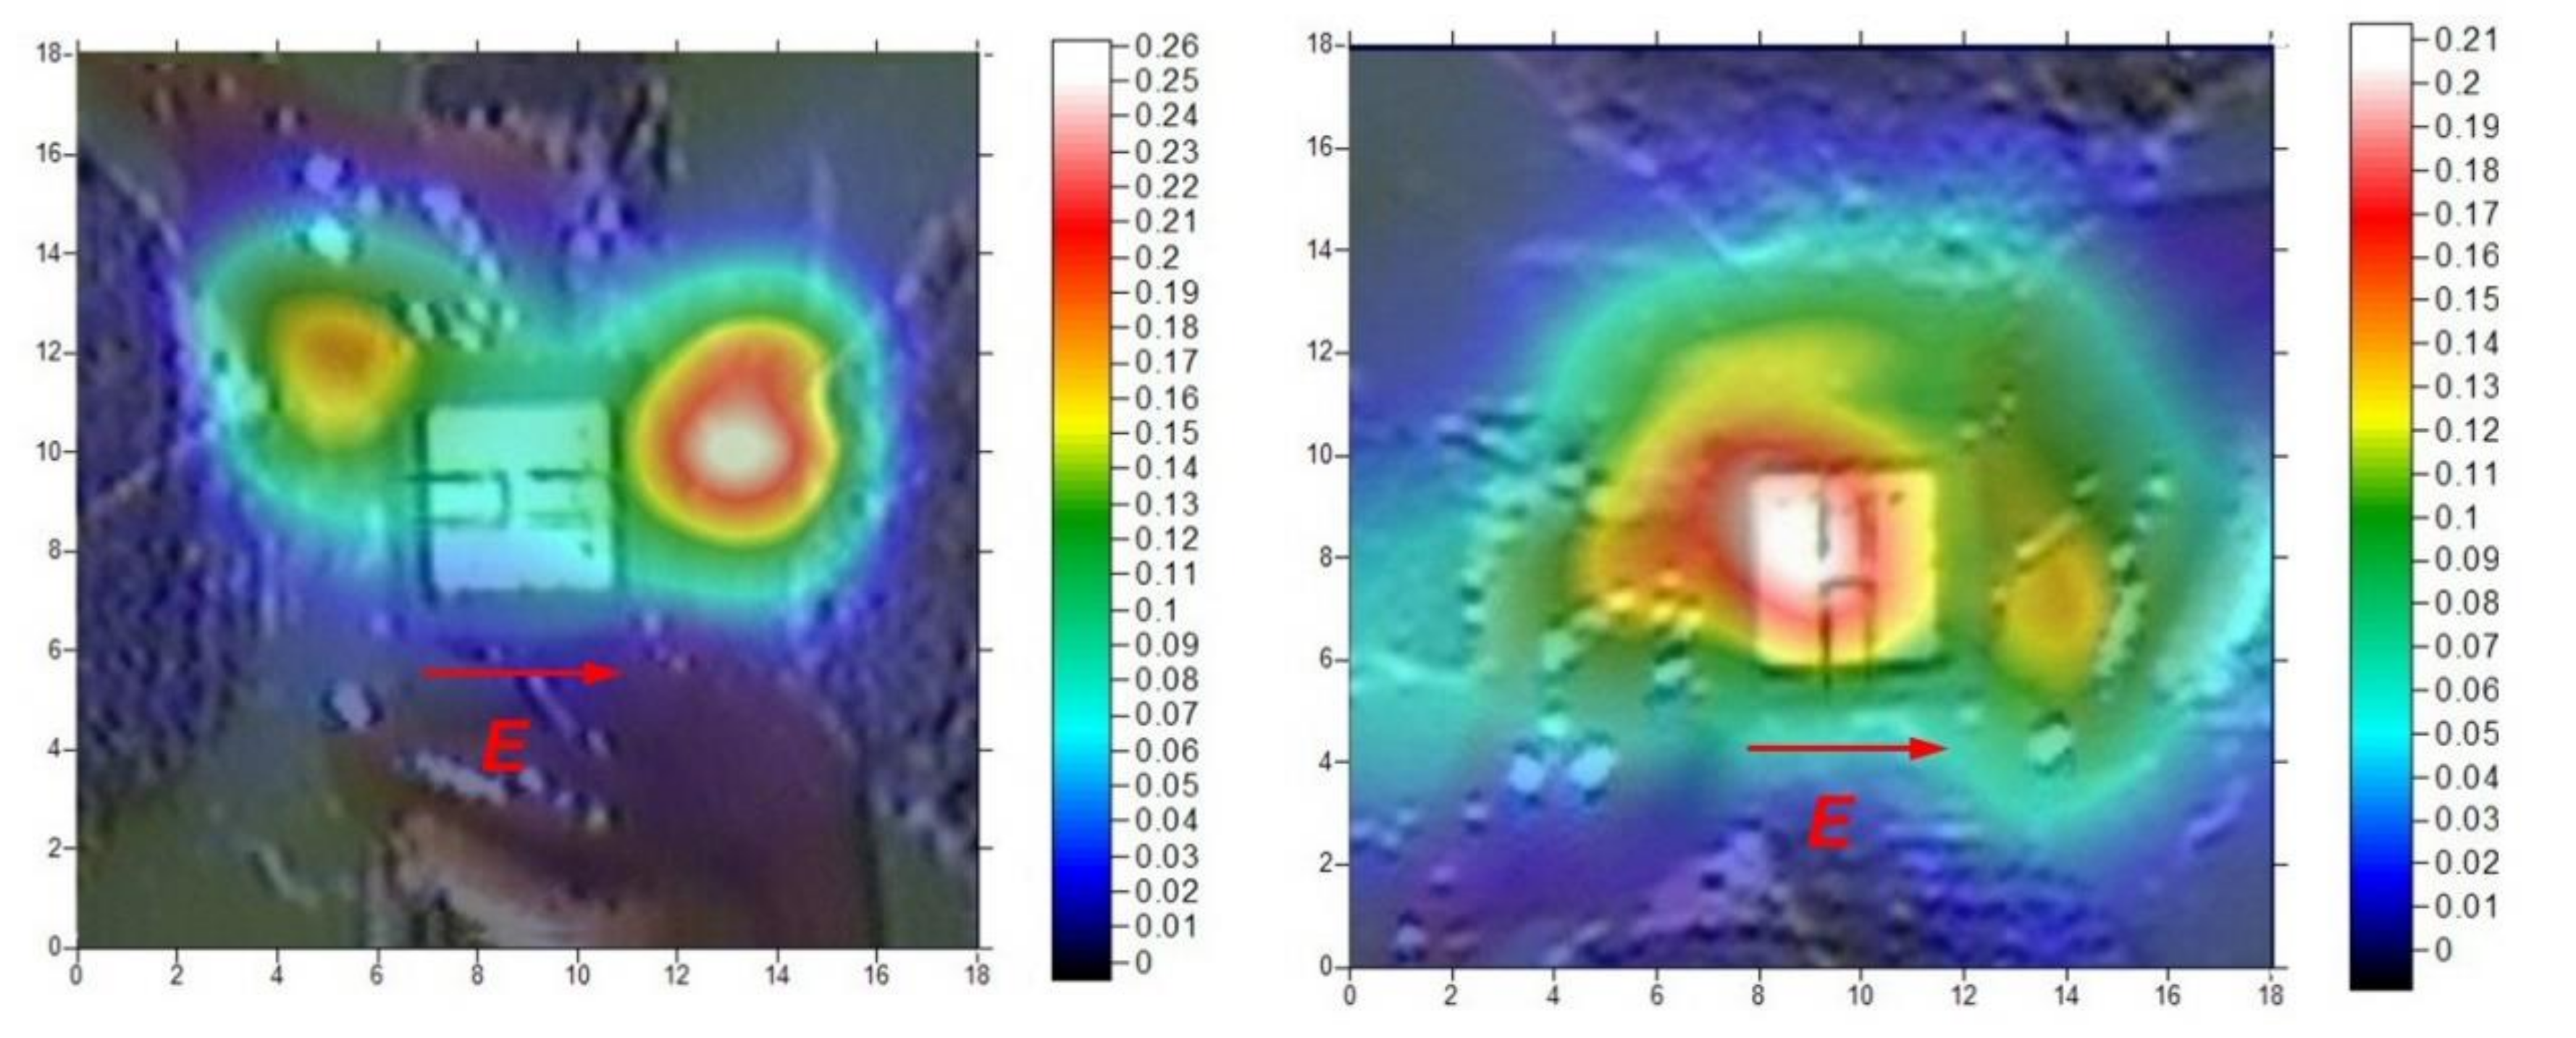
This upgraded system was used to determine the reflectivity of soils as a function of their water content. The system was also used, in 2007, to determine the active response of electronic devices to THz radiation [
28]: a novel GaN High Electron Mobility Transistor (HEMT) was excited with THz radiation and a spatial map of its response was recorded. It showed a different behavior, depending on the orientation of the radiation polarization with respect to the chip orientation (
Figure 3), and a rectifying effect of the device.
3. Theoretical Background of a New Phase-Sensitive Technique
THz imaging techniques, utilizing time-domain spectroscopy (TDS), have been used since 2008 by some of the authors [
10,
29,
30,
31,
32].
One of the limitations of this powerful technique is related to the time needed to acquire images. For every pixel of the image, in fact, a mechanical scanning of the optical delay line of the TDS system is needed, thus making the raster scanning of large areas time-consuming. This results to be a limit when the object to be imaged is unknown: in the art conservation field every sample is unique and a huge amount of data have to be collected and analyzed to get the required information [
33]. On the other hand, each pixel of the image contains information about the stratigraphy of the sample, so that the image is in fact a tomography of the sample.
The imaging system developed at the ENEA center of Frascati [
26,
27] makes use of a different physical principle for obtaining simultaneously imaging information and information about the optical properties of the sample at the irradiation frequencies. This capability made it possible to apply the said system to the study of works of art [
30]. Since the system works well in the low frequency part of the THz region (0.1–0.3 THz), it can be considered complementary, in terms of frequencies, to the standard THz-TDS systems, which usually operate at higher frequencies.
The ENEA system works in reflection mode and exploits the fact that reflection from the sample produces a phase shift of the impinging radiation that depends on the optical properties of the investigated material. The imaging system has been described in detail in the previous paragraph, and its operating physical principle is explained in detail in [
34].
For a better understanding, a brief description of the main equations that are used to describe the phenomenon is provided below.
In considering the radiation propagating along the
z-axis inside a truncated waveguide (TE
01 mode), it should be remembered that, when the radiation reaches the end of the waveguide, it is partly reflected back onto the waveguide and partly launched into free space. If
Ei = E0exp(ikzz) is the impinging radiation, at the truncation the expression for the reflected radiation is
Er = α E0exp(−i(kzz − φr)), where
α is the reflection coefficient of the truncated waveguide and
φr the phase of the reflected radiation. The rest of the radiation is launched into free space and coupled in a free space propagation mode, mainly in a Gaussian mode, then undergoing natural diffraction. The electric field along the
z-axis will then be:
where
is the fraction of the field coupled in the free space, w
0 is the beam waist at the waveguide exit, w
(z) is the beam radius at a distance
z from the waveguide end, and
Φ(z) is the Gaussian beam phase term.
When this beam impinges on a sample, it is partly reflected back, and the reflected wave is phase-shifted by an amount that depends on the sample optical properties. A fraction of this radiation is injected back into the waveguide, where it interferes constructively or destructively with the radiation reflected back by the truncated waveguide. By taking the zero for the
z-axis at the waveguide end, the mathematical expression that describes the phenomenon is:
where the term
is the complex reflectivity of the sample and contains information on the optical properties of the material.
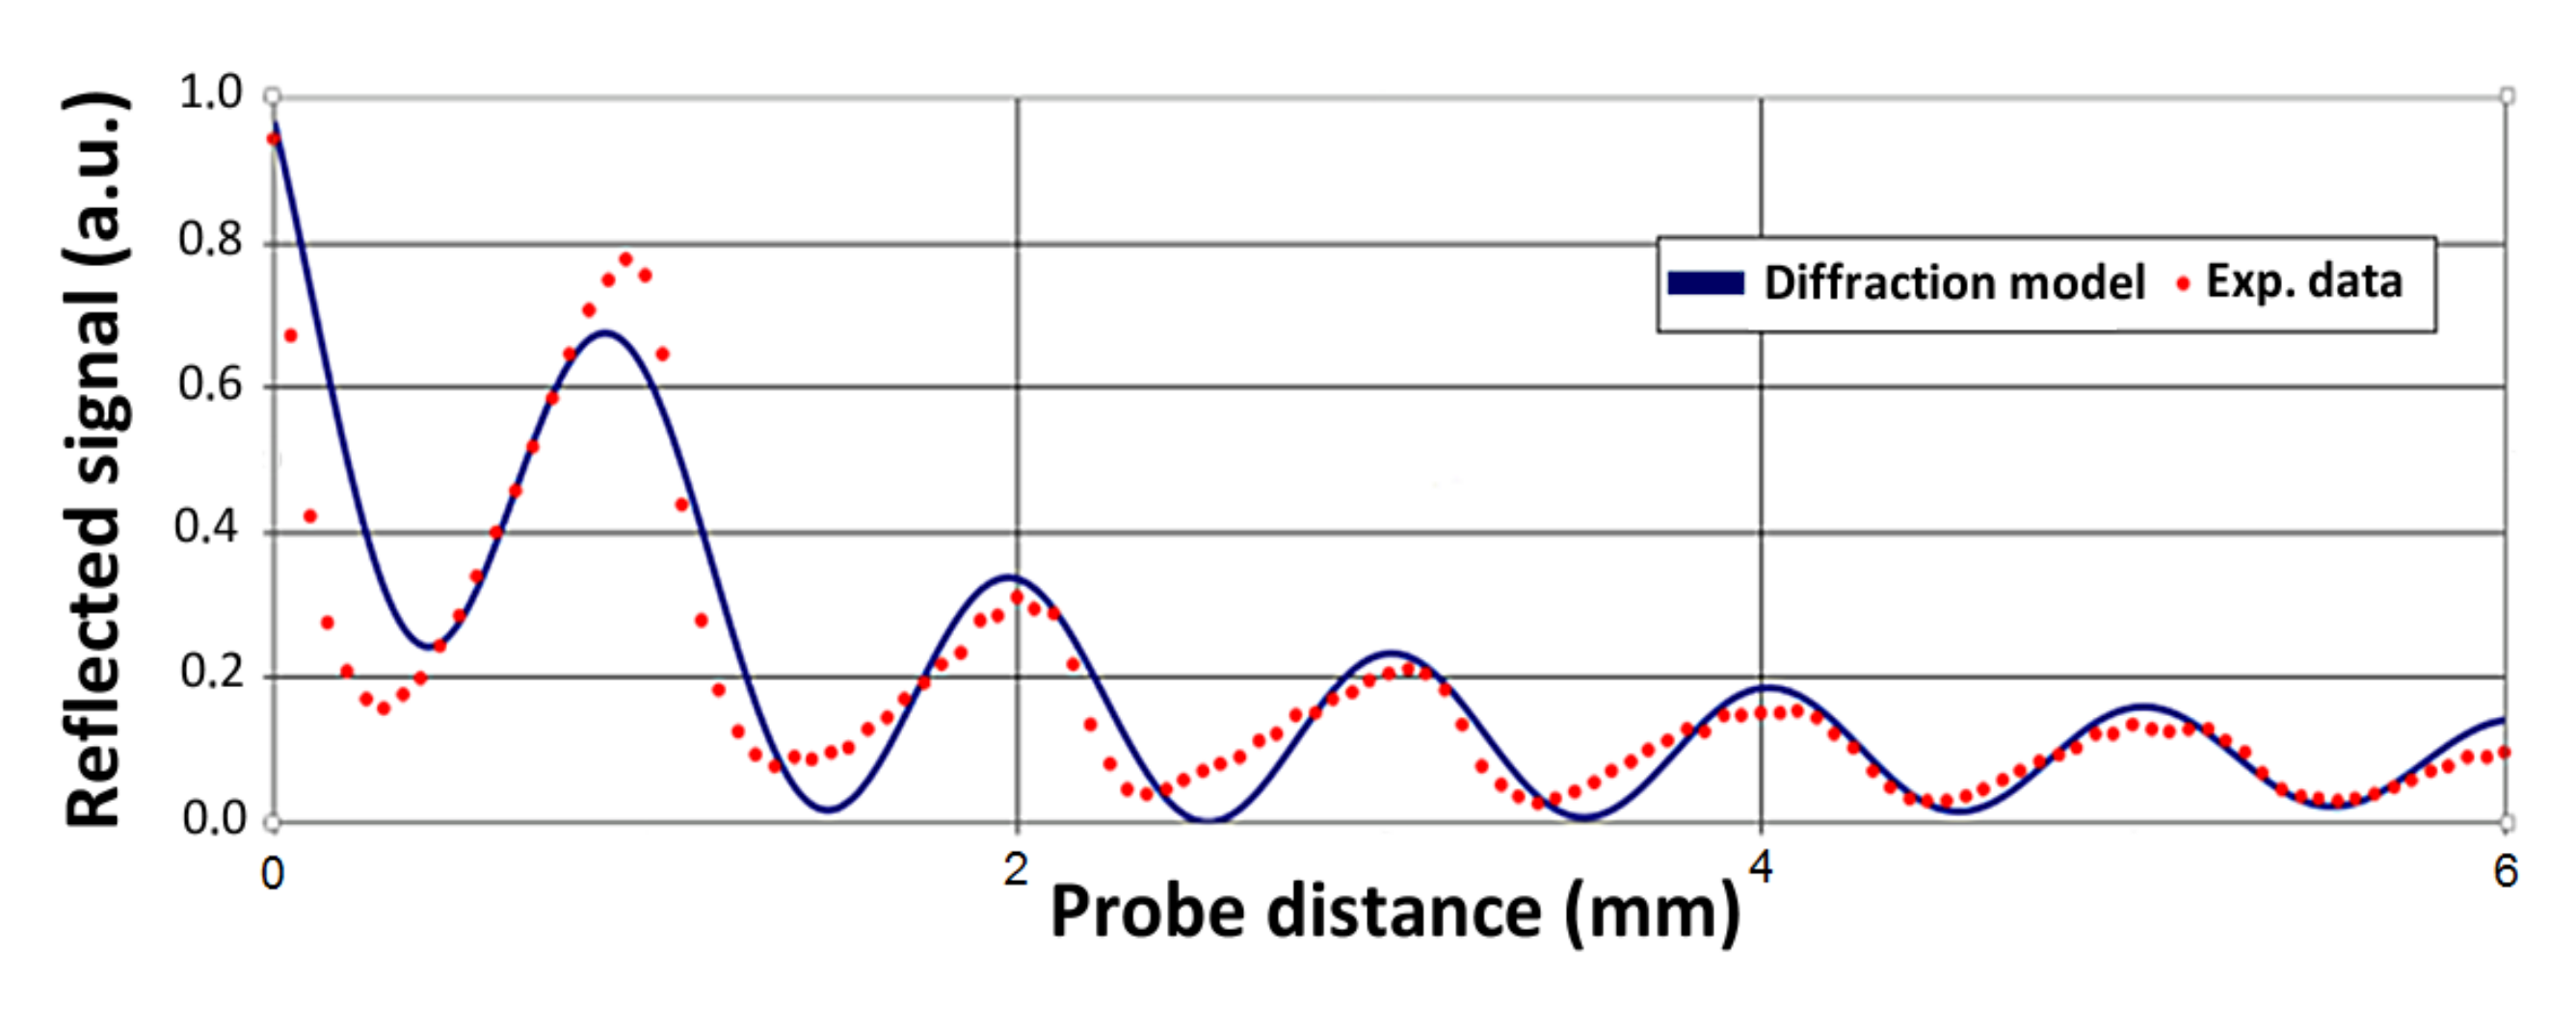
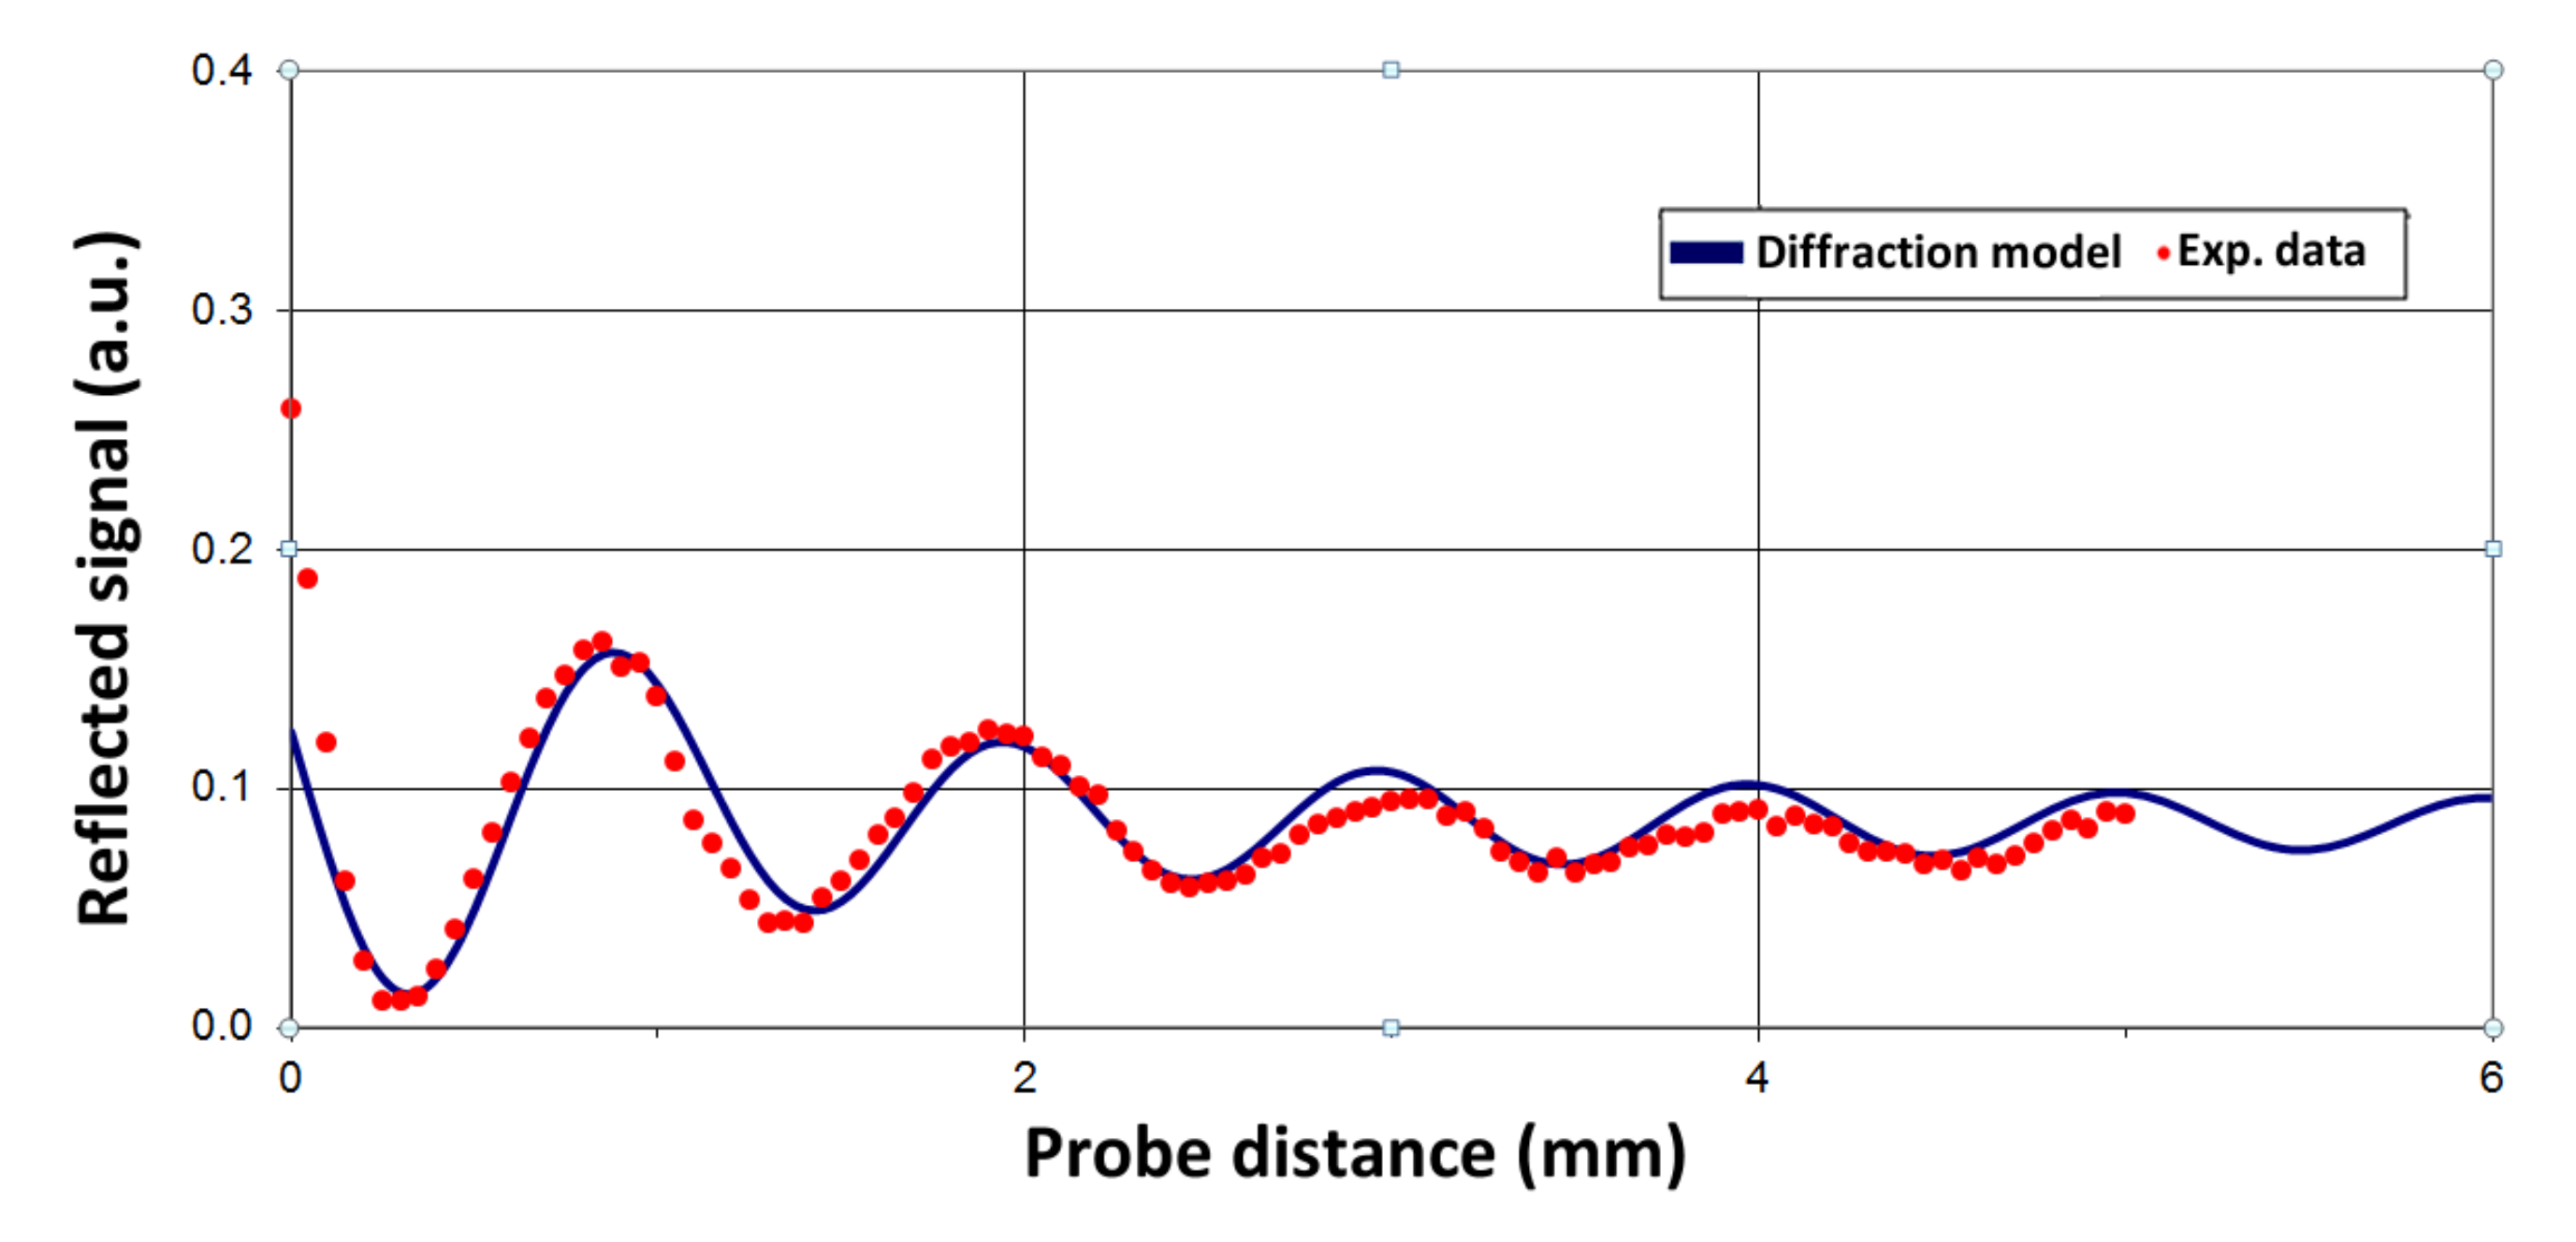
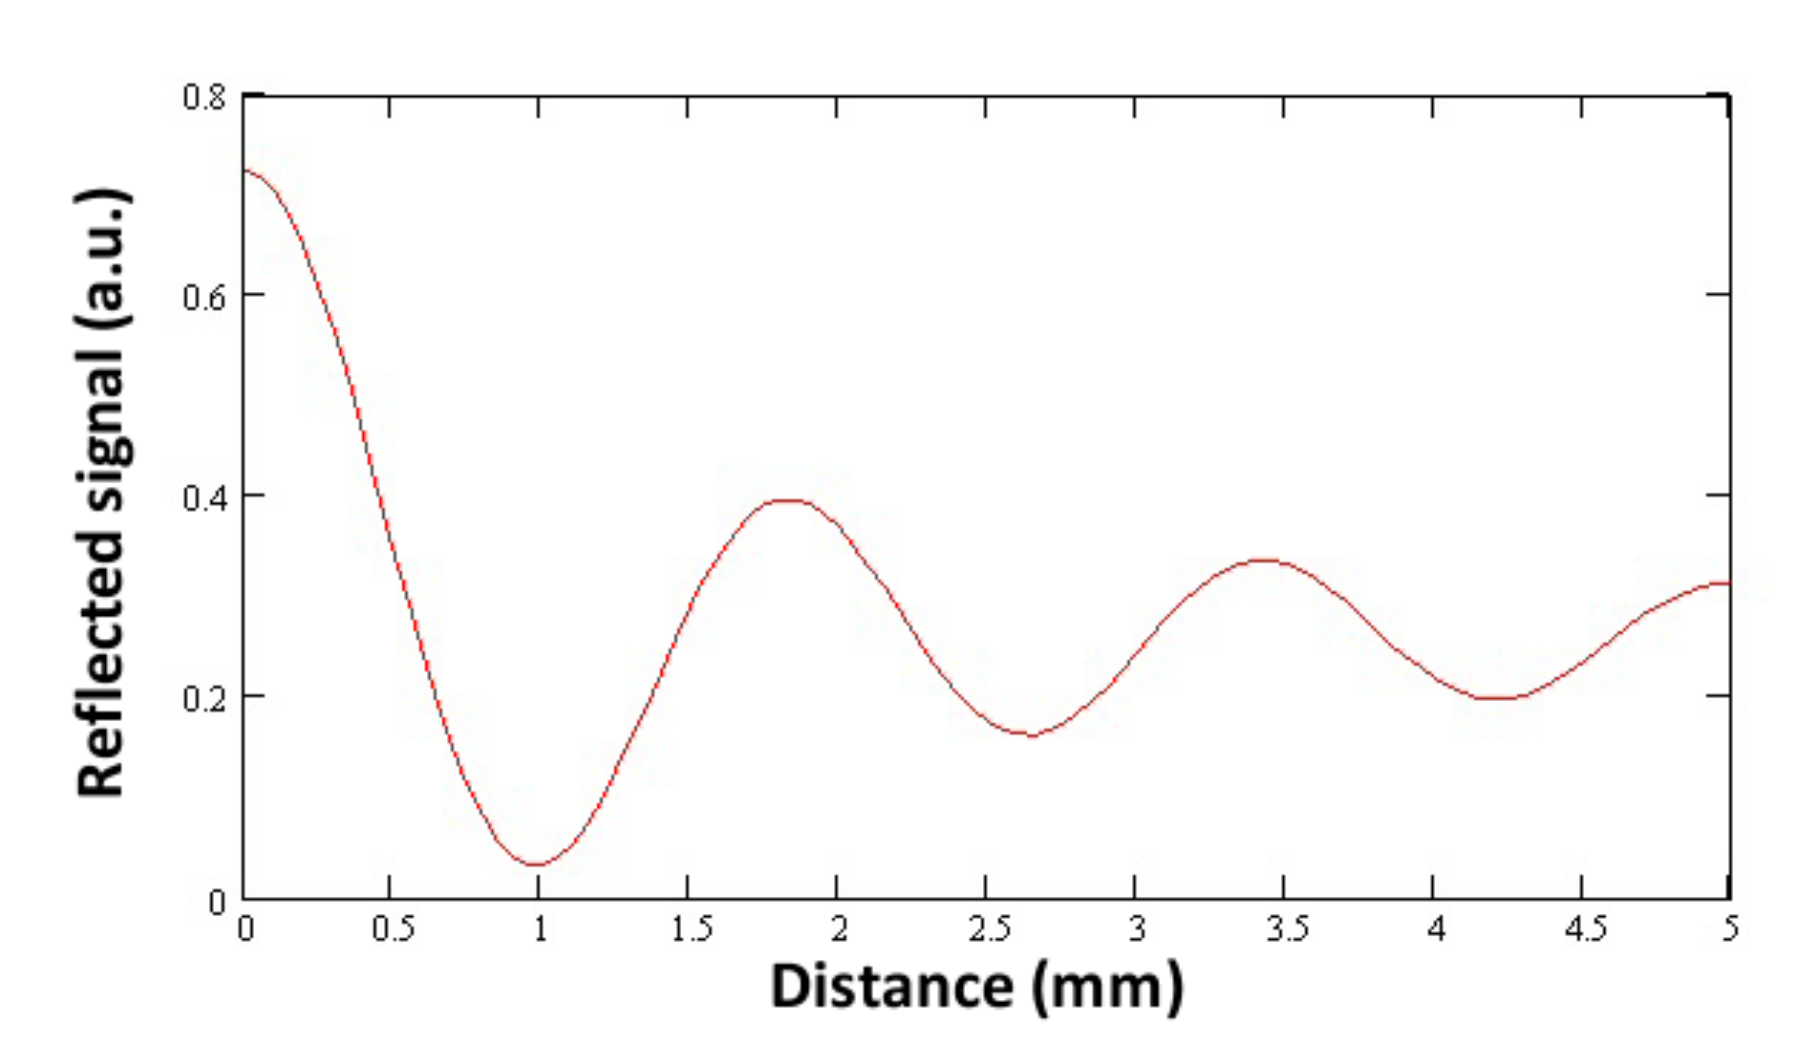
In order to extract this information it is possible to calculate the theoretical backward reflected Power, as a function of the distance d between the waveguide tip and the sample, and to perform the best fit of the experimental data, which is obtained by mechanically changing the distance, to this theoretical formula.
The typical curve shows peaks spaced half of the radiation wavelength, due to the interference of the two components of the radiation inside the waveguide. This periodical behavior is damped when the distance d between the waveguide and the sample is increased, because, due to the natural diffraction broadening, the amount of reflected radiation that is injected back into the waveguide decreases with d.
By using this method, it is possible to obtain the values for
β and
φs. Data in
Figure 4 are the results of the reflection of an aluminum plate, and these data make a good fit of the theoretical model with parameters
w0 = 0.82 mm,
α = 0.28,
β = 0.97,
φs = −3.14,
φr = −1.54.
The phase shift is not –π for a dielectric material, and the best fit can then be used to find the real and imaginary part of its refraction index. In
Figure 5, the experimental data for the blue cobalt oil (BCO) on the cyclic olefin polymer (COP) plate and the best fit are reported. Parameters for obtaining the best fit allow for predicting optical information regarding the material.
The THz Free Electron Laser (FEL) source, which operates between 100 and 150 GHz, is an ideal source for studies in art conservation. In fact, due to its peculiar pulse time structure, the FEL is able to deliver to the sample a very low average power and a very high peak power. This avoids any rise in the heating of the sample, which could result in damages while making it possible to have a very high S/N ratio thanks to the high peak power of the source.
The main advantage of this method with respect to the conventional THz-TDS imaging technique involves a faster acquisition of the image and the possibility of obtaining information about the optical properties of the sample by analyzing the phase of the reflected radiation. The mechanical scan of the distance between the sample and the probe head can be replaced by the electronic scan of the source frequency, speeding up the data acquisition time. Comparing this alternative technique to other THz imaging techniques operating with CW sources, we notice that the physical mechanism that is responsible of the so called “etalon effect” [
35], that is sometimes seen as a limit of coherent source imaging, producing annoying interference fringes on the image, is now used to obtain optical information about the sample.
4. Preliminary Imaging Tests for Art Conservation
In order to test the ability of the system to perform measurements on artworks, experiments were carried out within the framework of the bilateral pilot project THz-ARTE between ENEA-Frascati and NICT-Tokyo [
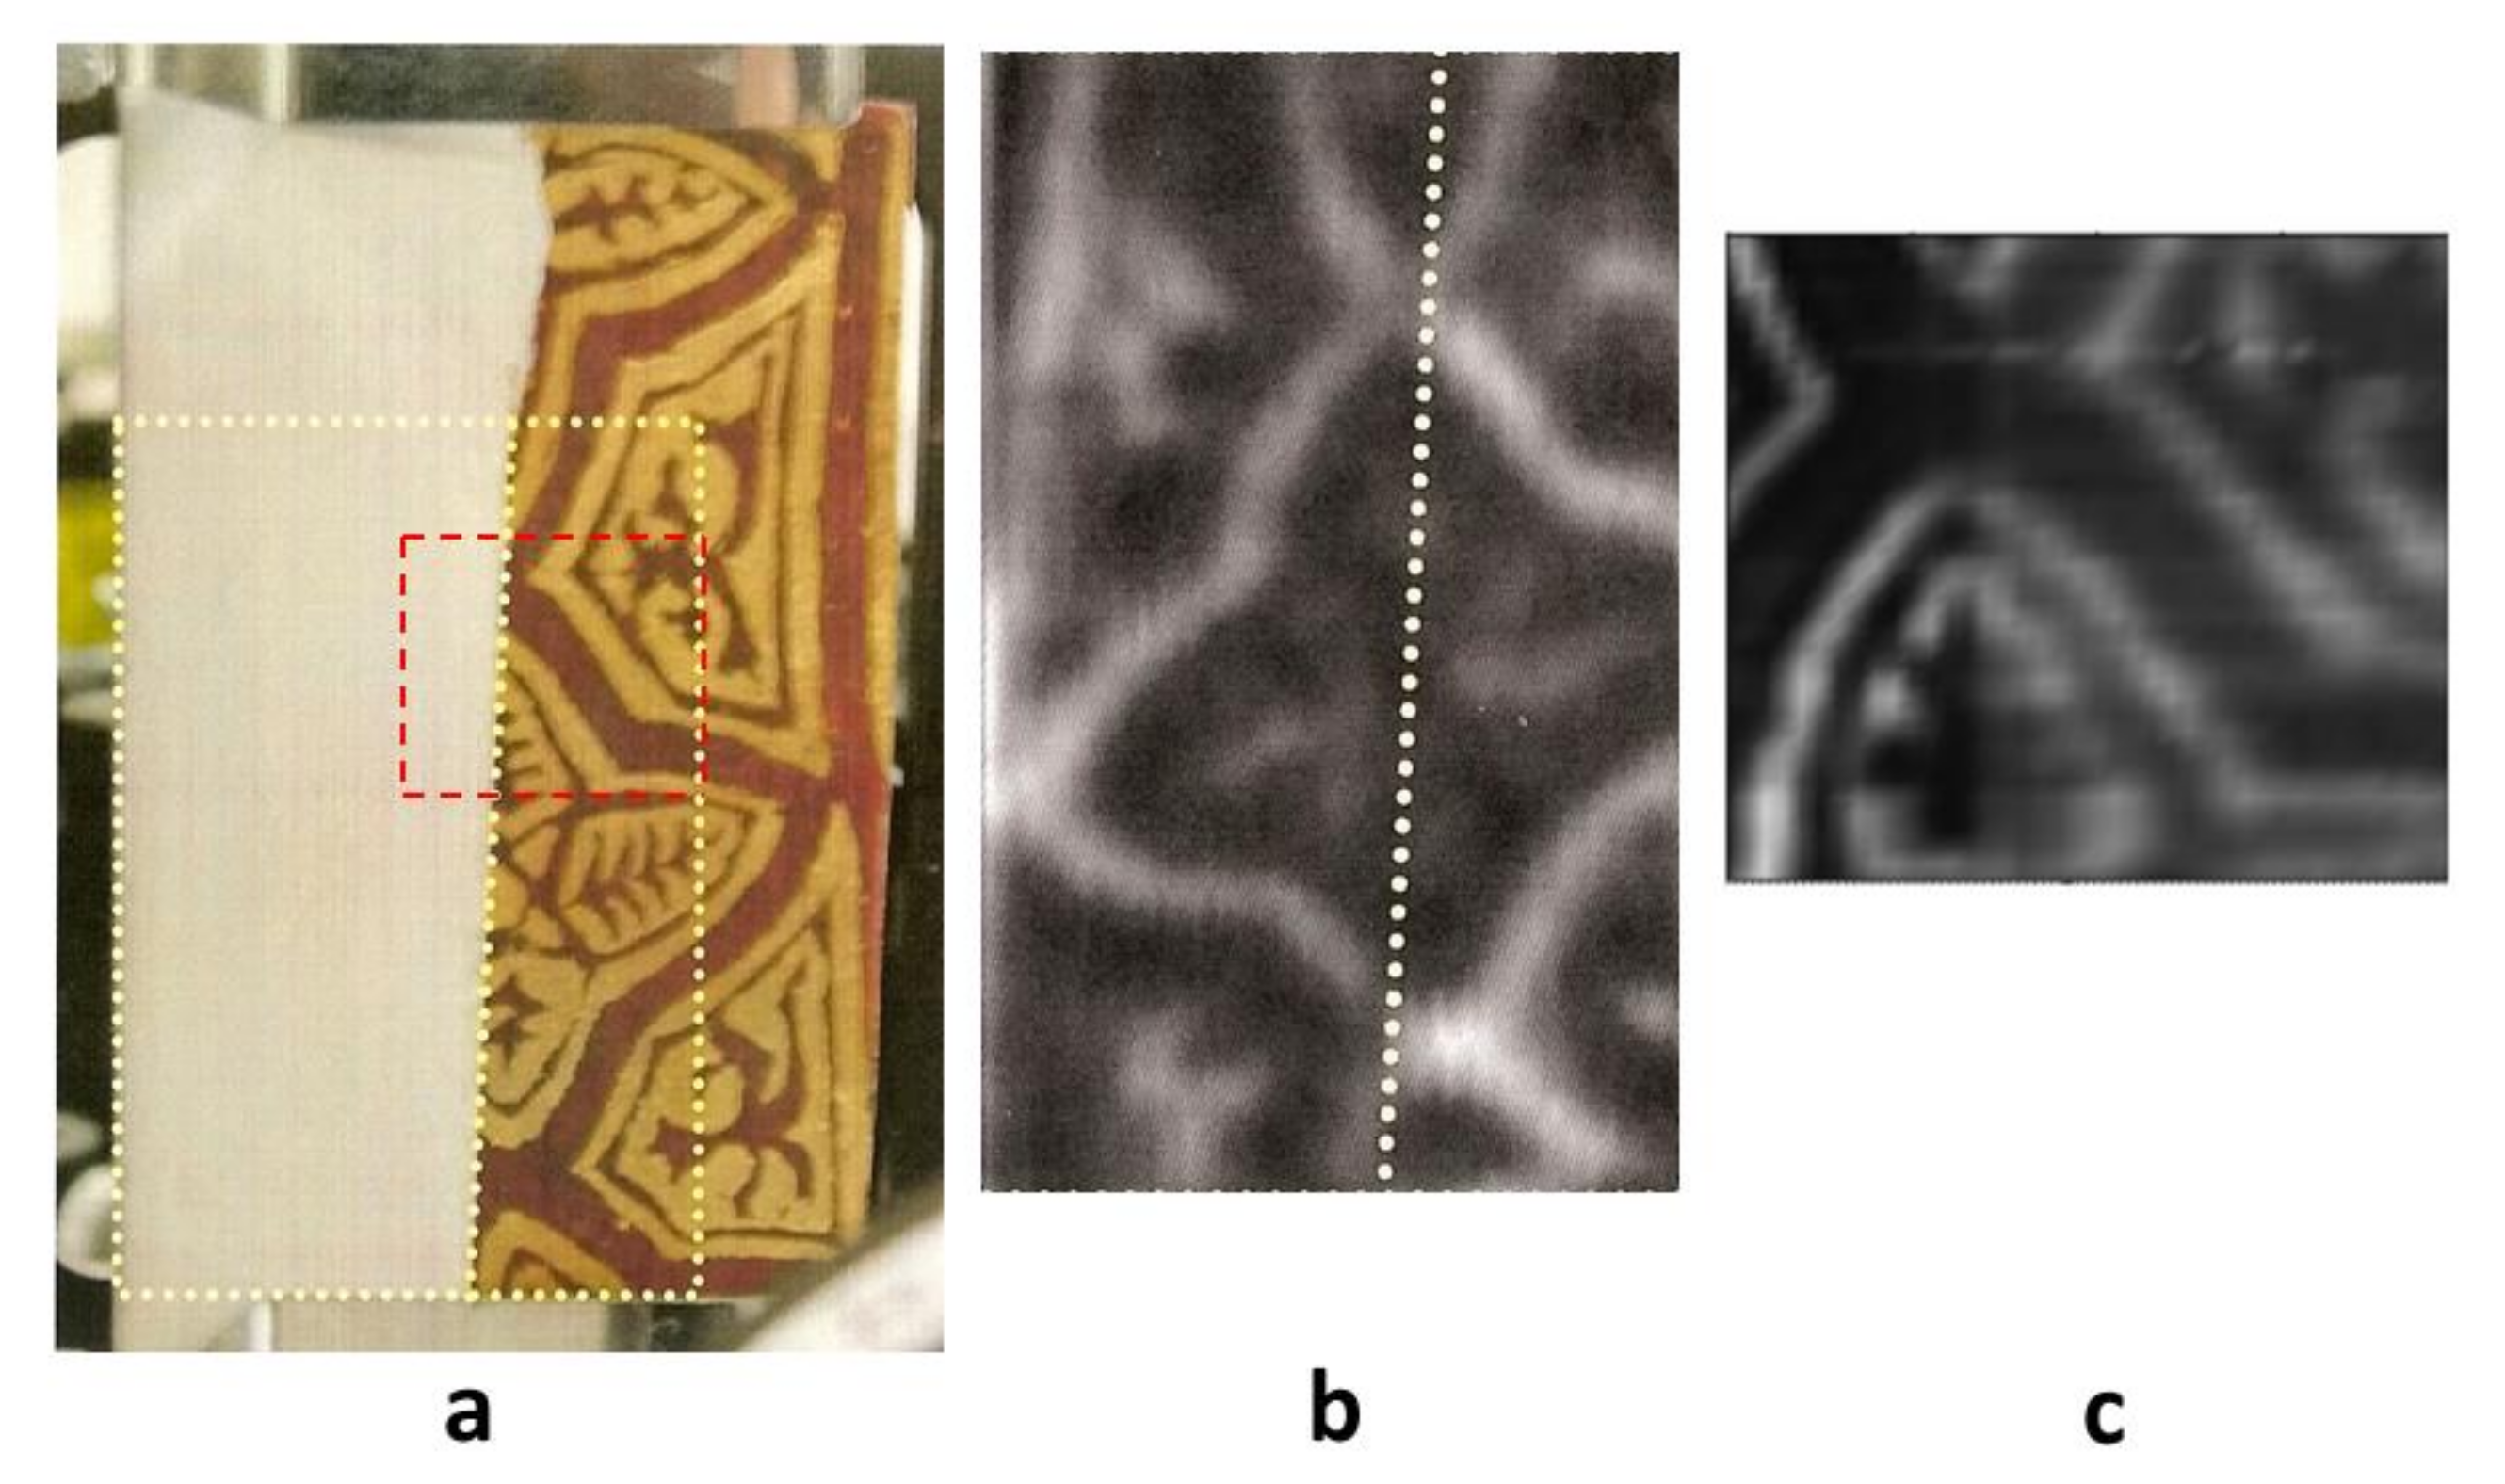
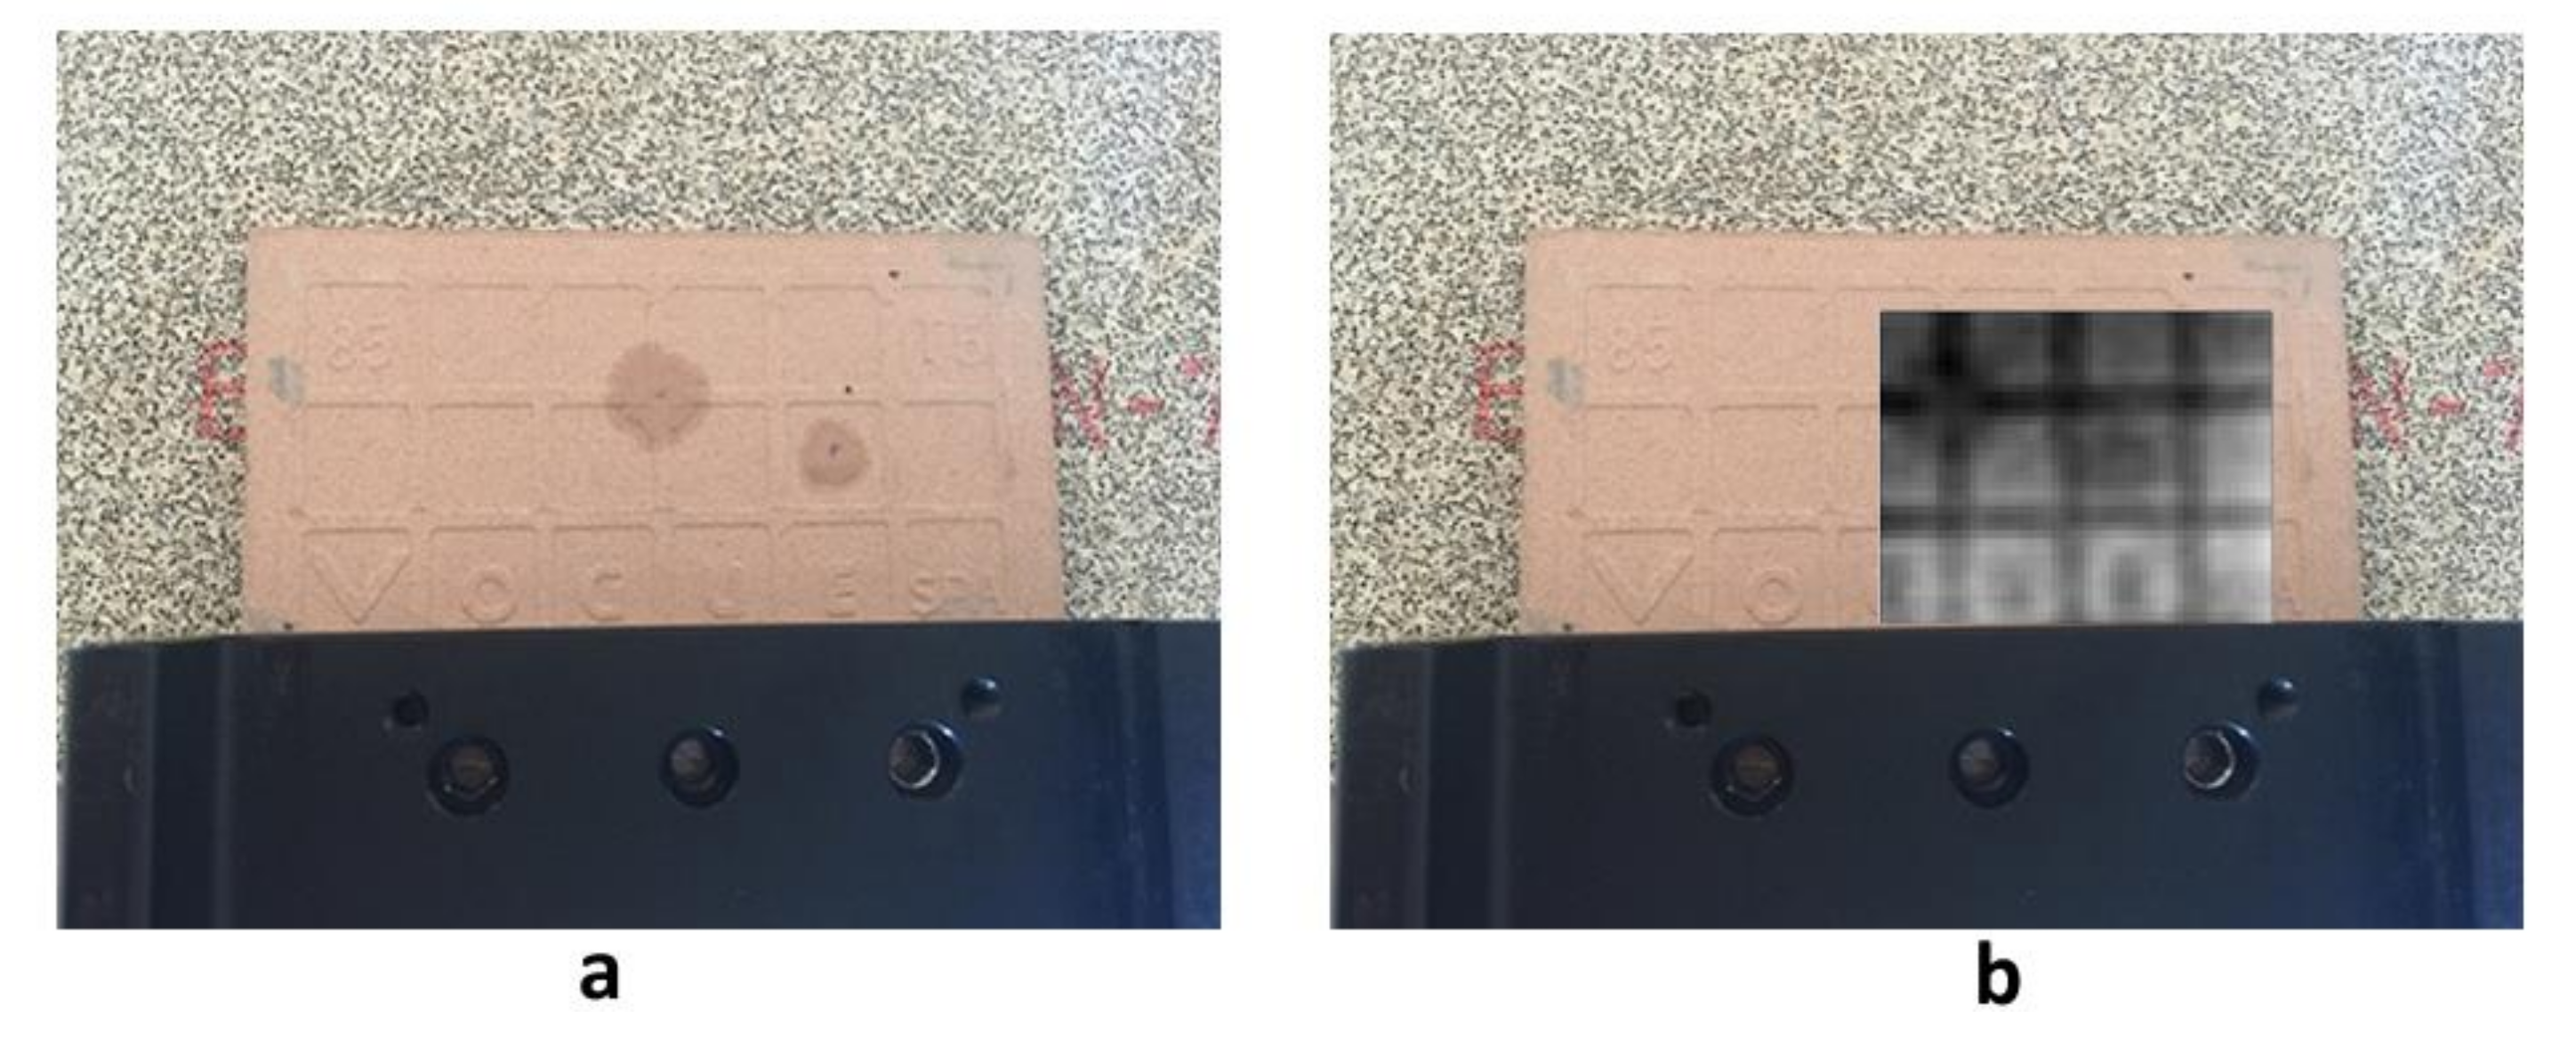
36] on a sample that was already used at NICT for THz transmission imaging. The sample was a painting on wood mock-up made with natural pigments and gold and partially covered with a gypsum layer (
Figure 6a). THz transmission imaging was performed at NICT at frequencies ranging from 0.6 to 2.6 THz, and the results confirmed the ability of the THz radiation to penetrate the gypsum layer and to show the underlying painting (
Figure 6b). A similar image was obtained with the phase sensitive technique described above (
Figure 6c) in a reflection configuration, by using THz radiation at a lower frequency (0.15 THz). It is interesting to note that the sharpness of the image was better in the area covered by gypsum. This was probably because the thickness of the gypsum layer was about one quarter of the radiation wavelength and the gypsum acted as an anti-reflection coating over the painted surface.
By exploiting the peculiar characteristic of the FEL radiation, it was possible to overcome the diffraction limit using the technique described in paragraph 2, so as to obtain a satisfactory lateral resolution for the image: FEL radiation is linearly polarized and only the fundamental mode was excited in the waveguide probe. This made possible a sub-wavelength lateral resolution if the sample was scanned along the short dimension of the waveguide cross-section. By using this technique, a lateral resolution of about 0.2 mm was measured when a wavelength of 2.6 mm radiation was used.
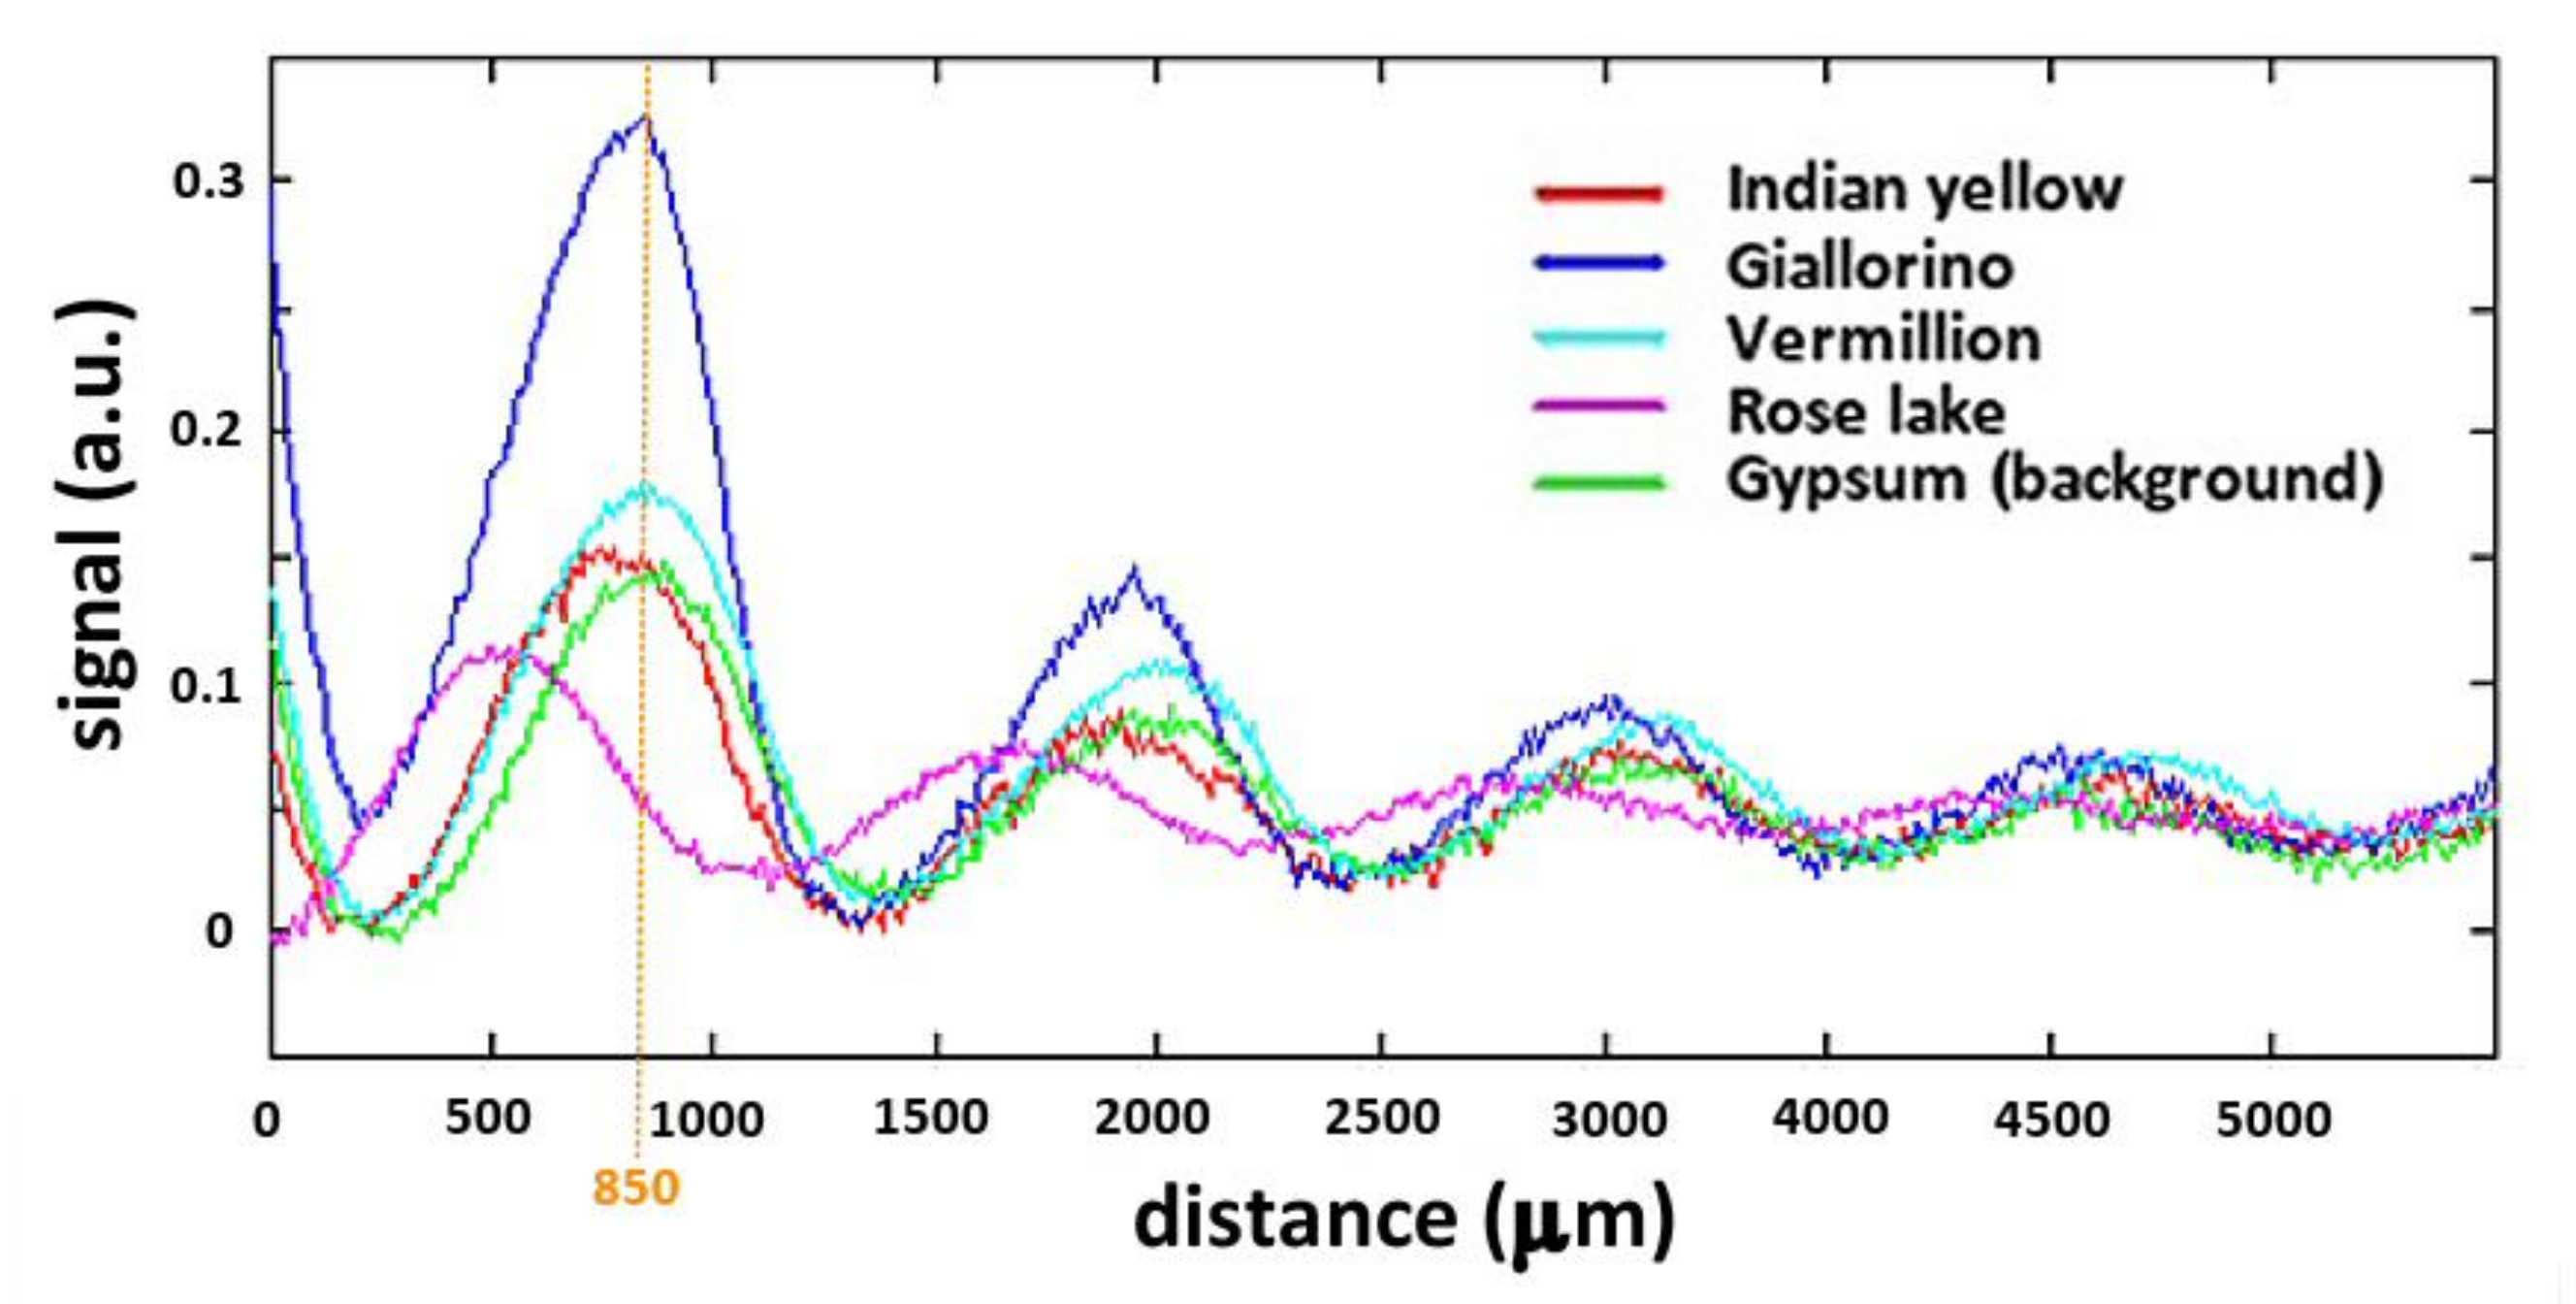
Since different materials produce different phase shifts, it is theoretically possible to distinguish the different pigments of a painting if an optimal scanning distance is chosen. The typical phase response of four different pigments (Indian yellow, giallorino, vermilion, rose lake) and of the gypsum that is used to make the preparation or ground layer is shown in
Figure 7. If we consider the graph that illustrates the curves of the five materials (four pigments and gypsum), it is possible to select an optimal distance between the probe and the surface of the mock-up, where the greatest difference in response among the investigated materials is to be found. At a distance of 850 μm, due to the different phase shift induced by the different materials, all pigments produce different signal intensities, thus making it possible to obtain a THz image in false colors. High-intensity signals can be associated with giallorino and low-intensity signals are associated with rose lake, while medium-intensity signals can be associated with vermillion or Indian yellow (or gypsum). We can then distinguish three out of four pigments in a false color image in which color is associated with signal intensity.
5. Study of Pigments and Other Materials
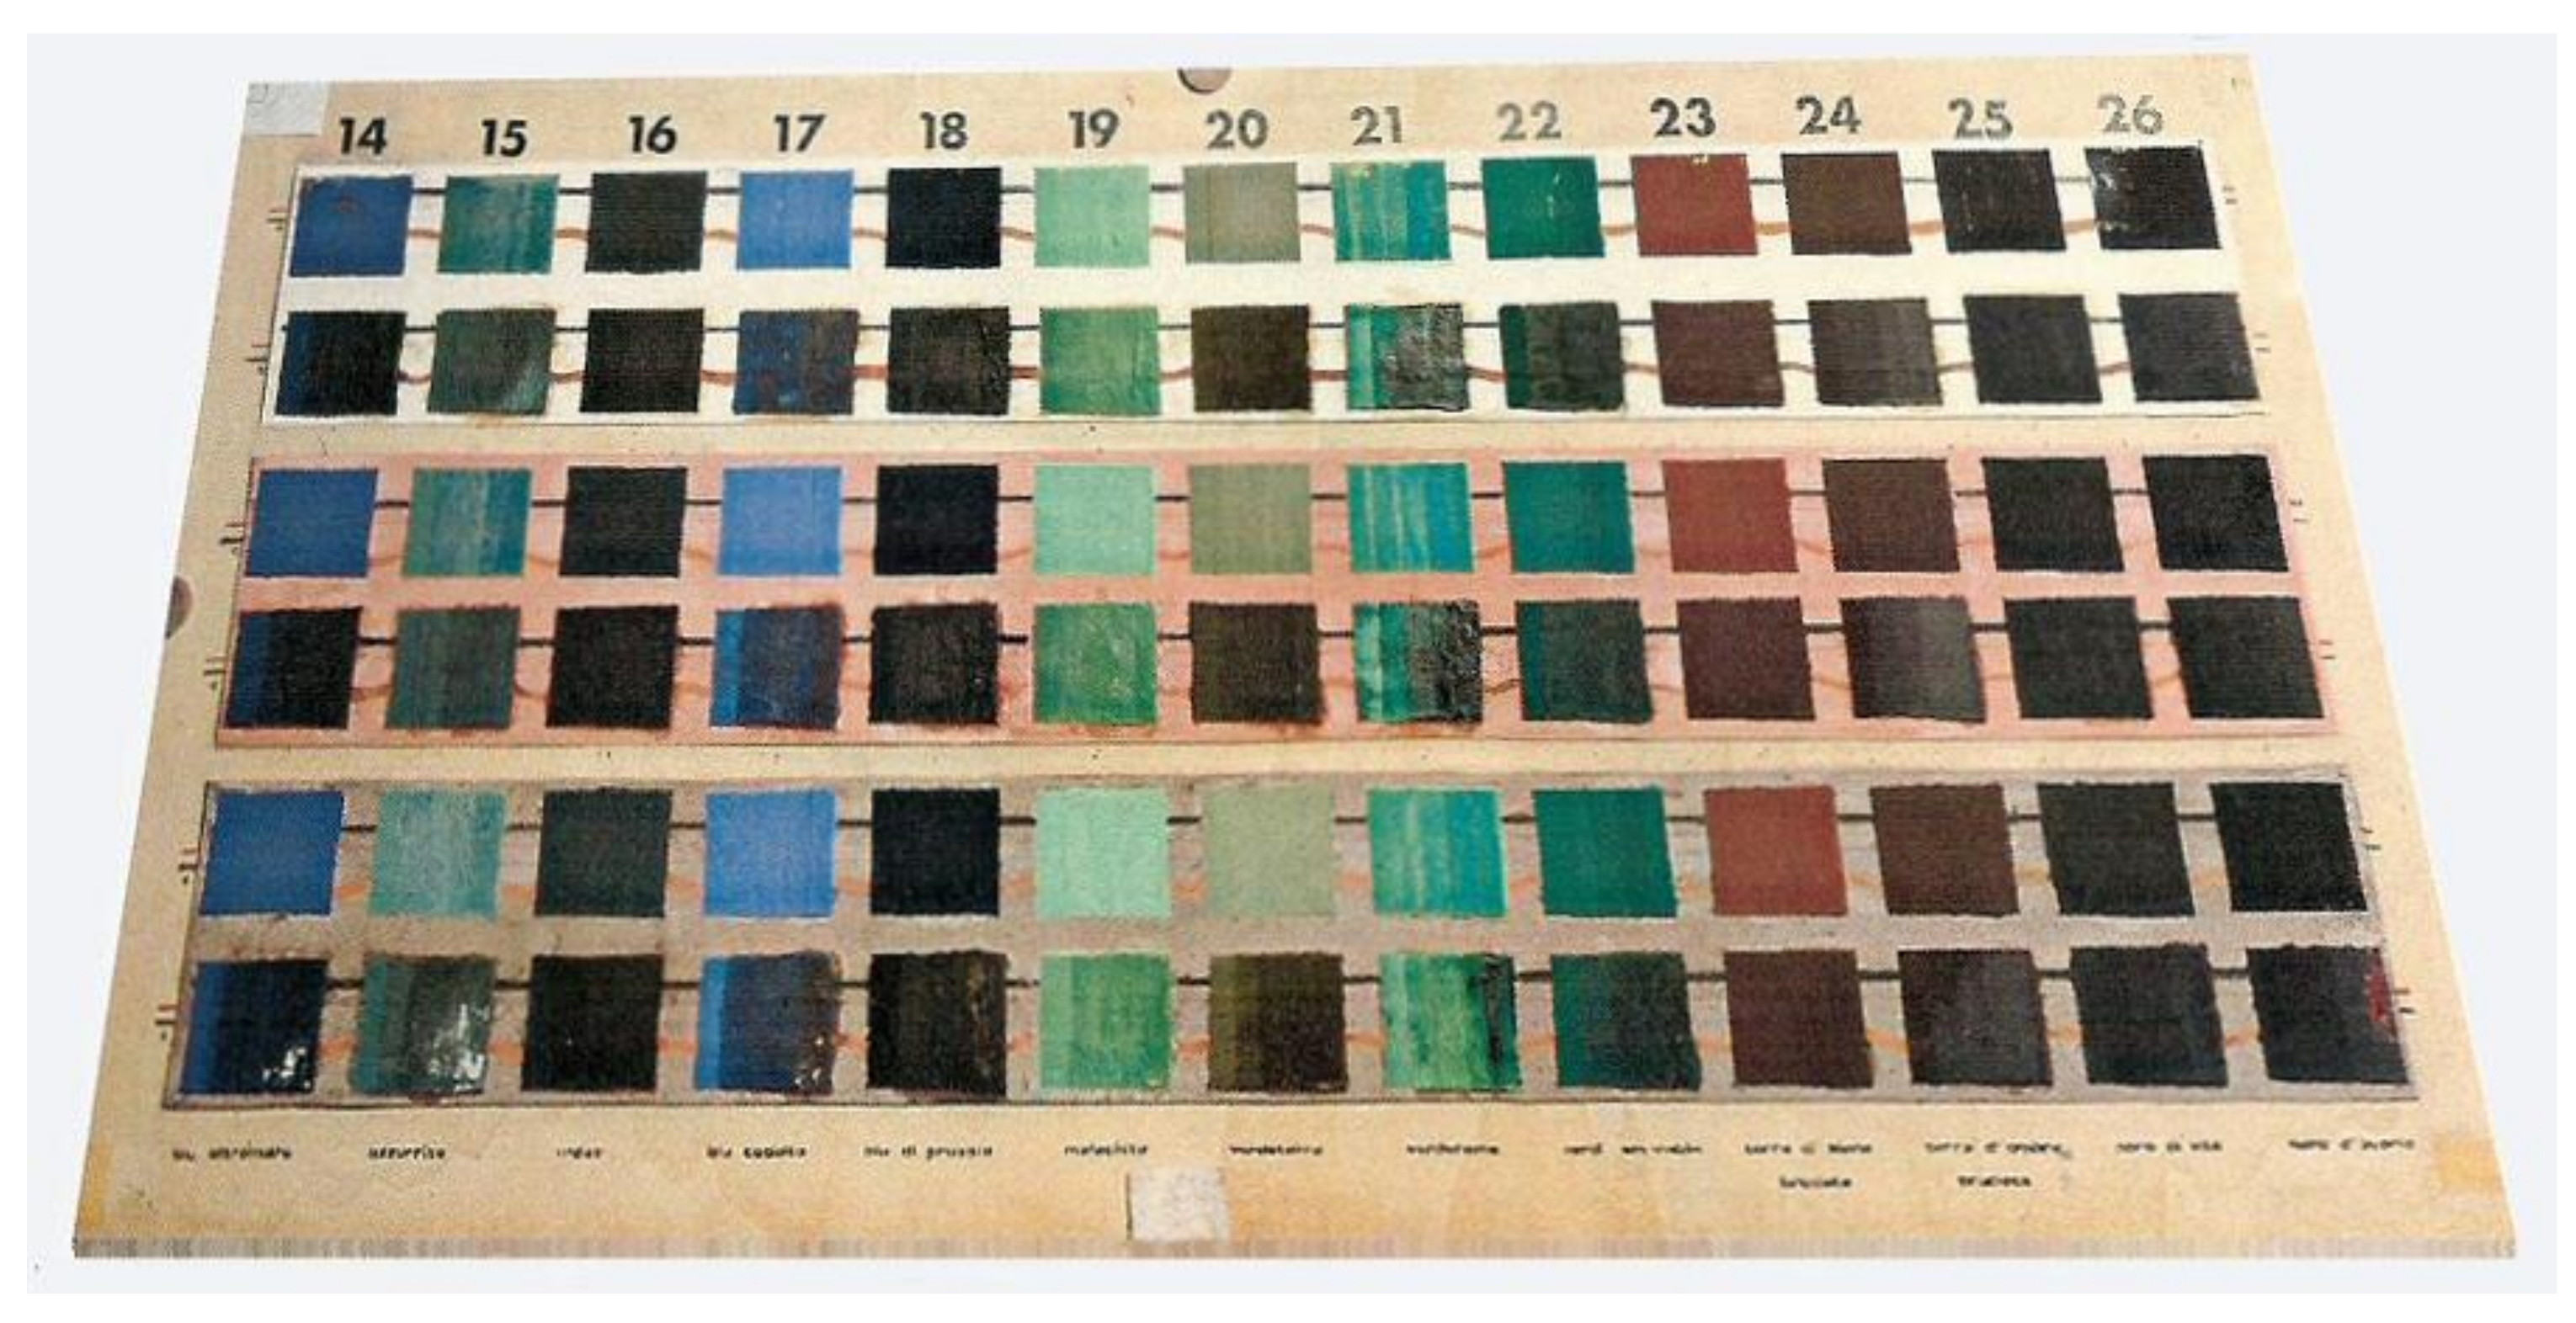
A systematic study on pigments was then performed on a set of test panels produced in 1983 by Editech, in Florence (
Figure 8) [
37,
38]. These panels included 780 painted areas with materials selected from those most commonly used both in the past and at present day. The study involved 26 different pigments, five different thicknesses, three different substrates, and two different binding media.
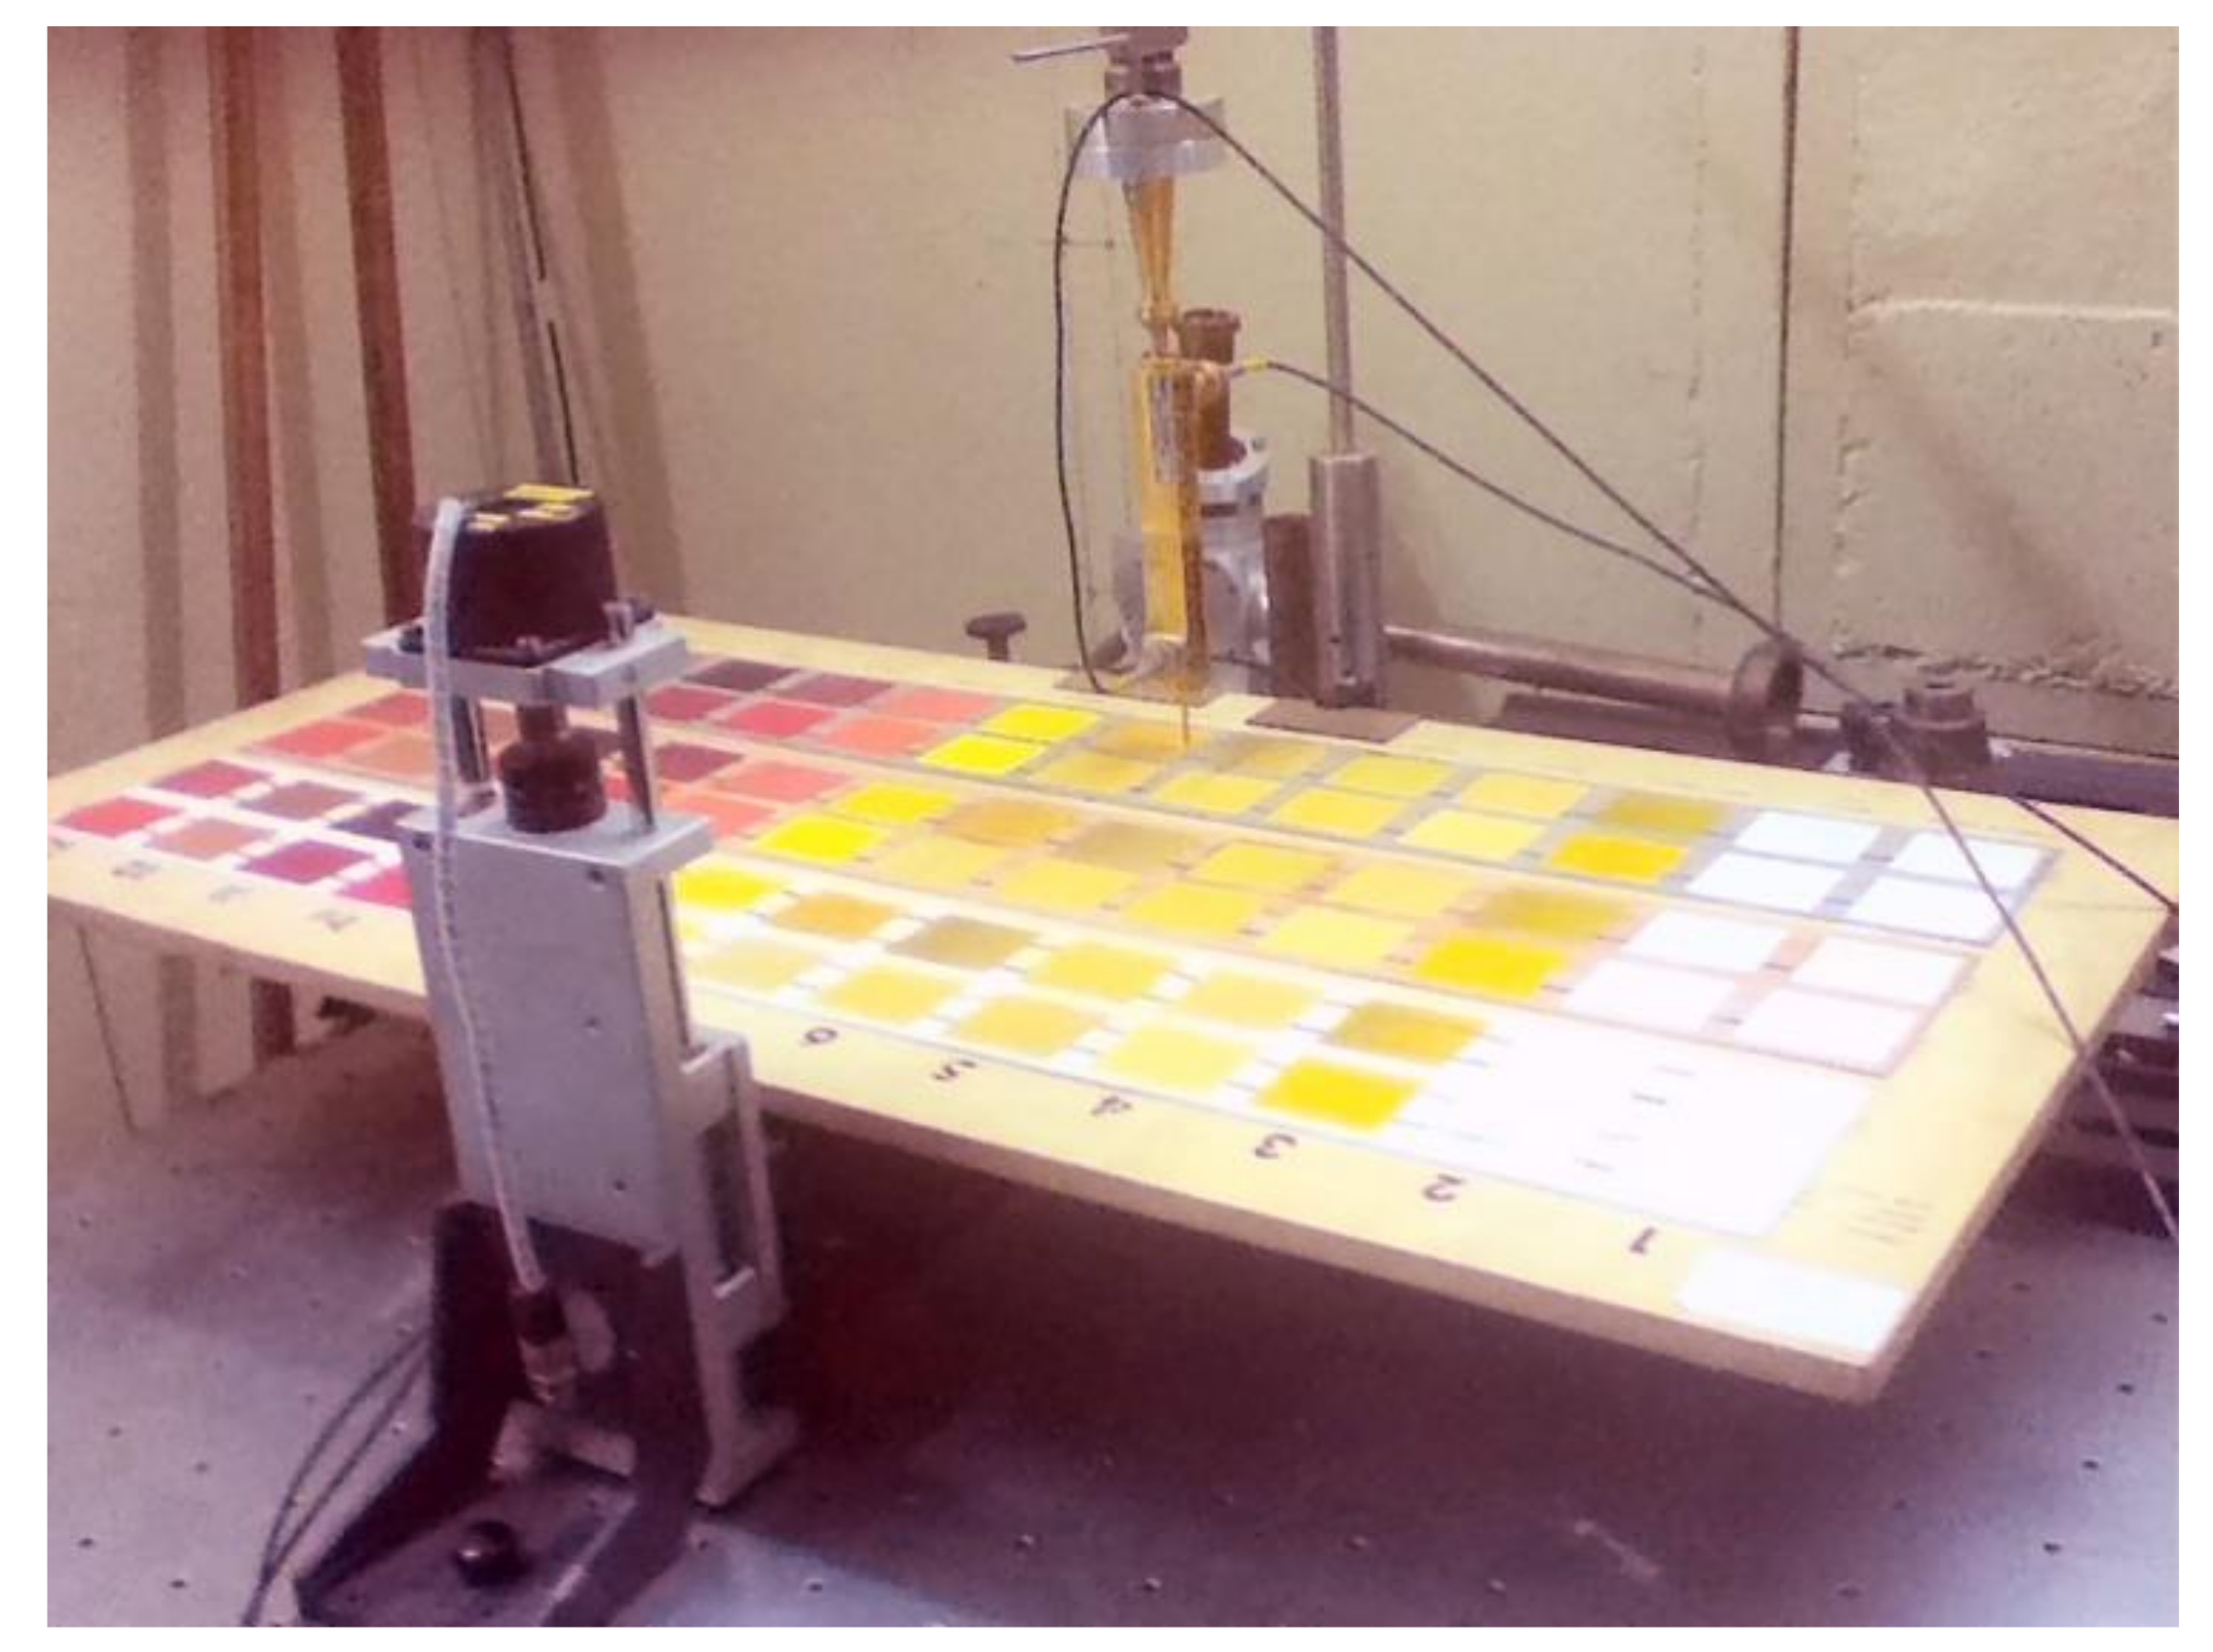
To measure these mock-ups, the hardware and software of the imaging system had to be modified as shown in
Figure 9. Software modifications have been carried out too, in order to avoid the transmission of vibrations that could induce mechanical resonances to the wooden panels while performing the measurements.
During the painting mock-up scan, information on the optical properties of several artists’ materials such as pigments may be obtained by changing the distance between the waveguide probe and the surface of the object at the operating frequency of the THz system (0.13 THz). The results on a few selected painted areas of the Editech mock-ups and of other samples are reported in
Table 1.
Metallic pigments such as lead white and giallorino (both of which contain lead [
39]) presented similar behaviors and showed a higher reflectivity if compared with pigments that do not contain metals or light metals, such as rose lake and carmine. Carmine contains a small amount of aluminum and shows a reflectivity that is slightly higher than rose lake. In addition to the level of reflectivity, a phase shift was also observed among these materials, which can be used to discriminate pigments while performing imaging.
Measurements on binders were also performed indirectly since it was possible to compare the results of the scans of the areas painted with the same pigments but with different binders. According to the results, it seemed that the effect of the binders strongly depended on the pigment under study. For example, the recorded phase of vermilion did not show any difference when this pigment was prepared with oil or egg tempera. On the other hand, lead white showed a considerable difference in amplitude between its egg tempera and oil paints. In some of the pigments, different binders mainly produced a phase shift in the measurement, thus indicating a change in the absorption coefficient.
Despite the fact that this method makes it possible to distinguish different pigments, there are better and easier traditional techniques for performing the same task. Moreover, the spectral response of pigments is almost flat in this particular spectral region. There are no photon transitions occurring, and artists’ materials fingerprints are found at higher frequencies, i.e., above 1 THz. However, since the penetration depth in dielectric material is proportional to the wavelength, this technique could be used to monitor the internal structure of a sample, since each refraction index variation inside the specimen produces a variation in the reflected signal. This phenomenon could be useful for checking wall paintings and/or defects in frescos, such as detached areas, or for providing the internal structure of an object/sample.
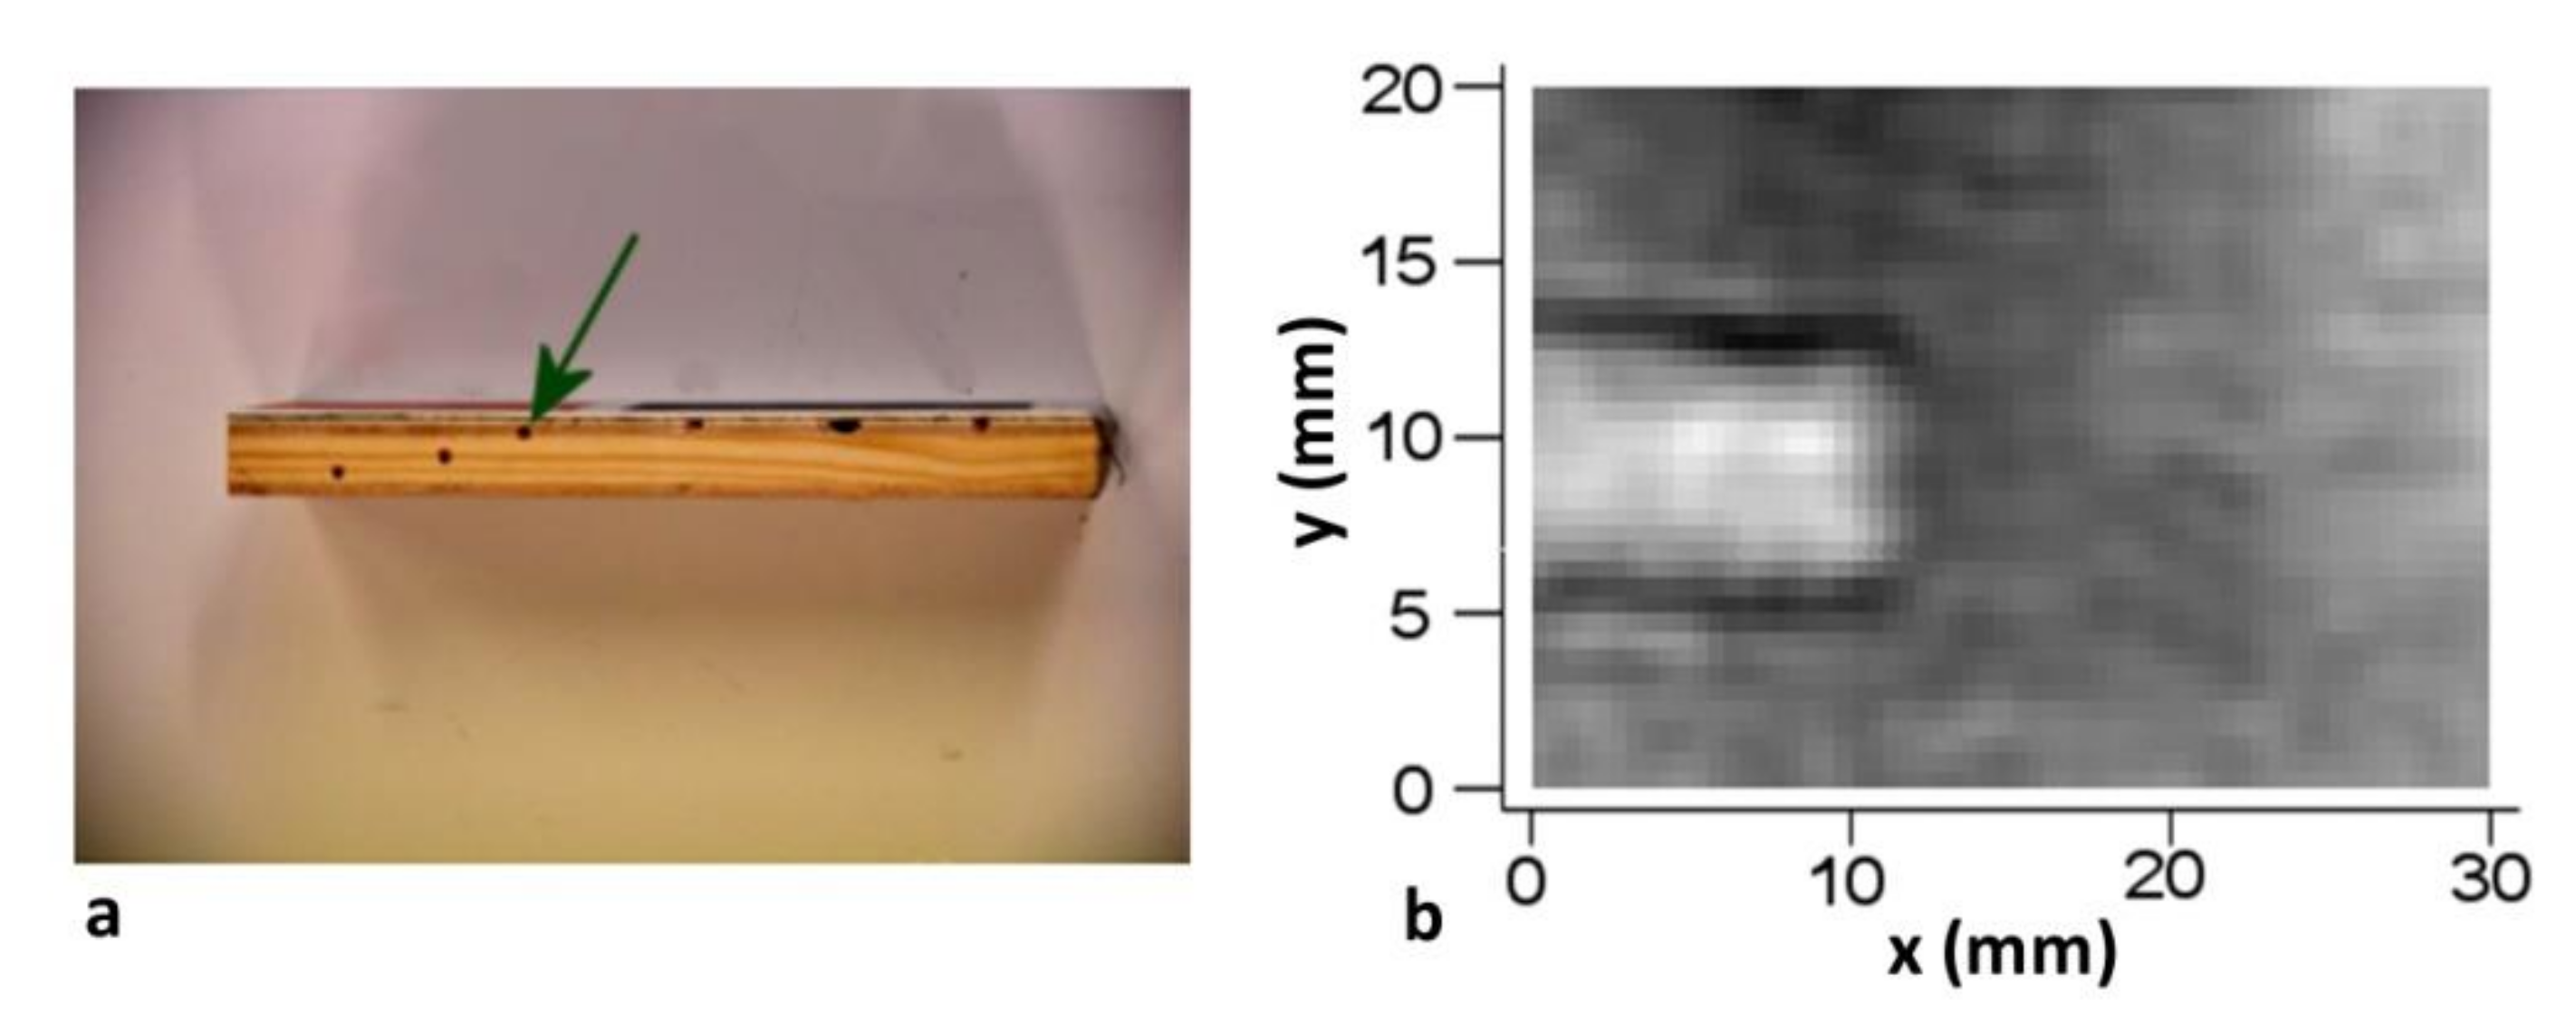
Furthermore, ancient wood fragments were investigated in order to determine the potentialities of this technique in detecting the presence of holes and galleries made by wood-eating beetle larvae in the wooden support of panel paintings or furniture (
Figure 10) [
40]. Changing the distance of the scan has the effect of optimizing the response for a different internal layer. Similar measurements were performed on panel painting mock-ups, which confirmed the ability of FEL to detect holes hidden under the surface of a wooden structure (
Figure 11).
6. The Realization of a Portable Imaging Device
A new research project (THz-ARTE) based off a previous scientific collaboration [
36] was funded in 2013 by the Italian Ministry of Foreign Affairs and International Cooperation (MAECI), within the framework of an Italy–Japan bilateral agreement. The project’s main objective was to test the potentiality of the newly developed THz technique and to produce a prototype of a THz 3D scanner, one that is specifically devoted to investigating mural paintings, to be used in situ. Such a device would make it possible to detect “objects” (defects, picture layers, water damages, substrate structure, any changes in the refraction index, etc.) under the surface of the sample, thus avoiding all the problems related to the use of X-rays radiation: due to the low photon energy, THz radiation is non-ionizing. Therefore, it is not necessary to comply with all the safety requirements related to the use of X-rays devices, ones that complicate the logistics of “in situ” measurements. ENEA, IFAC-CNR and NICT were the main partners of this new project [
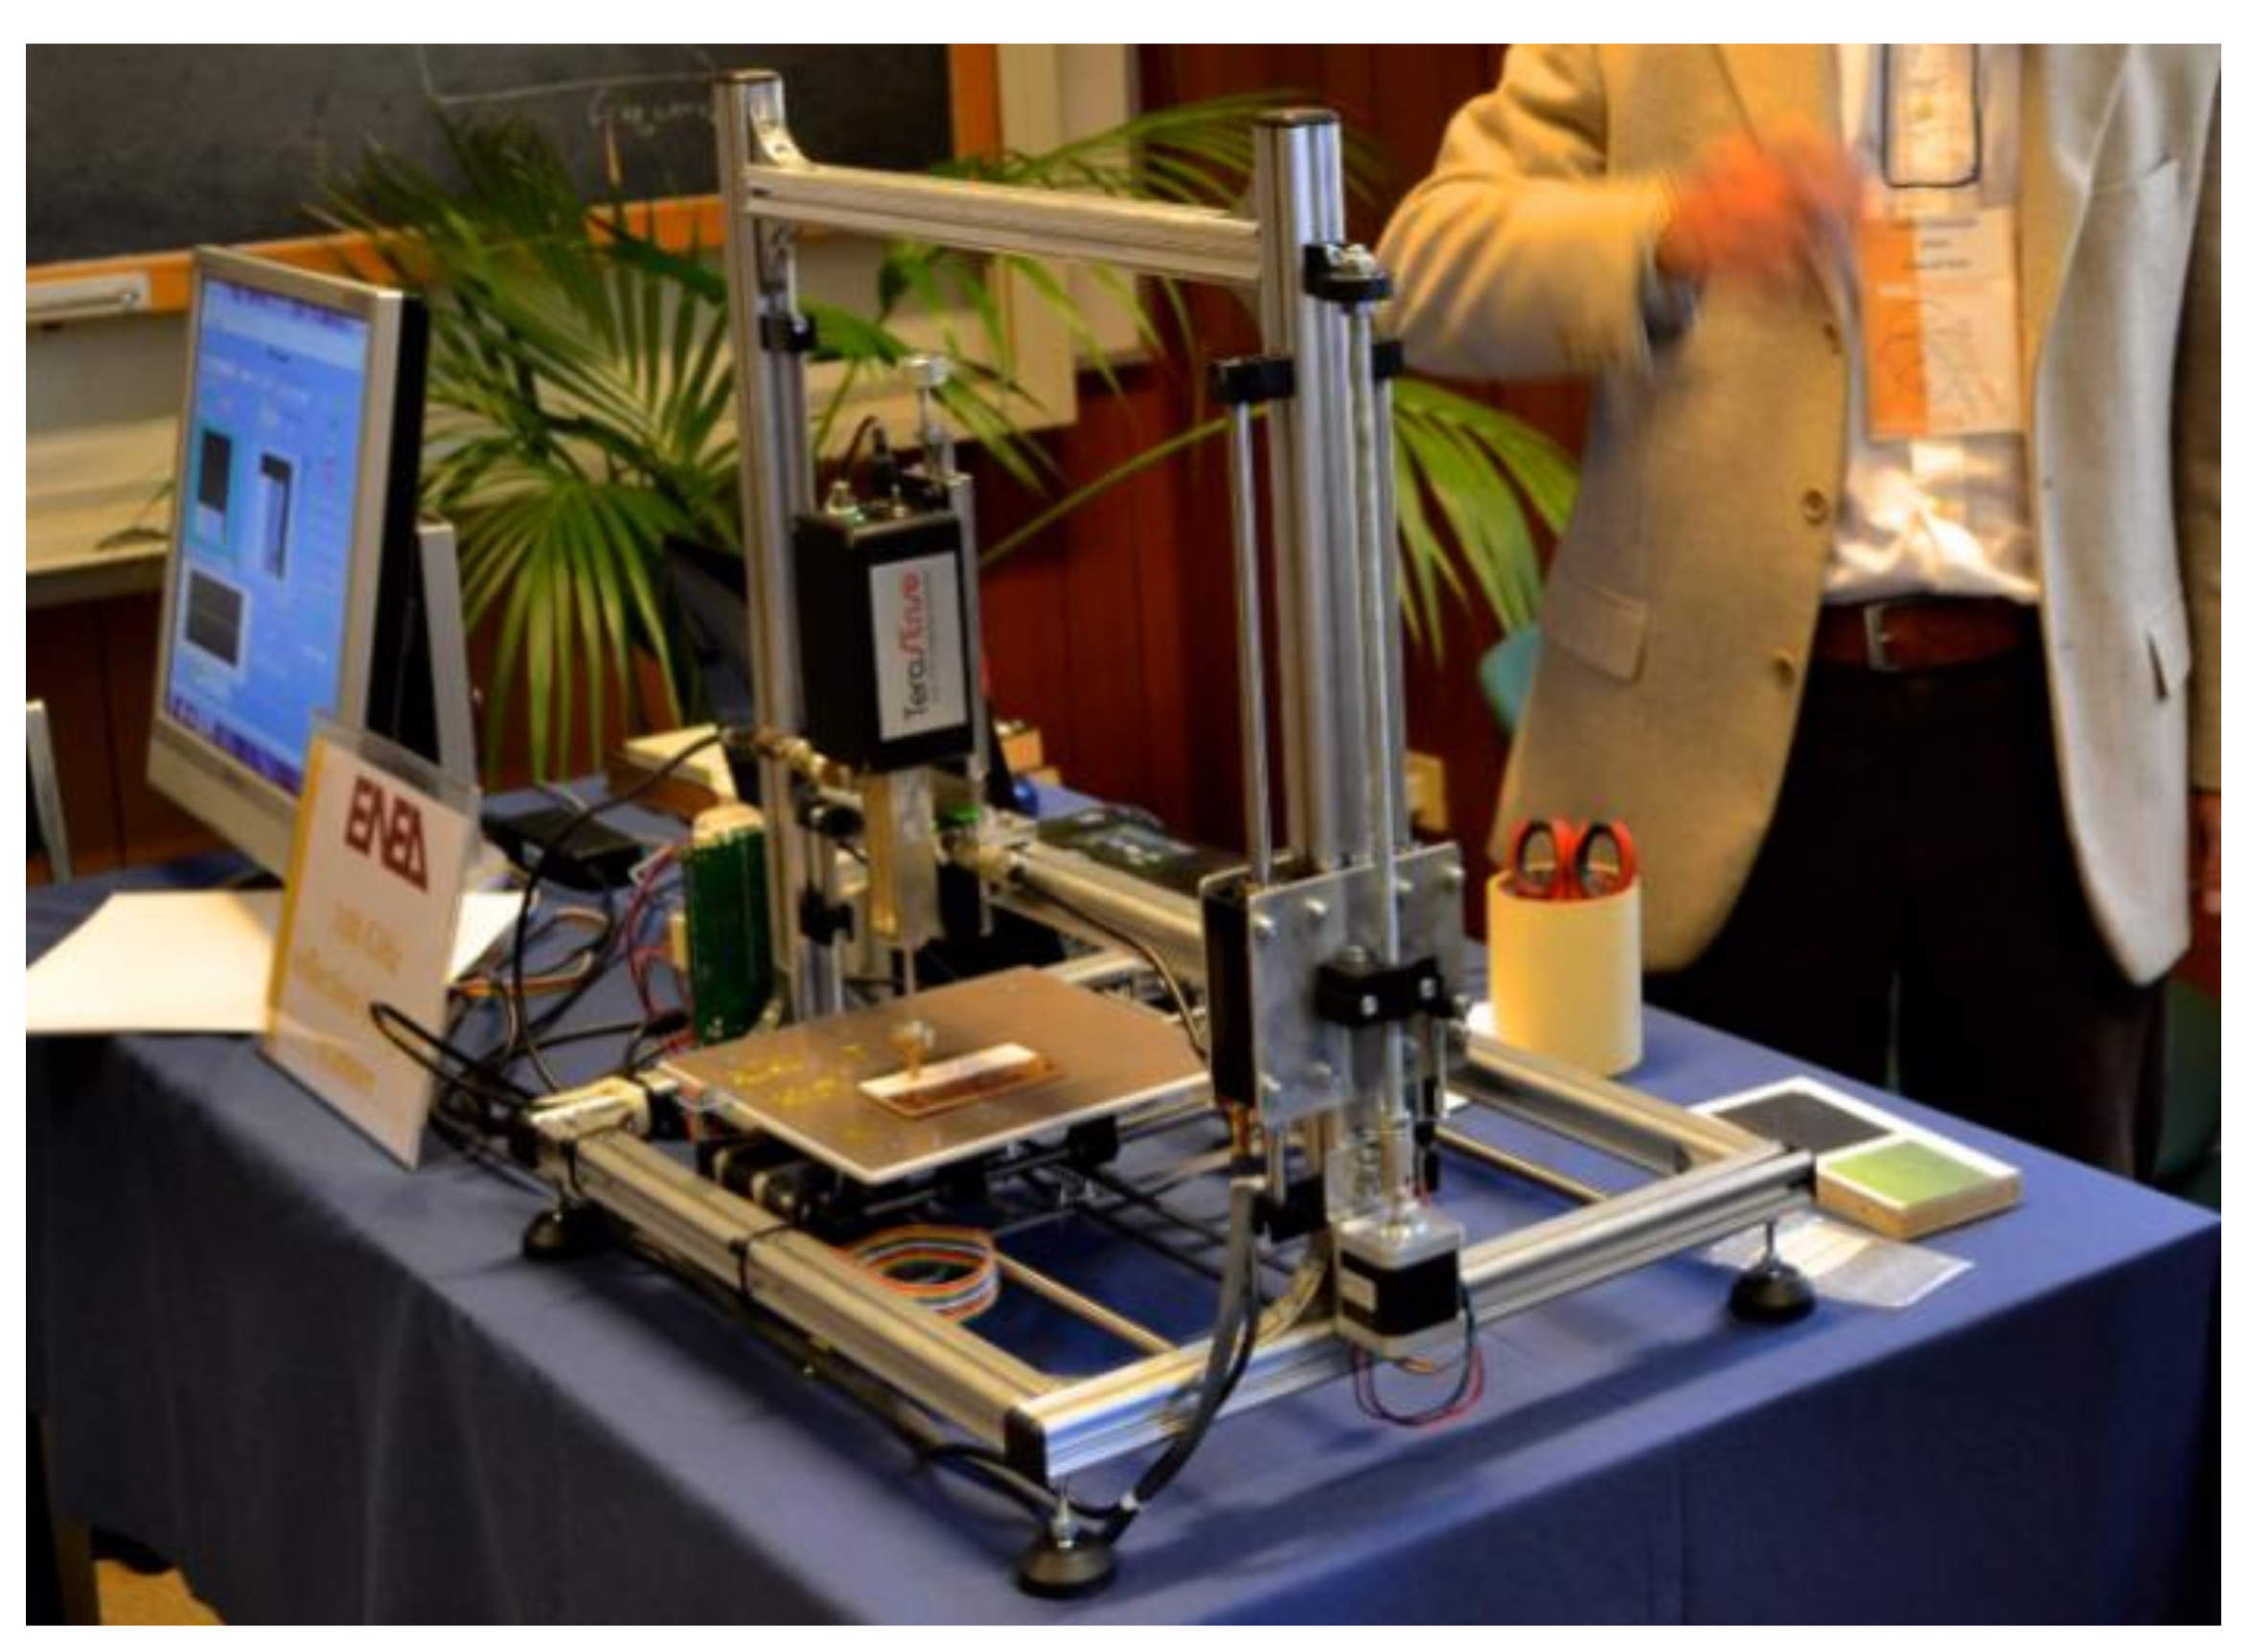
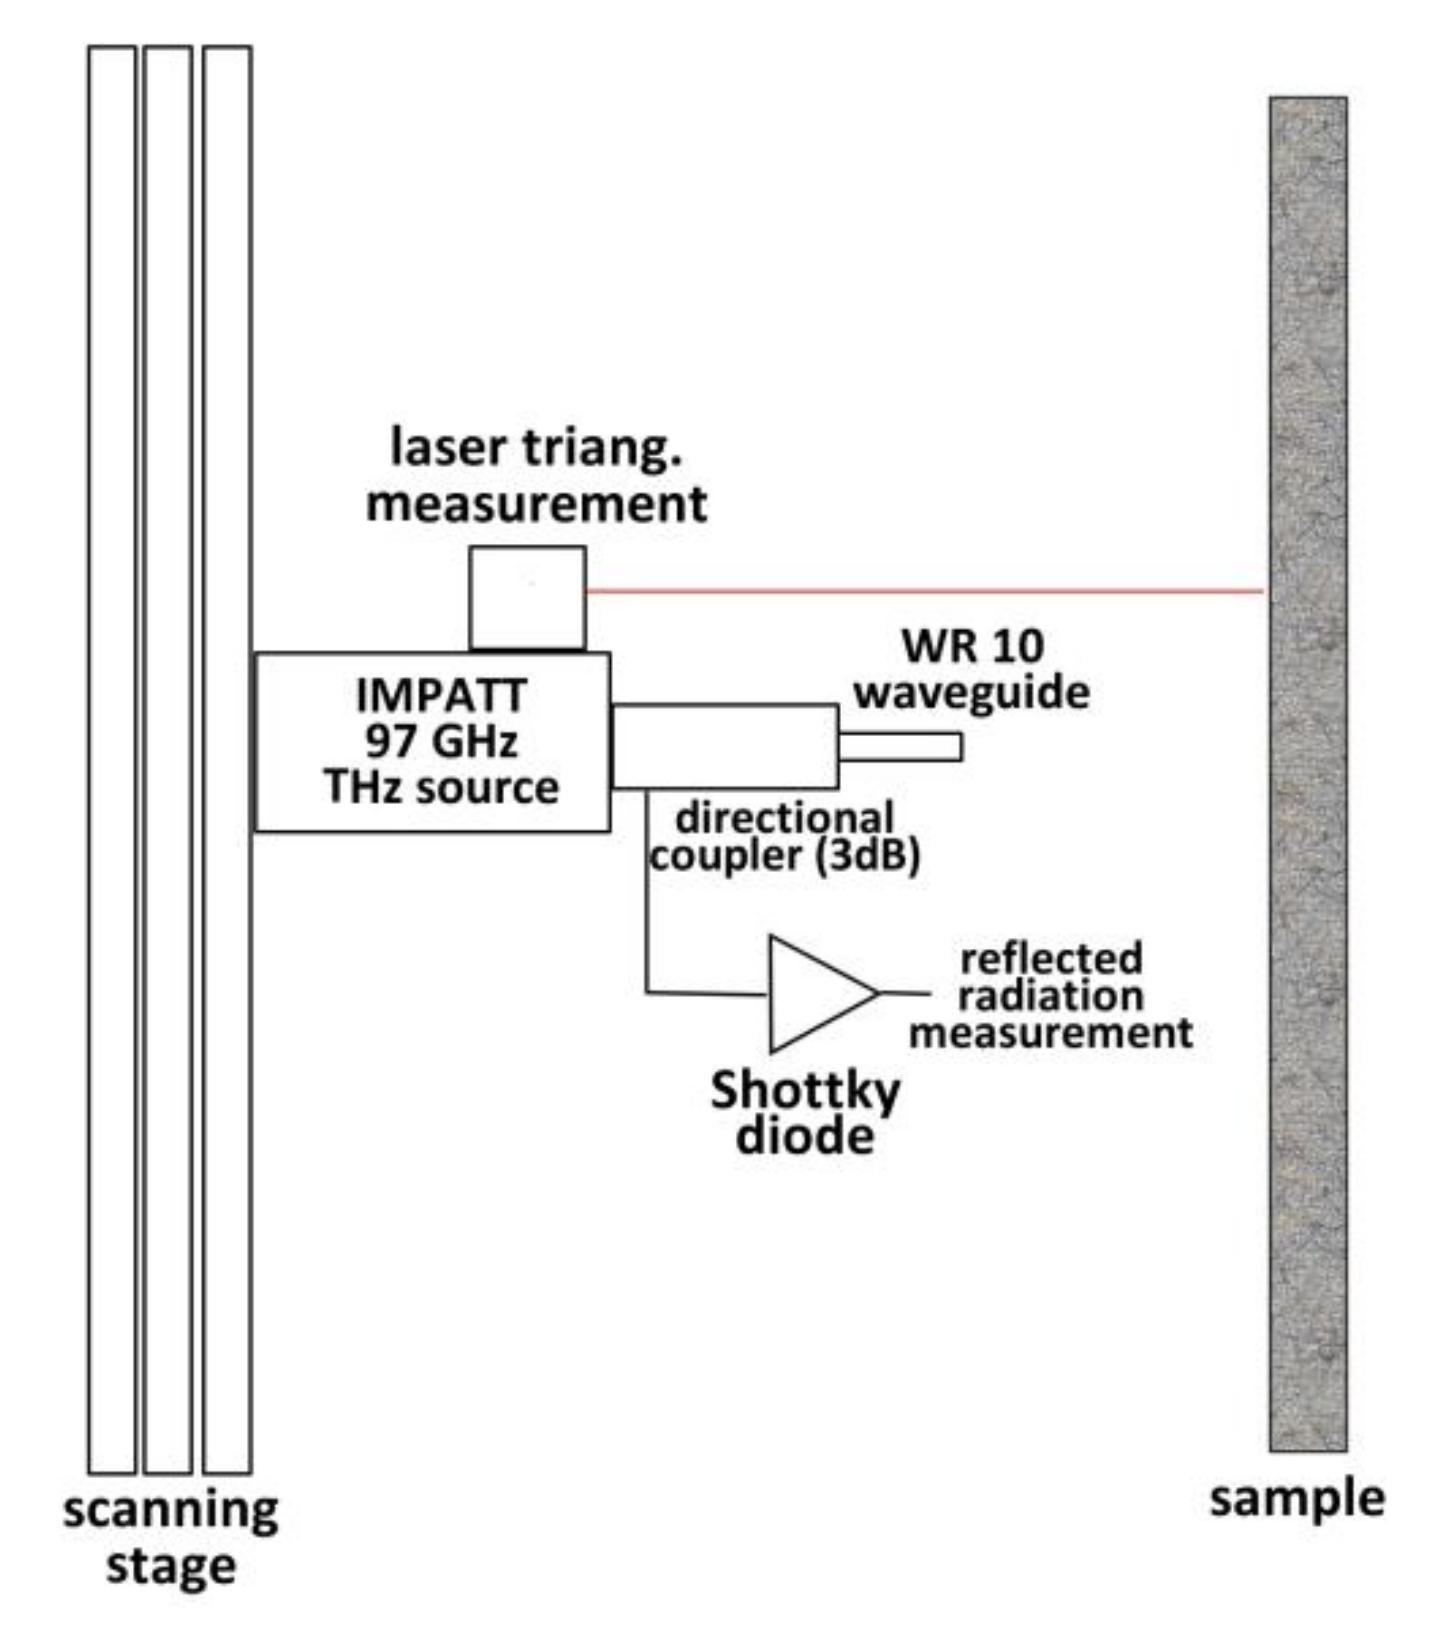
41]. The first task of the project was to identify a suitable source, since the FEL can obviously not be used for “in situ” measurements. A 70 mW IMPATT diode was selected as a source at 97 GHz and a Shottky diode with 200 V/W responsivity was chosen as a detector. Performances of the system were tested by means of a low-cost scanner prototype that was based upon the mechanical structure of a 3D printer (
Figure 12).
The results of the measurements carried out with the new scanner were comparable to those previously obtained with the FEL (
Figure 13) presented in the previous section.
Once the first results, which demonstrated the performances of the device, were obtained, a new prototype was constructed [
42]. This new prototype demonstrated better performances in terms of speed, precision of the motor stages, and the dimensions of the scanning area. The three high-speed motorized linear stages, assembled in a X-Y-Z configuration, enabled measurements on vertical (XY) surfaces covering an area up to 500 × 300 mm
2. The Z-stage has a travel range of 100 mm. The IMPATT diode oscillator described above was fitted to the Z stage of the scanner together with a probe head, thus making it possible to change the distance between the probe head and the sample surface. All three mechanical stages had a position accuracy of better than 1 μm. A custom control software was designed in order to maximize the signal acquisition and the scanning speed. The scanning time of the entire 500 × 300 mm
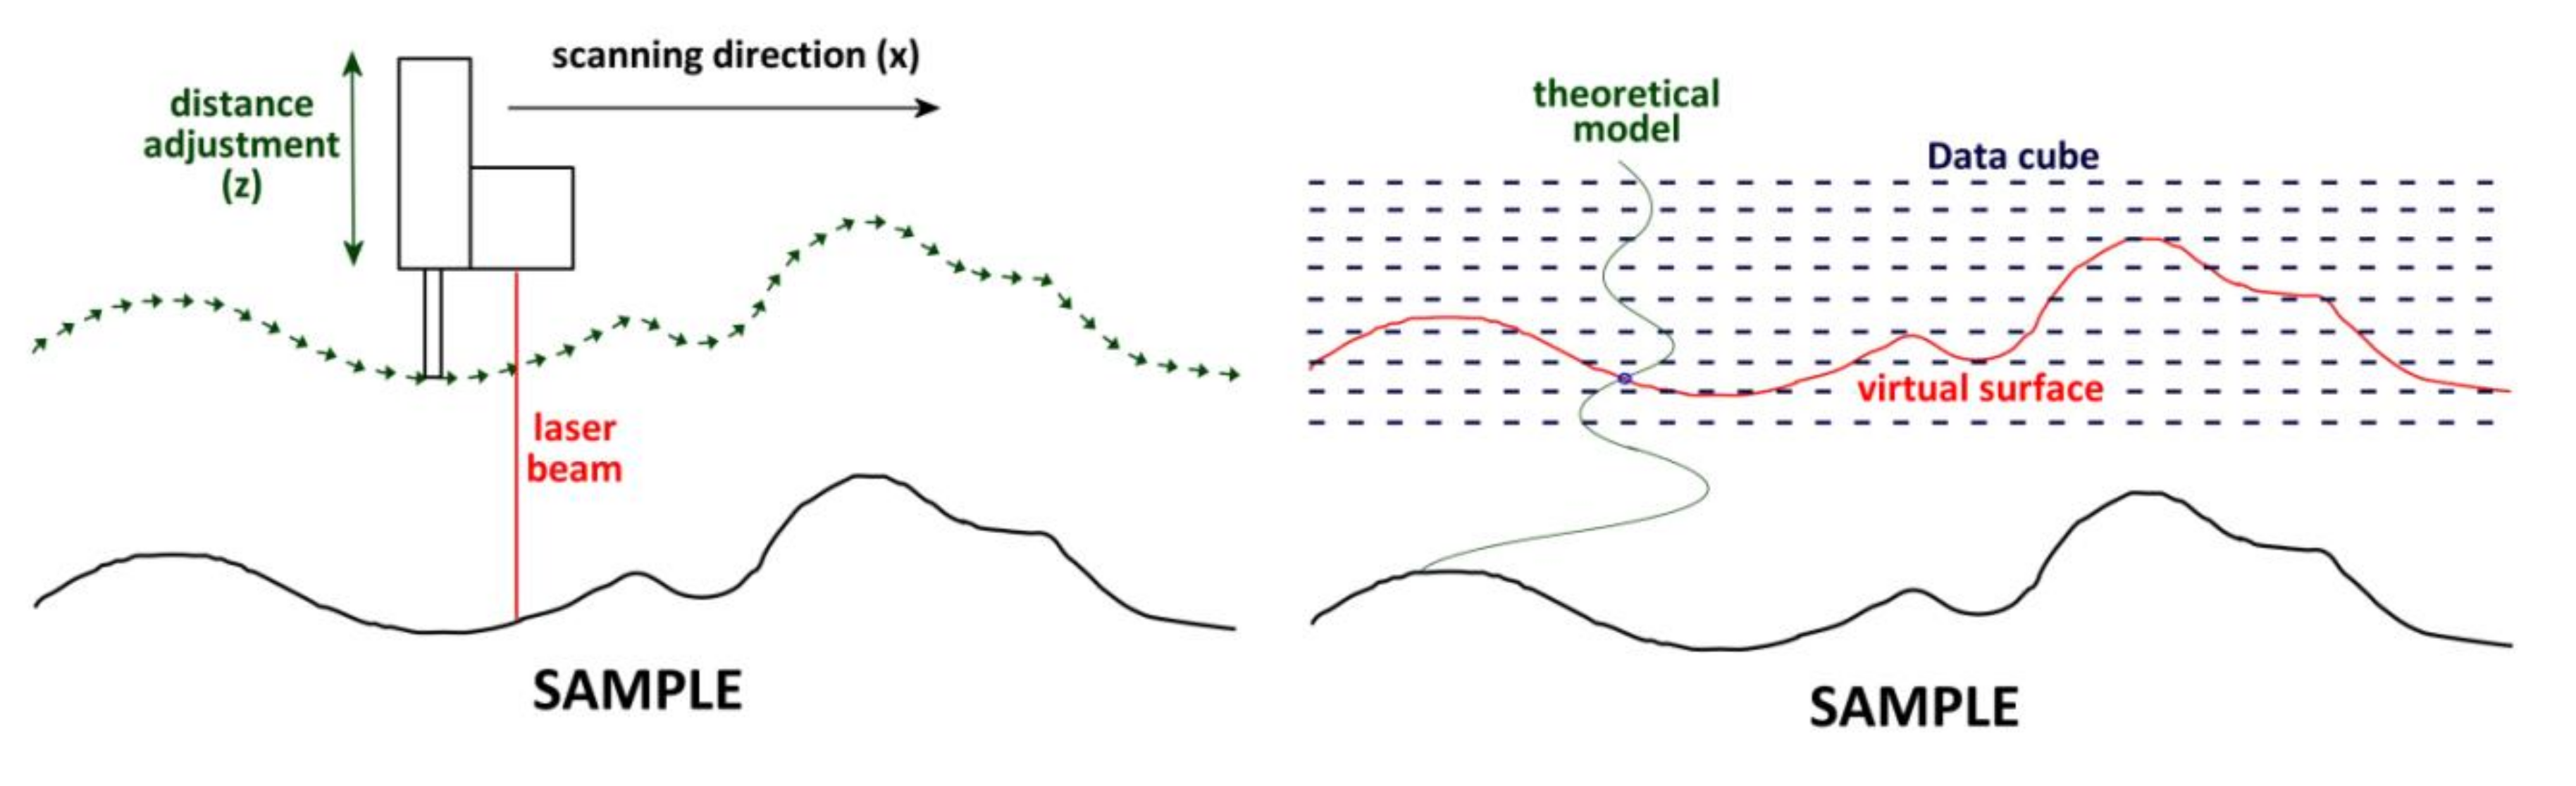
2 area with 1-mm resolution was about 40 min. THz radiation was transported toward the sample using a WR10 open-ended waveguide and launched in free space. The radiation reflected from the sample was partially injected back into the same waveguide and was measured by means of a 3-dB directional coupler and a Shottky diode with a 200 V/W responsivity. A laser triangulation system was added to the probe head in order to measure precisely the shape of the sample surface. In fact, the phase variation that produced the modulation of the reflected signal depended on both the sample distance and the sample optical properties. If the sample is not planar, and that is the usual situation when working on artworks, the morphological information of the object under investigation is combined with the optical one. With the laser triangulation system, it is possible to obtain information regarding the surface distance of each pixel of the image and to correct it by using two different techniques. The first one employs laser data in order to perform a THz scan at a fixed distance from the sample by following the shape of the surface with the probe head in real time (
Figure 14). The second technique makes use of multiple planar THz scans at different nominal distances from the sample but interpolates the data inside the data cube obtained with the theoretical model described above, to obtain virtual scanning surfaces at a constant distance from the sample (
Figure 14).
A schematic layout of the system is reported in
Figure 15.
The 1-mm step size does not correspond exactly to the real lateral resolution of the system: at 97 GHz, the wavelength is about 3 mm, so that the lateral resolution is limited by diffraction to about 1.5 mm. Moreover, despite the fact that the probe head is very close to the sample surface, radiation undergoes diffraction widening when launched toward the sample. Choosing a smaller step for the raster scan results in an integration between data of adjacent pixels, thus producing a slight “smoothening” of the resulting image.
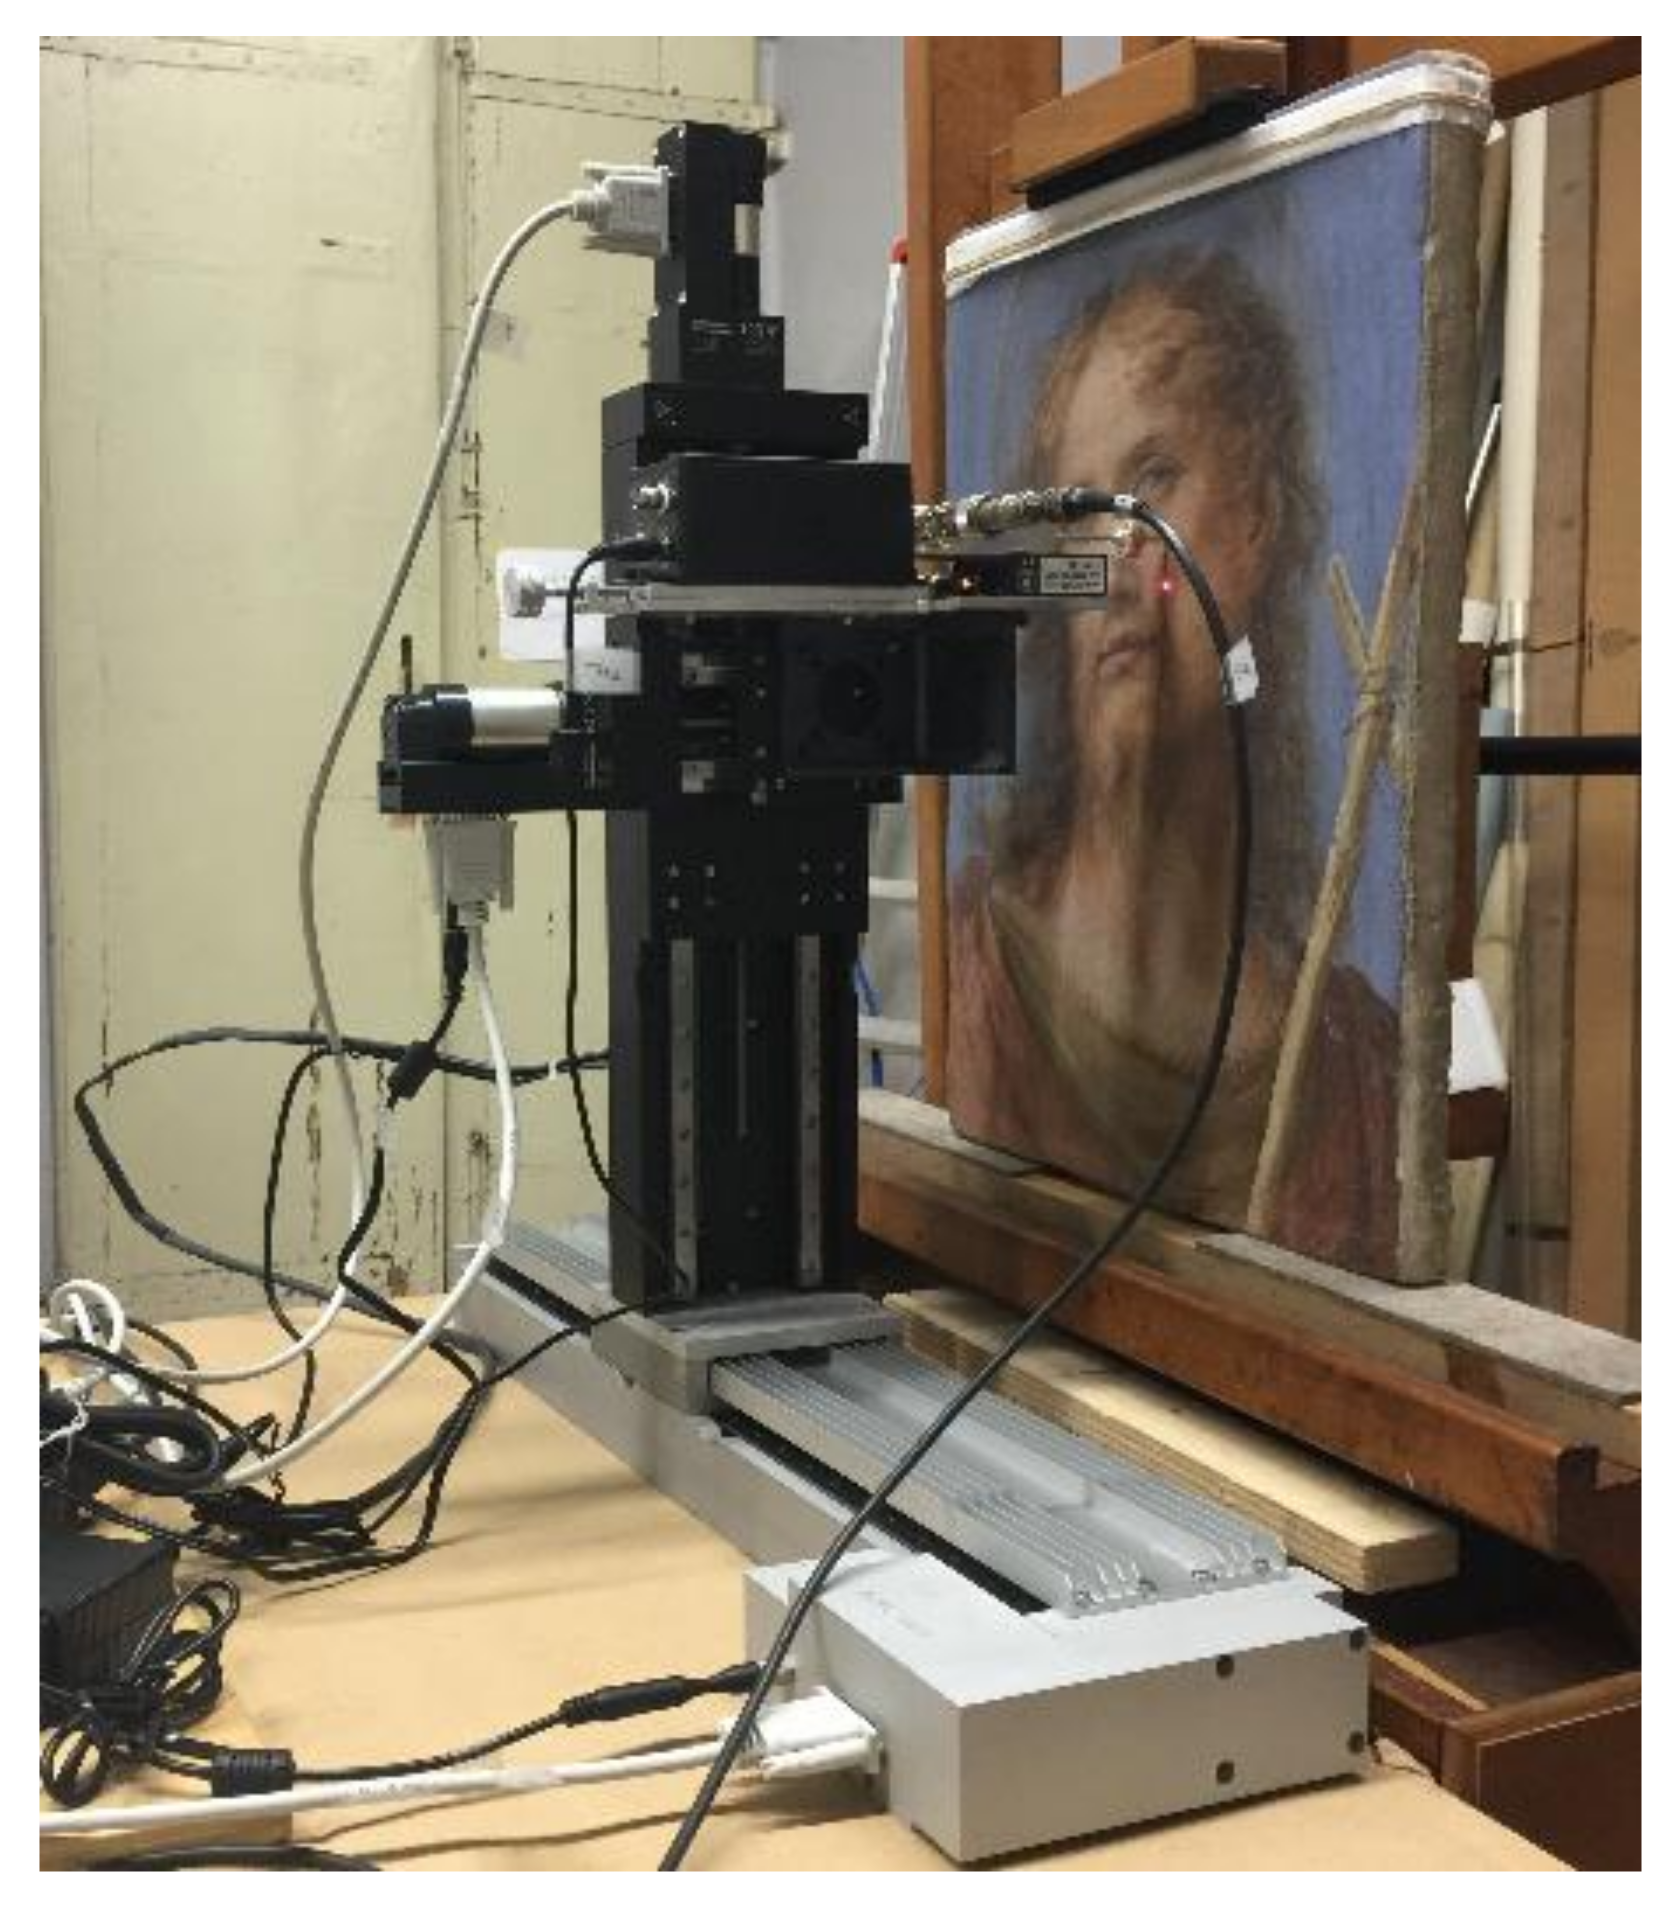
With the use of this new device, a fresco painting on
tavella (51 cm × 37 cm) depicting St. John Baptist by Alessandro Gherardini (1655–1726) was analyzed at the Restoration Laboratories of the former “Polo Museale della Toscana”, in Florence (
Figure 16) [
43]. The fresco of St. John the Baptist’s head belongs to the permanent collection of the Florentine San Marco Museum (inv. 1890 n. 8511) and was painted by Gherardini in 1700–01 for the Giovanato chapel (also known as Girolamo Savonarola chapel) in the Convent of San Marco [
44,
45].
The imaging scanner makes use of the laser triangulation system to align the axes of the scanner with the fresco surface and to determine its surface topology. These data were used in order to set the position of the motors in such a way as to make a collision of the probe head with the fresco, while moving it very close to the fresco surface (about 1-mm distance), mechanically impossible.
For the sake of the same “safety” concerns, instead of following the shape of the fresco surface with the probe head, it was decided to utilize the second technique previously described, which consisted of performing multiple scans at different “nominal” distances from the painting’s surface. Data from these scans were assembled for the purpose of building a data cube. Data regarding the surface shape, measured through the laser triangulation system, were used to interpolate the values in the data cube, using the simple diffraction-based theoretical model described above, in order to obtain a series of “virtual surfaces” that lie “parallel” to the real sample surface (
Figure 14). Such virtual surfaces are not affected by the phase error due to the non-planar artwork surface, and since these surfaces are the result of an interpolation with a theoretical model, it is possible to obtain reflectivity data also for surfaces that lie very close to the artwork surface, where experimental data are not available.
By using this technique, measurements were performed in different areas of the artwork. The analysis of the data revealed clear patterns that did not correspond to any visible feature of the painting. THz image patterns are most likely to be related to structures that are below the outermost paint layers, thus producing a phase variation that is much greater than the one induced by the pigment difference on the artwork surface. The non-planarity of the fresco surface was mathematically corrected, but the tavella used as a support for the painting could not be considered perfectly planar, and hence might have produced artifacts that could not be corrected as was done for the artwork surface. The same applies to the internal anomalies of the fresco painting.
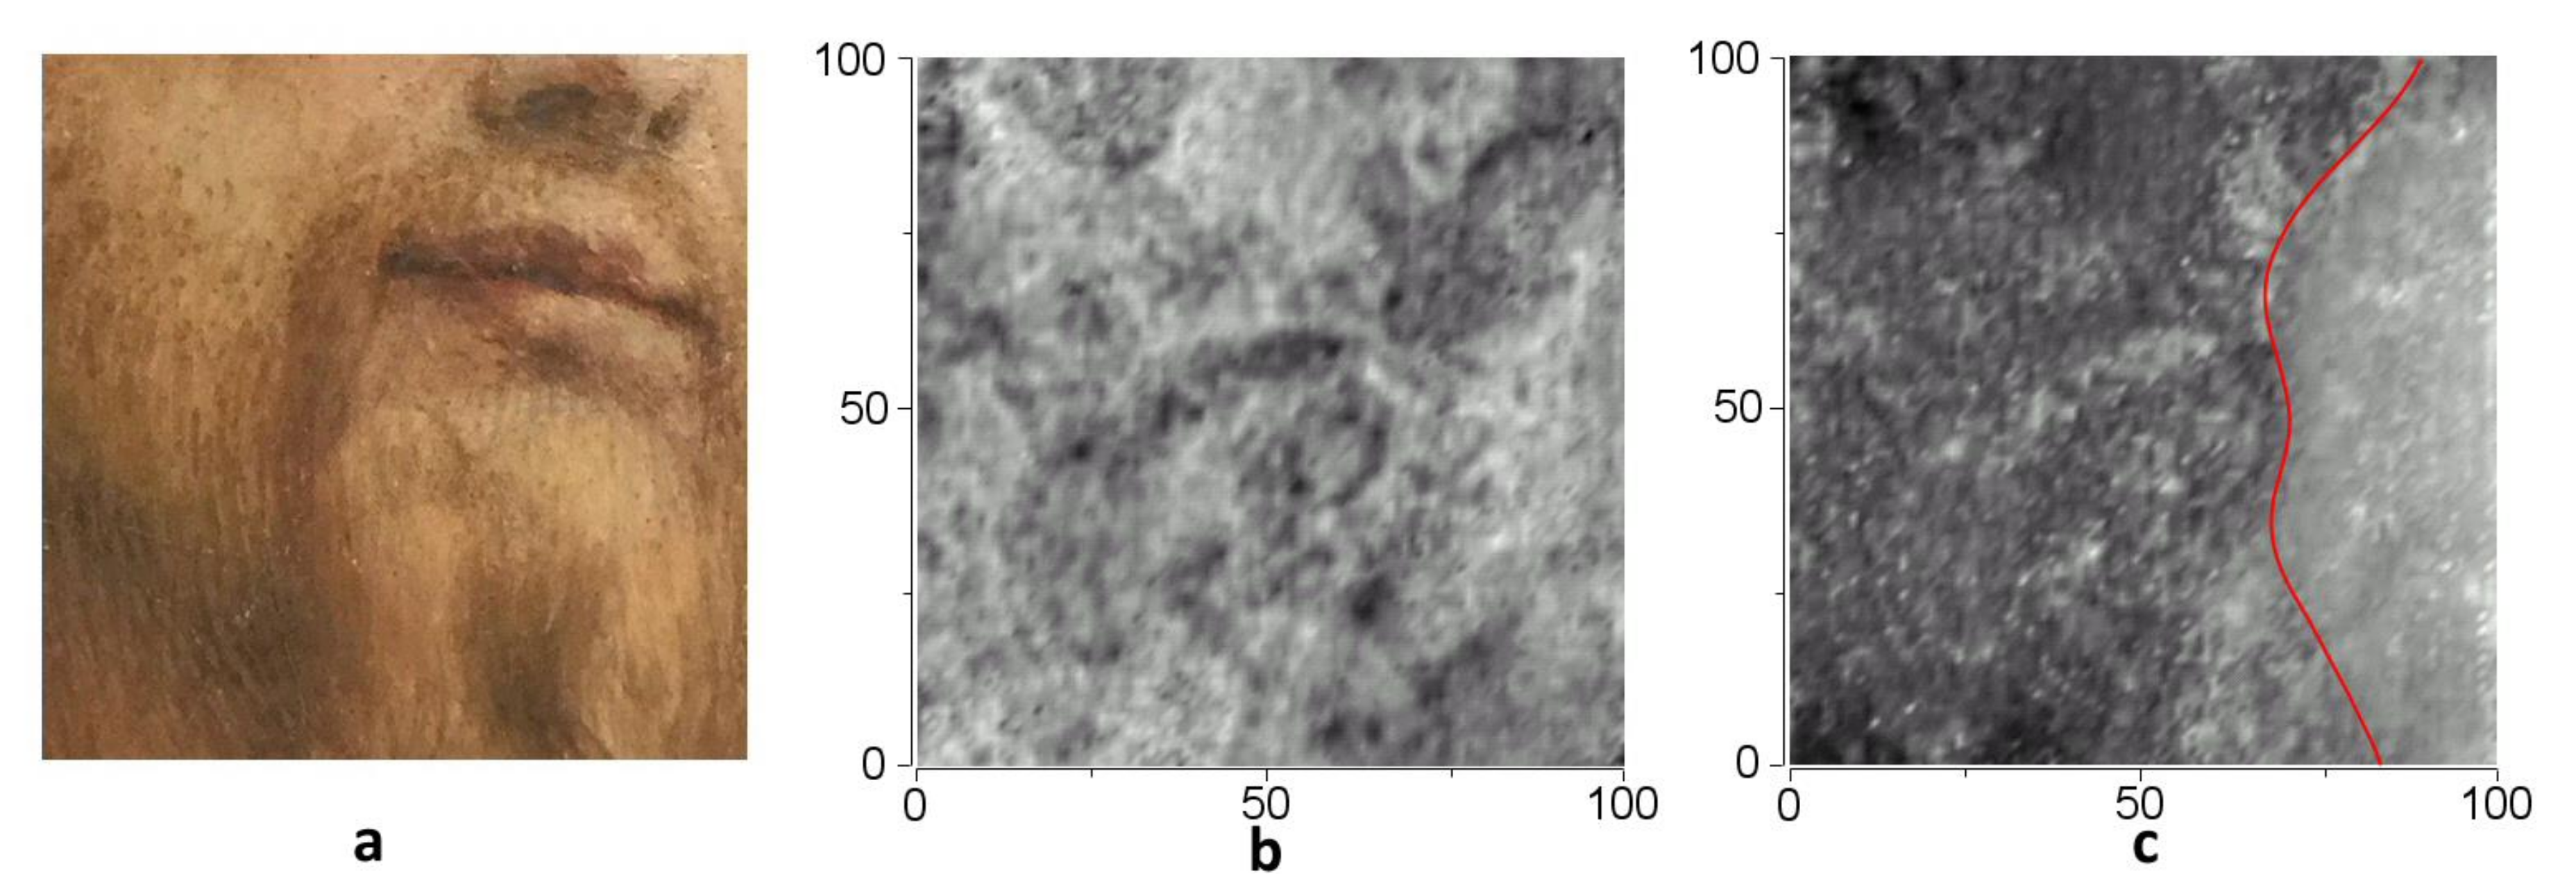
By extracting from the data cube a certain number of virtual surfaces, at different distances from the fresco surface, and assembling these images in a sequence of frames, it was possible to verify that, when changing the distance of observation, the phase variation was high in certain zones and low in others (
Figure 17). In
Figure 17, THz images extracted at two different distances (d = 0.5 mm and d = 0.7 mm) are compared. On the left side of the image reported in
Figure 17c, even a small distance variation (200 μm) causes a big phase change, while this variation is smaller on the right side of the image.
Since the variations in the phase are greater when the reflecting object is closer to the probe, while they are reduced to smaller values when the distance is greater (
Figure 18), it is possible to determine qualitatively the depth of the “features” that are responsible for the changes in the refraction index. This means that the structures visible in the left side of the THz image lie closer to the surface than do the structures in the right side.
7. Measurements on Water
The experience gained from the THz-ARTE project gave rise to a new research line for THz imaging, one that is related to the detection of water in mural paintings as well as mosaic walls and floors. Water should exhibit both a high reflectivity and a high absorption coefficient in the THz spectral range. This feature can be exploited in order to detect water damages in mural paintings and mosaics as well as the presence of moss, lichen, and weeds, containing water, under the artwork surface. In order to test the ability of the proposed system to detect the presence of water, it was decided to carry out a set of laboratory tests. The first tests were made to verify whether it was possible to detect under a ceramic tile, the presence of drops of water that were absorbed by its rear side. In
Figure 19, the results of this preliminary measurement are shown. Measurements were carried out by placing drops of water on the reverse side of a ceramic tile and by performing imaging from the opposite side (the “trampling side”). Both drops were clearly visible in the THz, and their tracks were superimposed on the morphological features of the tile.
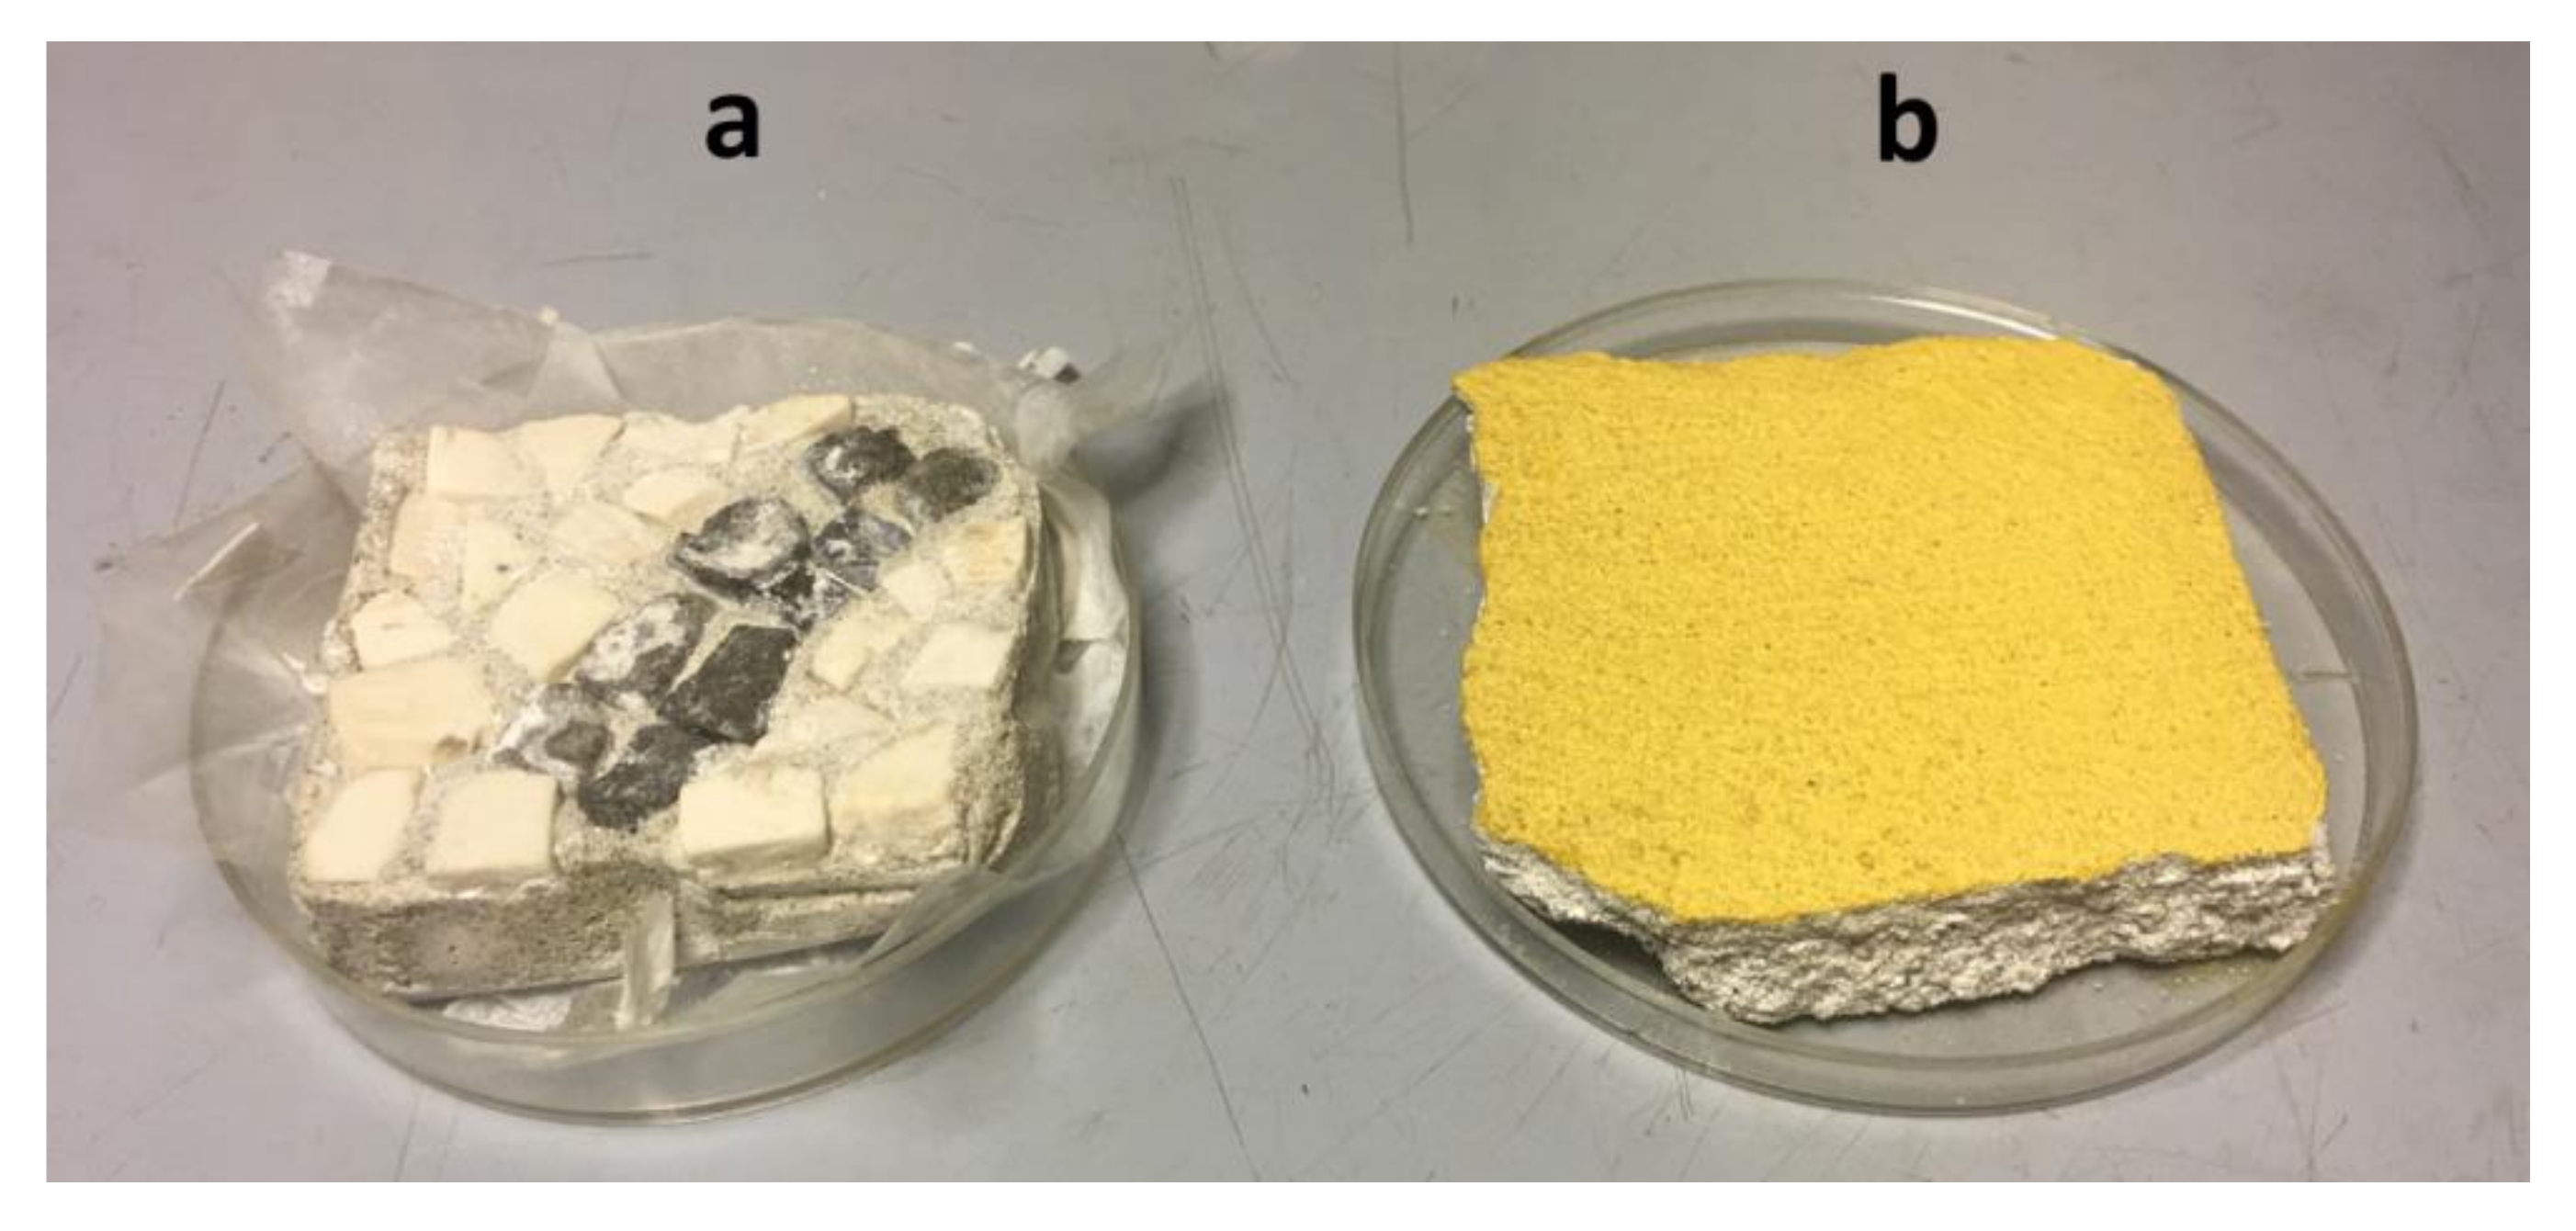
More measurements were performed on mock-ups of fresco paintings and stone tesserae mosaic, which were prepared by following the traditional recipes (
Figure 20).
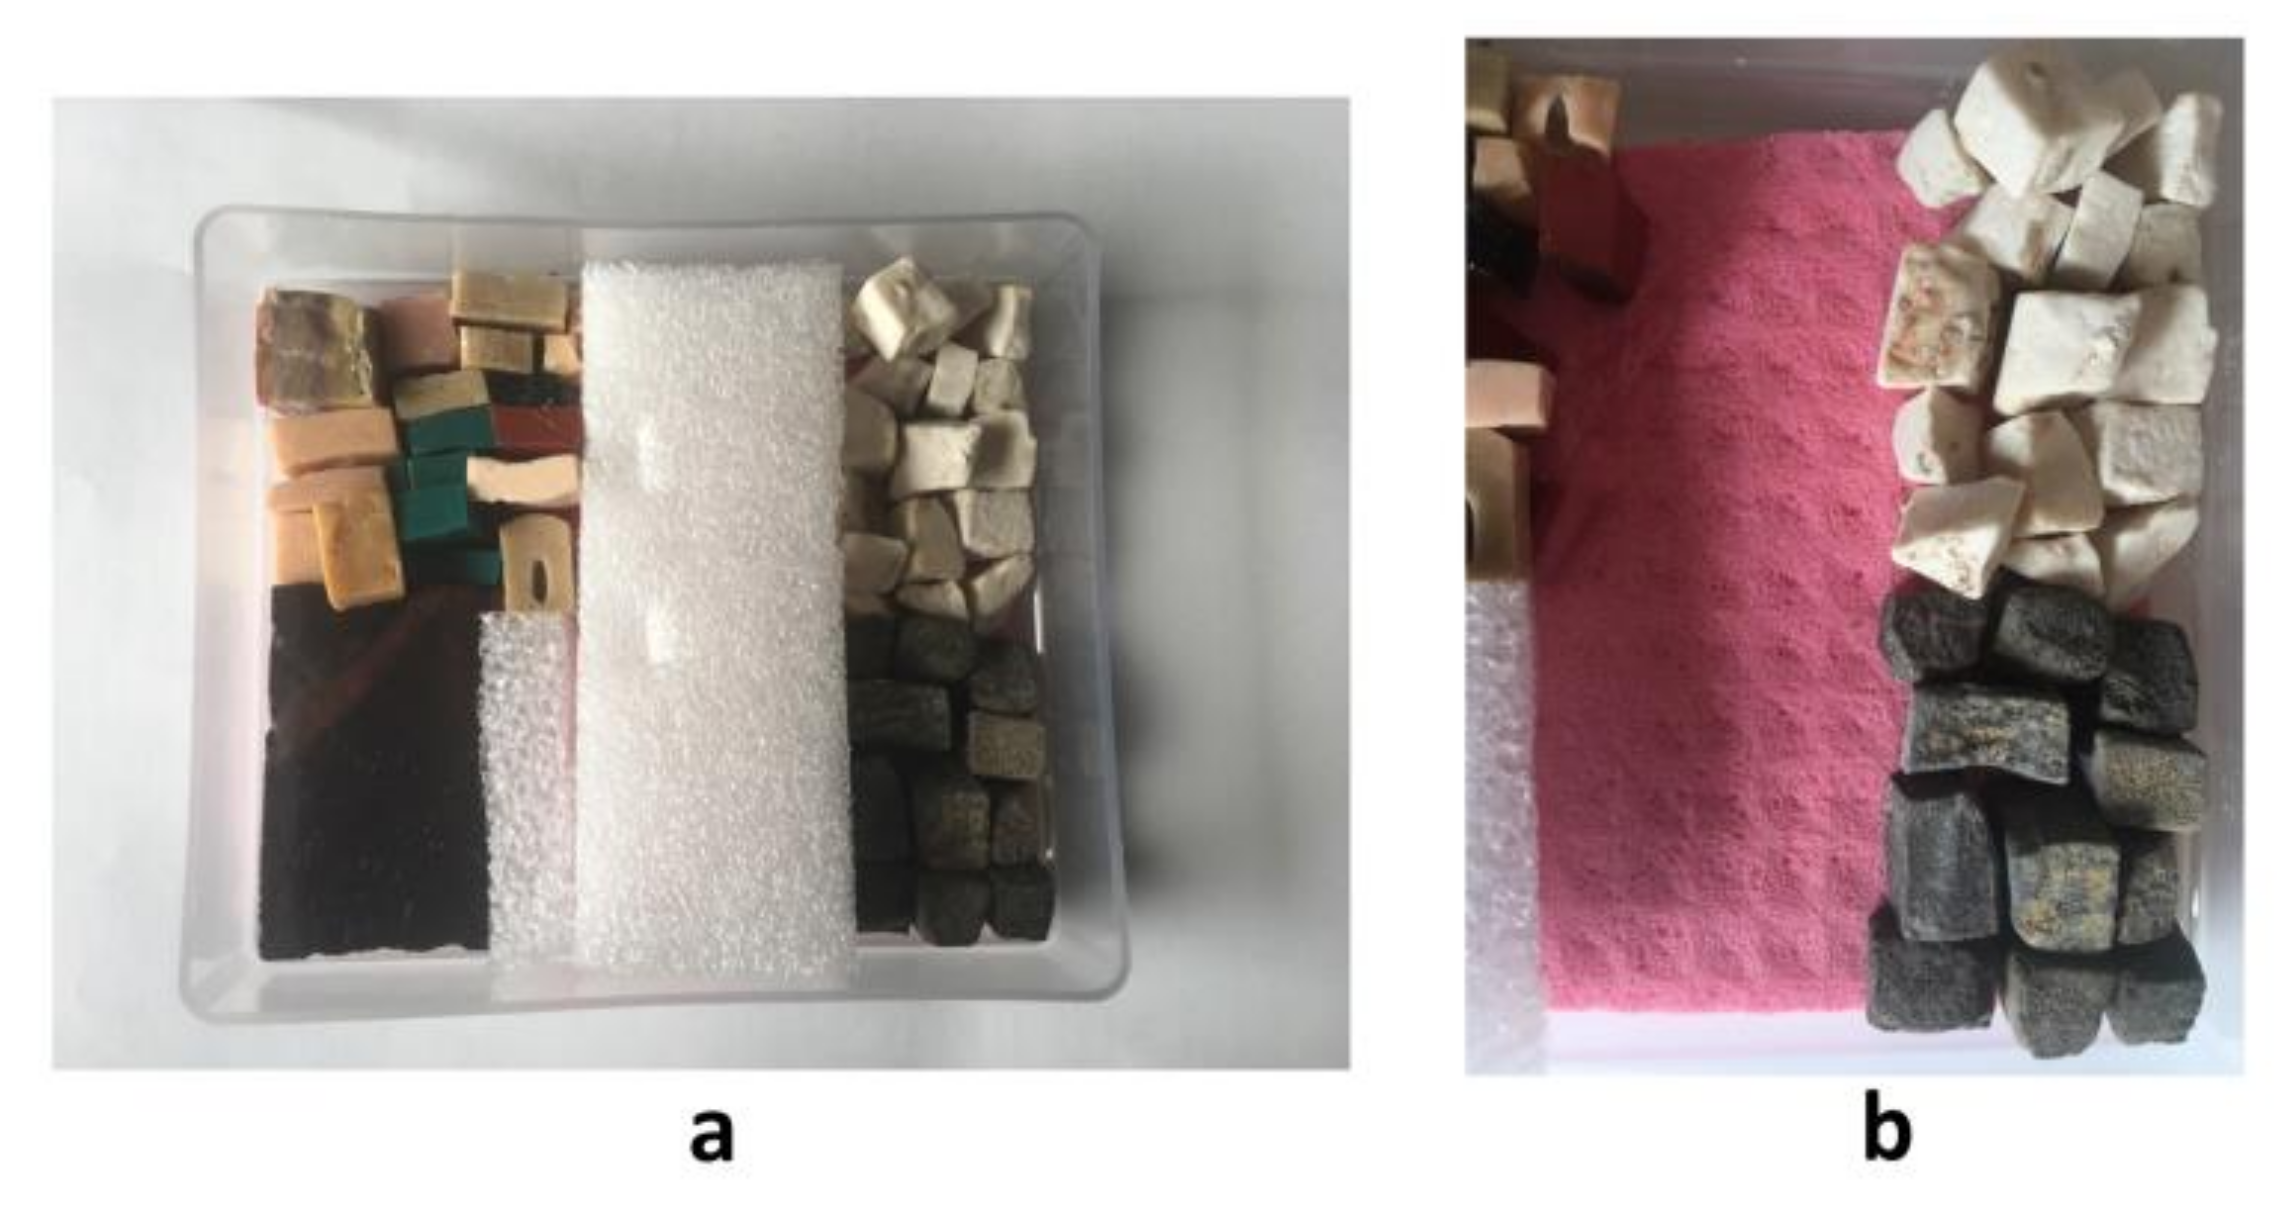
In addition, a sample simulating the absorption property of mosaic, without the use of mortar, was prepared (
Figure 21). It was made using a sponge material as the substrate, i.e., one that absorbs water, and various stone tesserae. The assembled mock-up was placed in a plastic box.
Mosaics are of a particular interest because one of the more frequent causes of degradation is biological infestation from organisms, such as cyanobacteria, thiobacillus and green algae, that are able to colonize the layer under the tiles, thus causing the tesserae to become detached from the support. If the ability of the THz radiation to penetrate under the tiles and to detect the water contained in moss, lichen and weeds has been demonstrated, this technique could be an important tool for the conservation of mosaics.
In order to perform measurements on the sample without mortar, the 3D scanning prototype was modified so as to allow the horizontal surfaces to be measured (
Figure 22).
Unfortunately, for mosaic samples, in which sharp angles were present on the surface, it was almost impossible to correct the topology of the sample. Thus, measurements were carried out by moving the probe to a greater distance from the sample, to where the oscillations of the signal due to phase beating are greatly reduced.
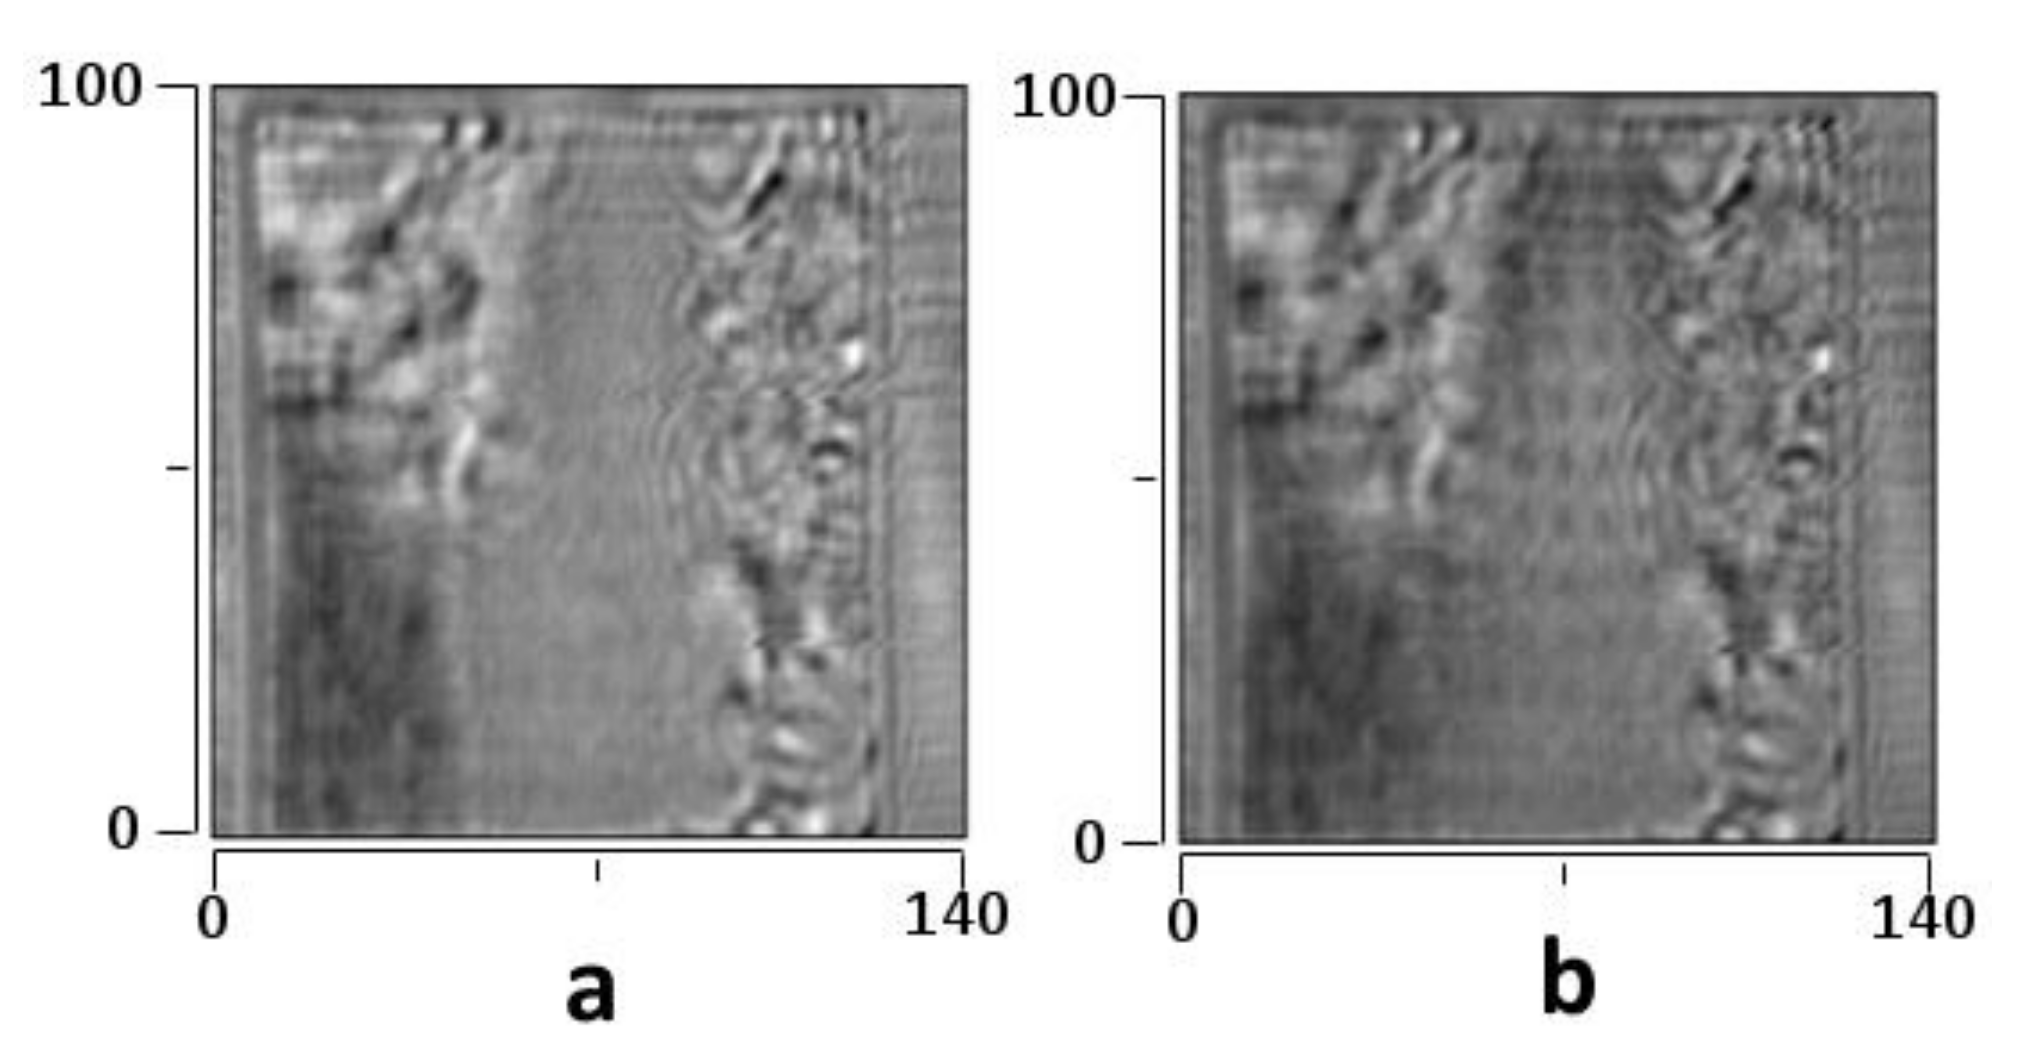
A THz image was taken of the dry sample described in
Figure 20. Subsequently, 5 mL of water was injected with a syringe into the top left corner of the plastic box, under the stone tiles, and scans were then performed at 5, 10, 15 and 60 min after the inoculation. In
Figure 23, the THz images of the dry sample and of the sample 60 min after an injection of water was reported.
It is possible to see that the water diffusing in the substrate makes it reflective: the typical crossed configuration of the sponge surface is visible in the wet figures.
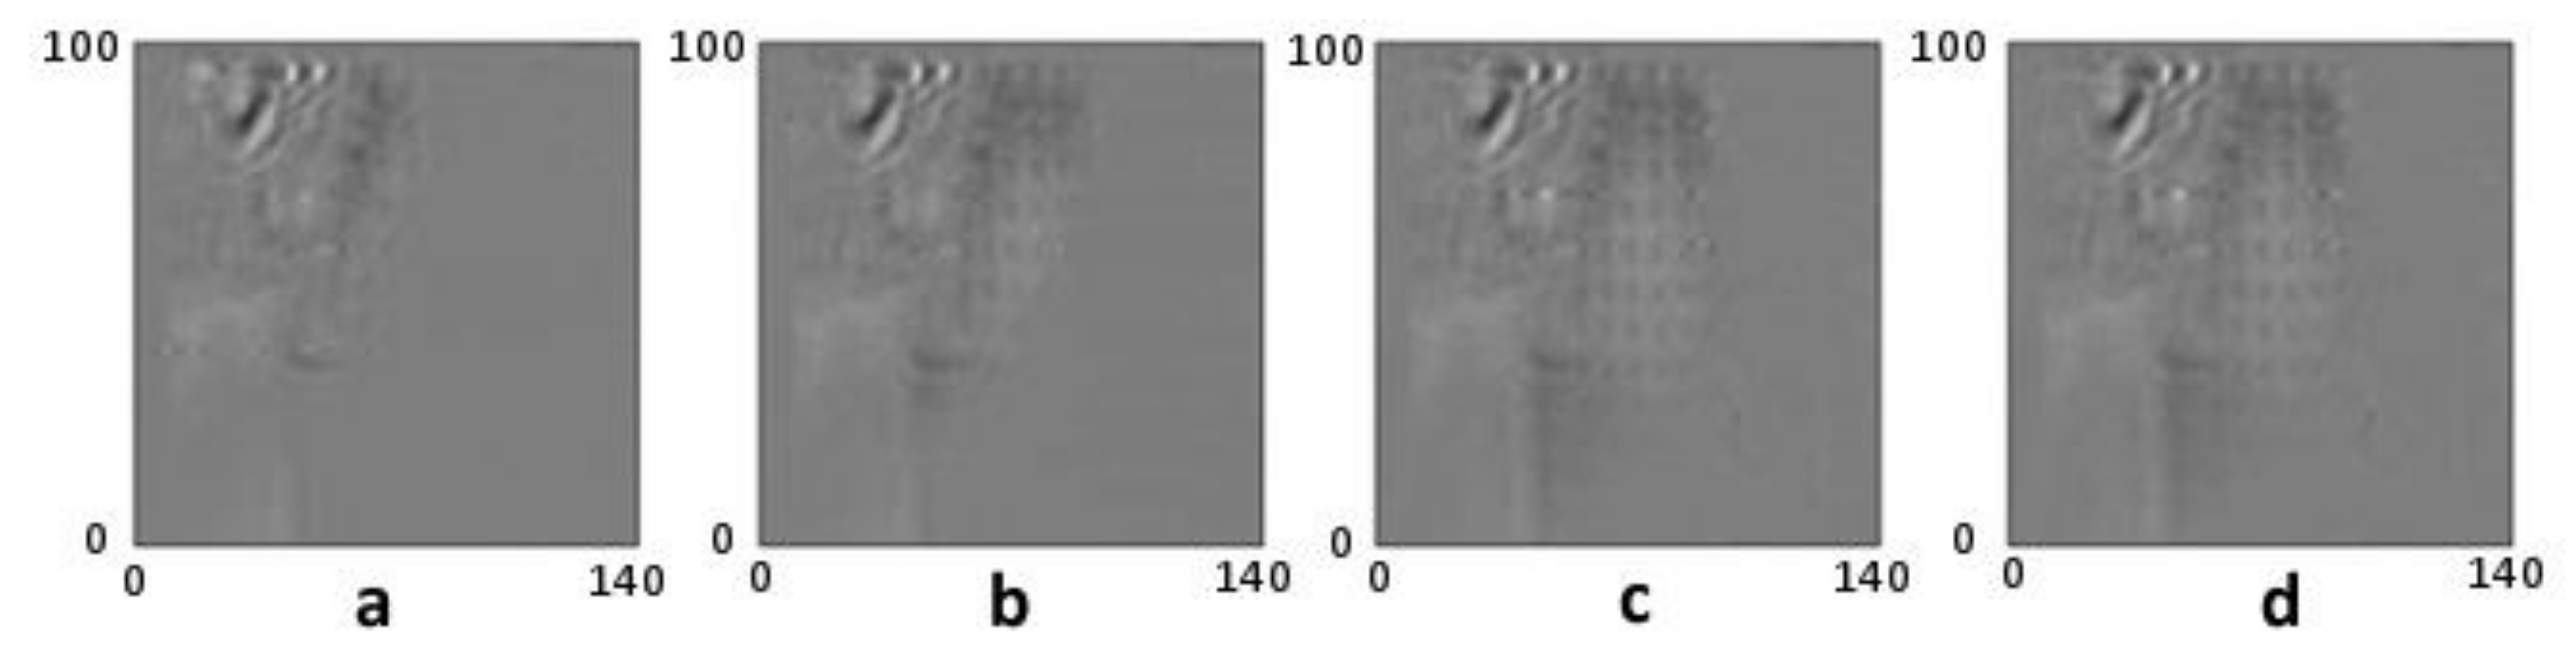
In order to better visualize how the water diffuses into the surface, it was decided to show the images obtained by subtracting—point by point—the dry image (a) from the subsequent wet images, thus evidencing the variations from the initial conditions, as reported in
Figure 24 (where the diffusion of water is clearly visible).
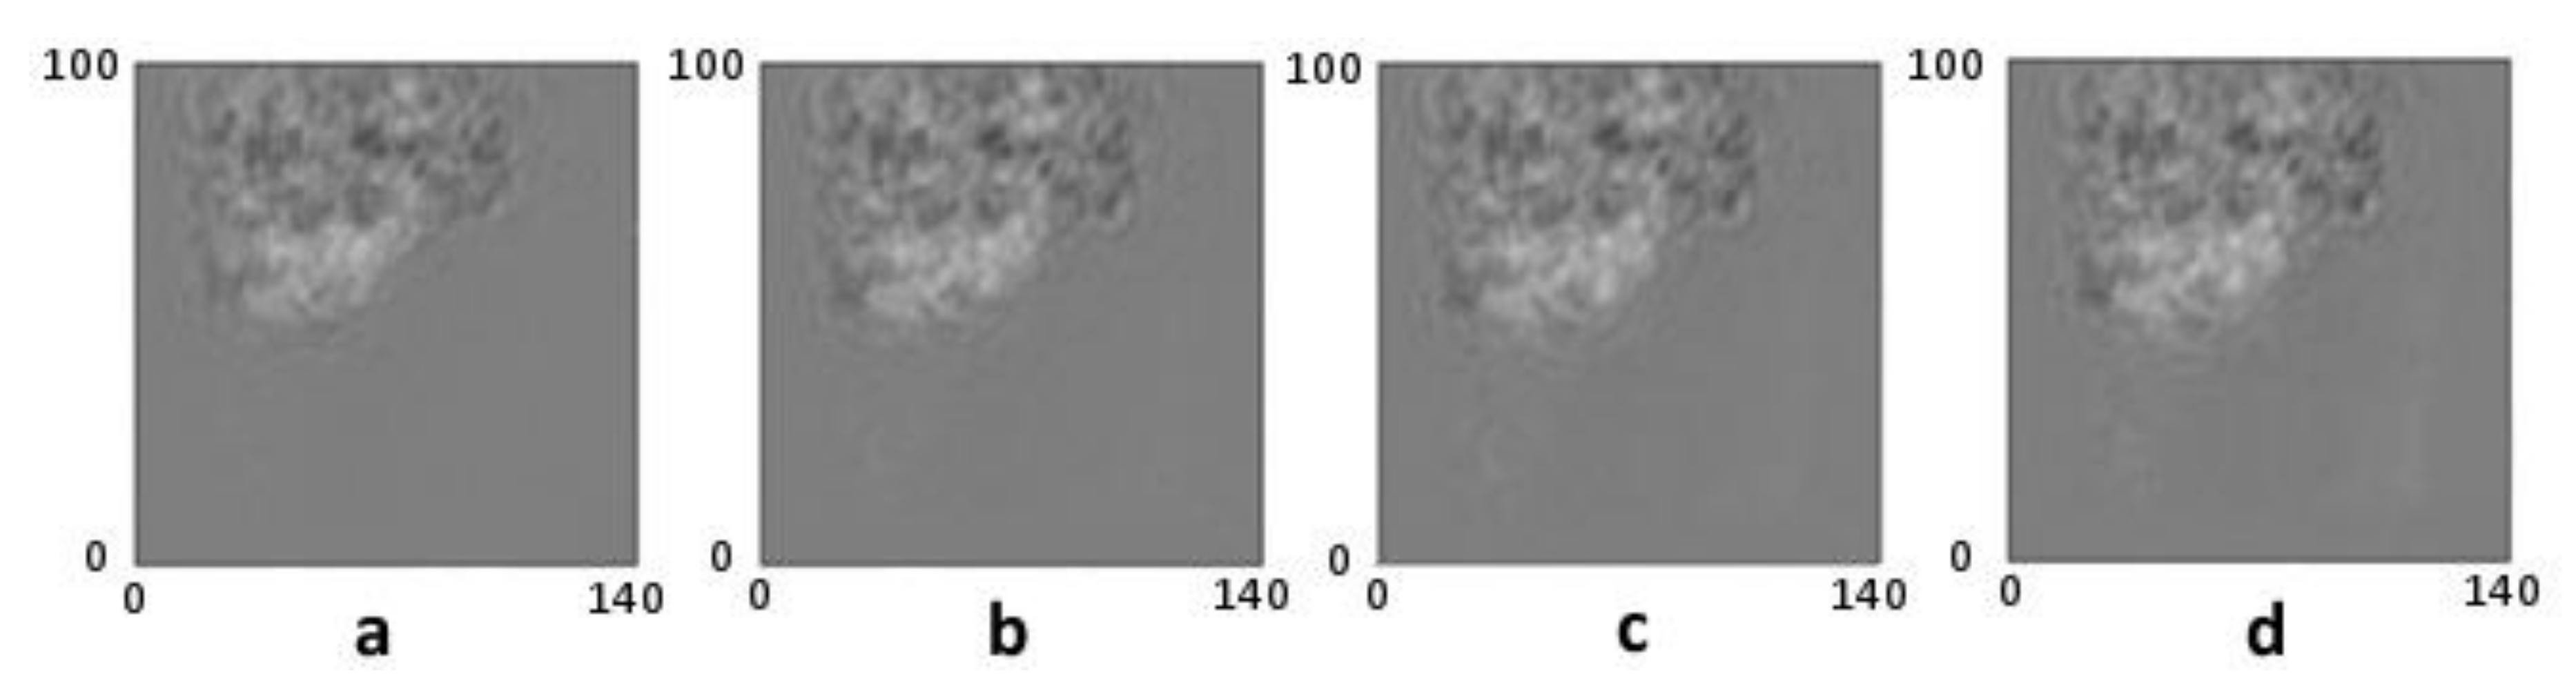
Similar results were obtained with the other samples. In
Figure 25 are reported the images of the water diffusion inside the fresco sample, which were obtained by subtracting the dry image from the images taken 5, 10, 15 and 60 min after the injection of water (1 mL).
Figure 25 shows that the water diffusion occurs rapidly and stops after about 10 min. This result was confirmed by other measurements carried out by injecting different amounts of water. In this case, the maximum distance reached by the water from the injection point increased with the amount of water injected, while the time needed to reach this limit seemed to be independent of the amount of water injected.
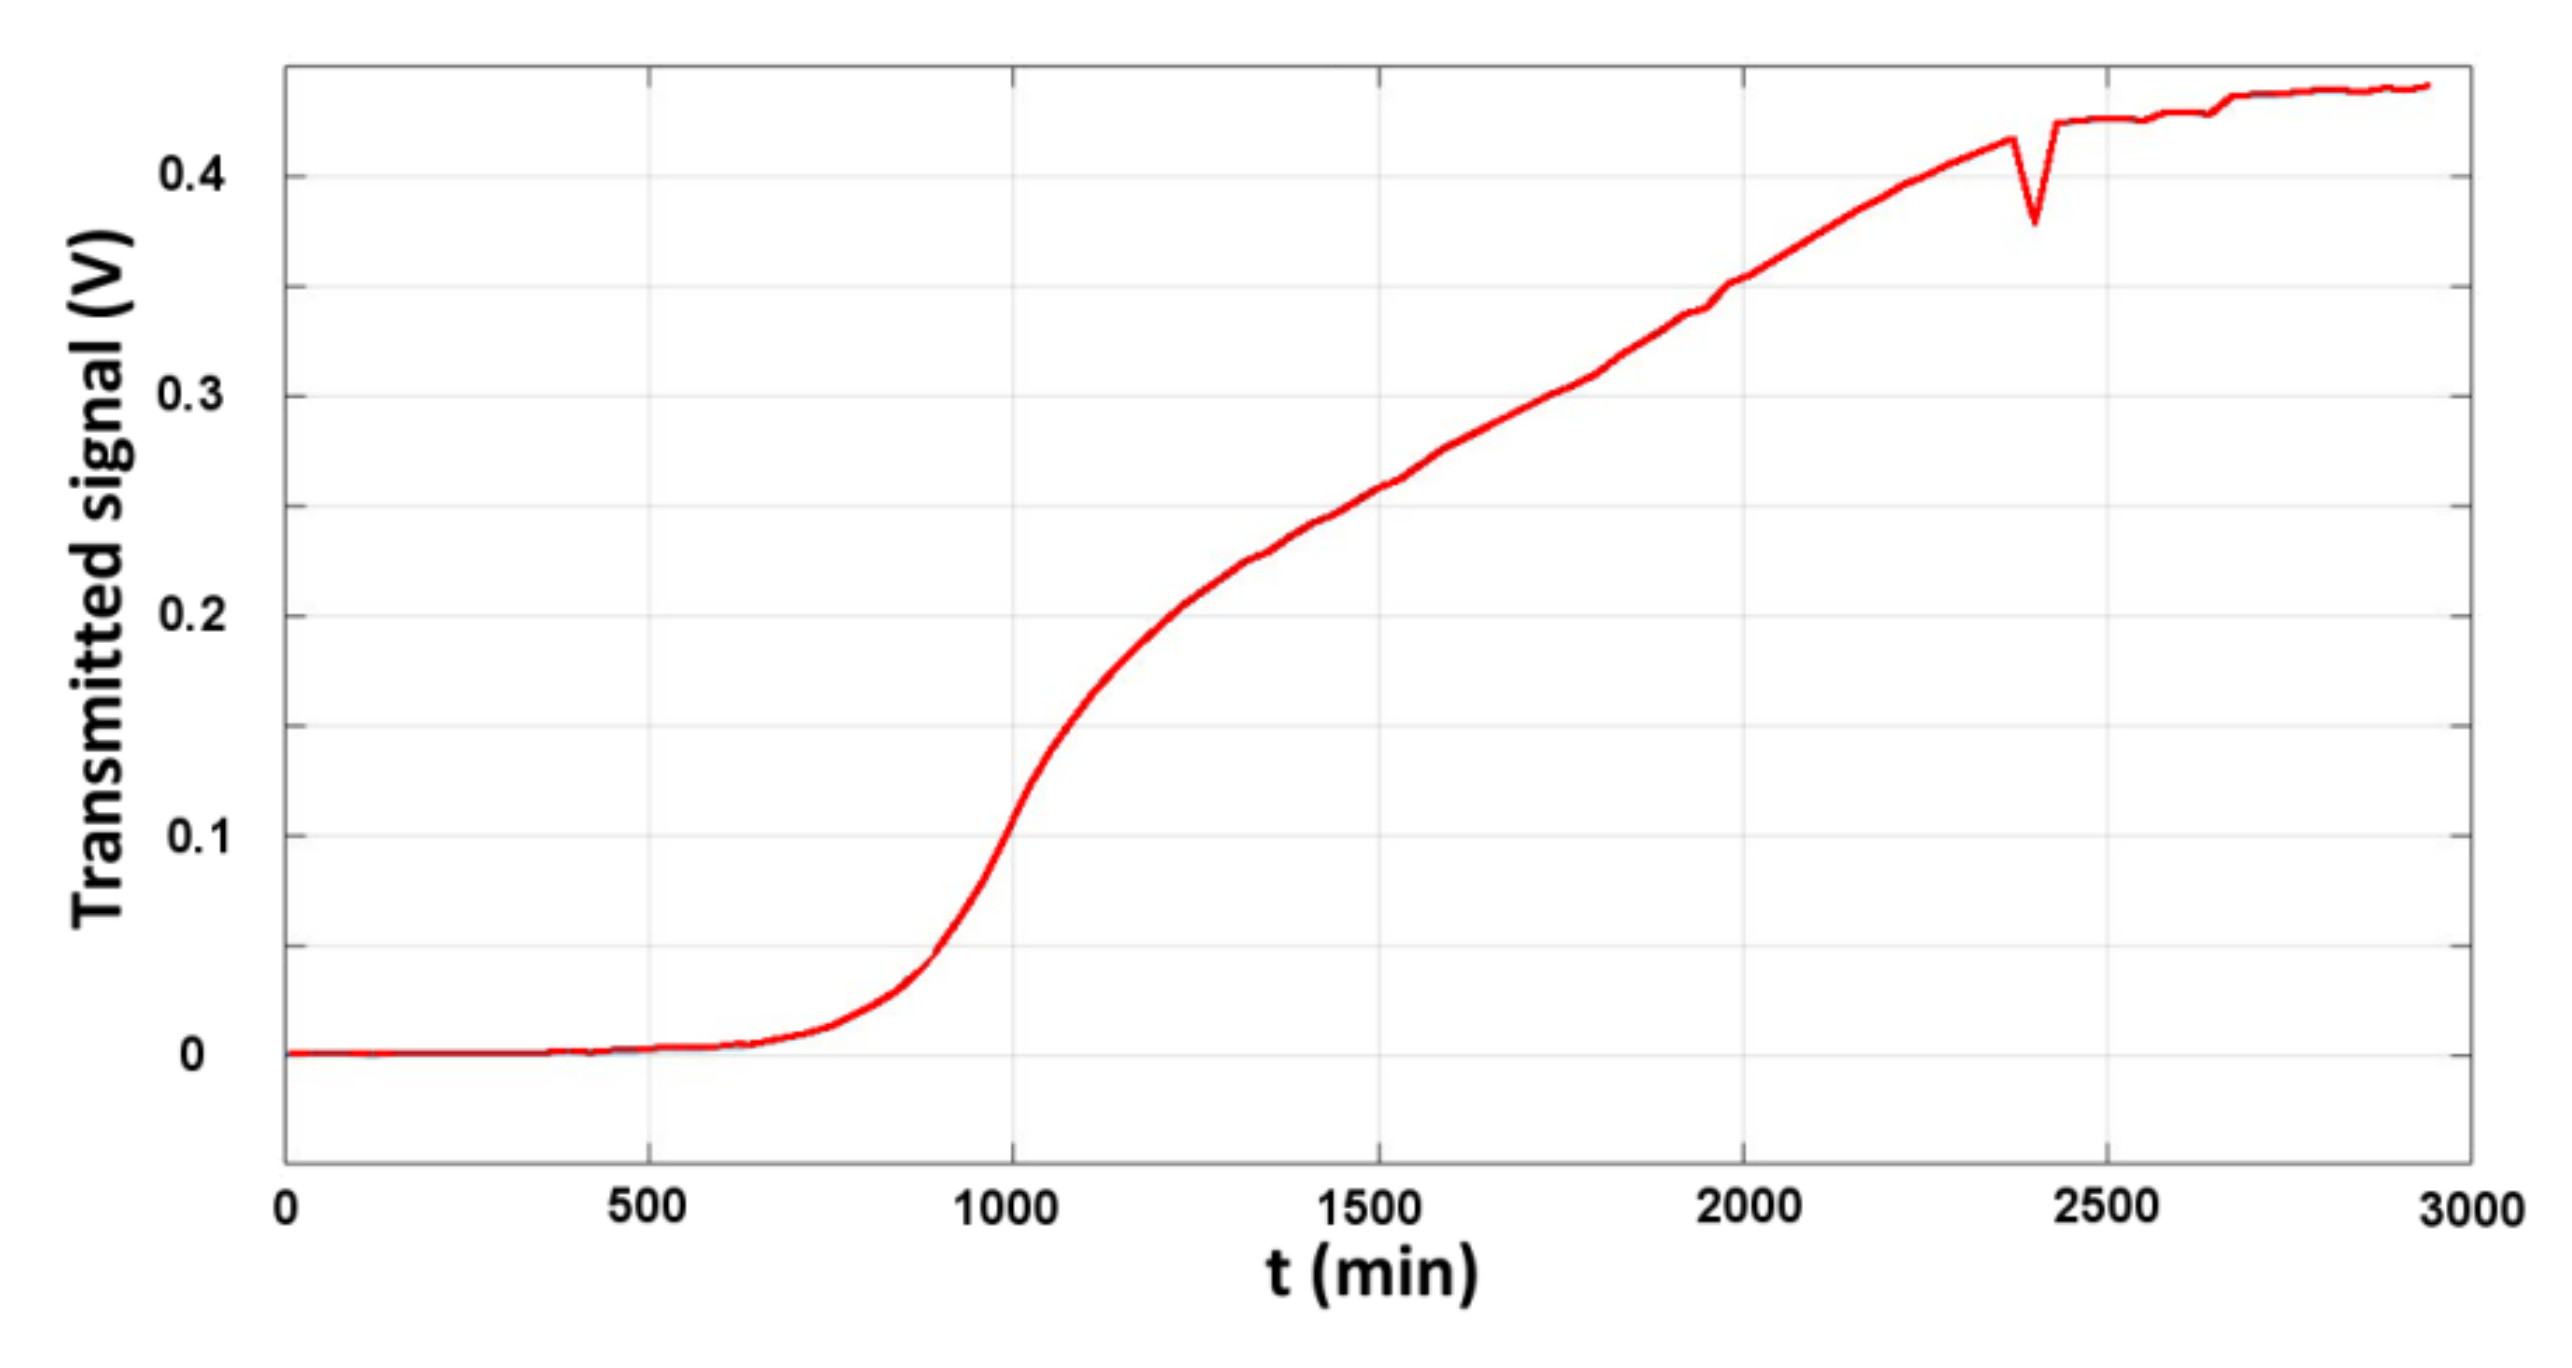
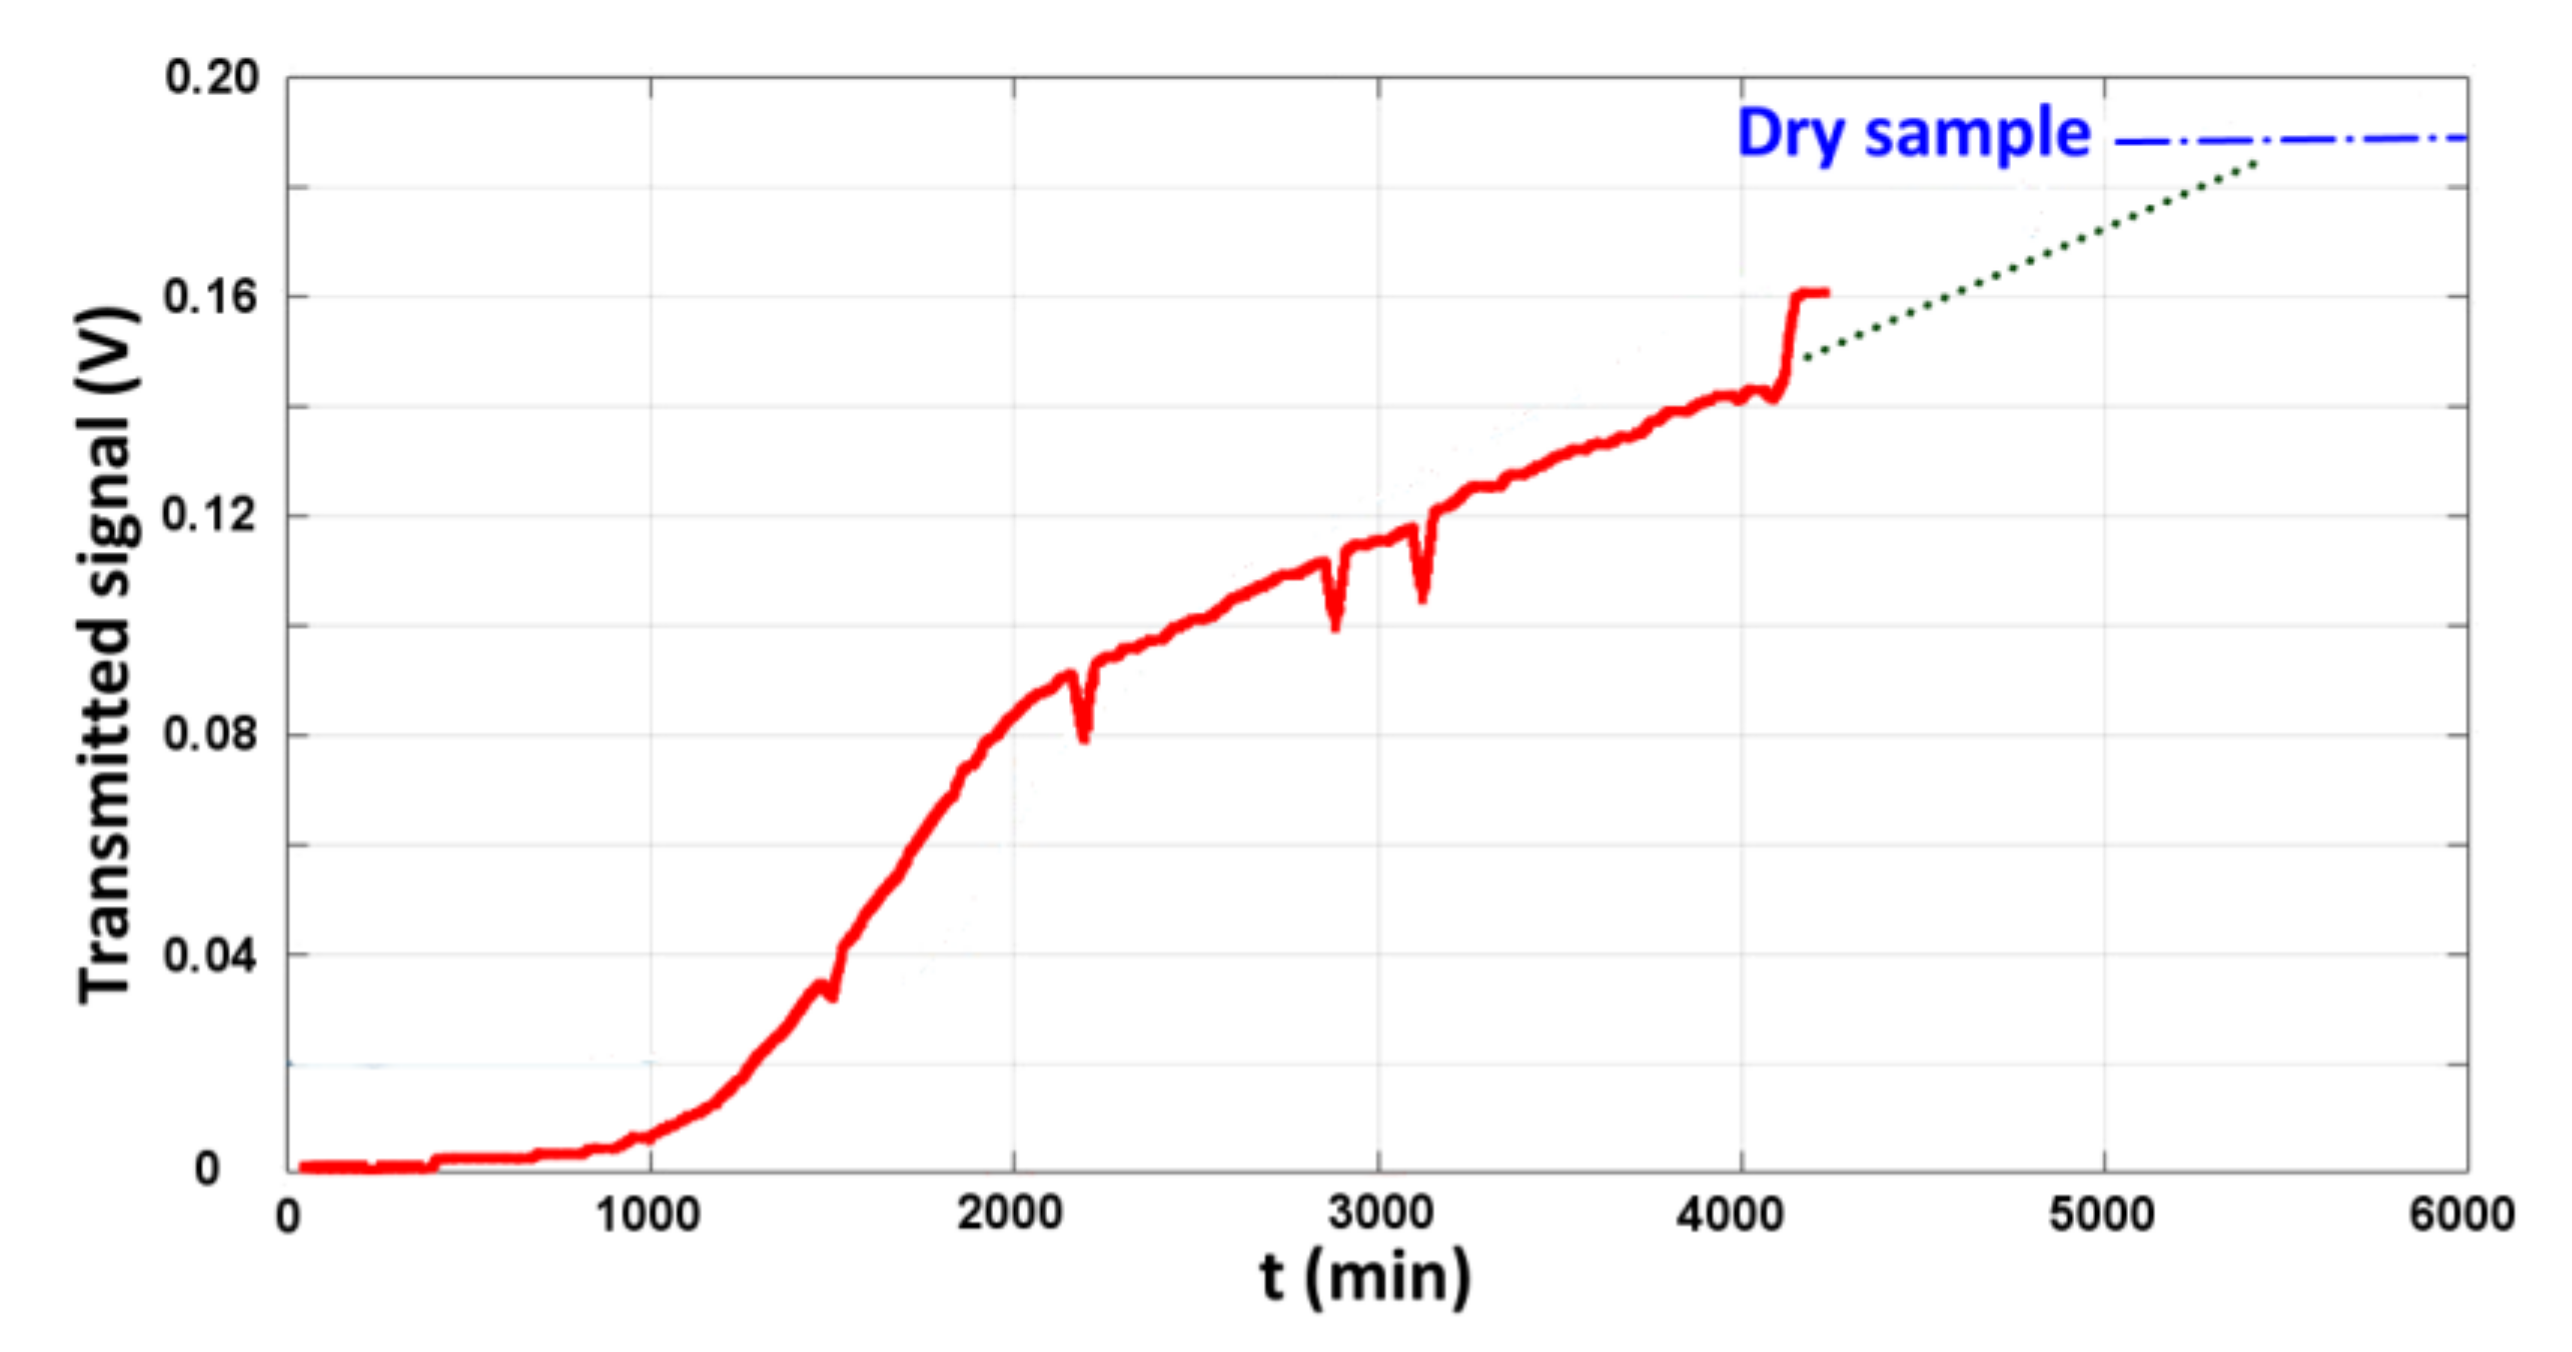
Another set of measurements was carried out on the drying/wetting mechanisms for both mosaics and frescoes, by making use of a source operating at 25 GHz. Surface-integrated measurements were performed by measuring simultaneously the reflection and the absorption of a sample wet by a controlled amount of water (15 mL) while waiting for its natural drying process. Samples were placed, face up, inside a Petri dish and 15 mL of water were poured into the dish while irradiating with 25 GHz radiation. Water diffused from the bottom of the Petri dish through the thickness of the sample and by reducing the transmitted radiation. Transmission of the fresco sample dropped from a value of 360 mV (detected signal) to about 1.5 mV, while for the mosaic sample the transmission dropped from 90 mV to zero. The reflected signal increased for the fresco model, from 28 mV to 56 mV, while for the mosaic the value remained more or less the same, because the reflection came mainly from the tesserae and the contribution from the underlying water seemed to be negligible.
In
Figure 26 is reported the behavior of the sample transmission as a function of the drying time for the fresco sample, while in
Figure 27 similar results are reported for the mosaic. The time necessary for returning to the original situation (dry sample) seemed to be greater for the mosaic, probably because the stone tesserae were less permeable to water than the plaster, which was the fresco support, and this fact slowed down the drying process.
8. Measurements on Leather: The ADAMO Project
Within the framework of the ADAMO (Analisi, DiagnosticA e MOnitoraggio) project [
46] it was decided to focus the THz activities on the characterization of leather wallpapers. During the period between the 16th and the 17th century, most of the noble residences in Rome and in the surrounding area were decorated with rich leather wallpapers. These wallpapers had both a decorative and a practical function, due to the thermal insulation properties of leather. The use of leather wallpapers had a slow decline in the 18th century, and leathers were slowly replaced by fabrics and printed papers. Nowadays, only a few examples are still visible: a room in Villa Aldobrandini, in Frascati; a room in both Palazzo Borghese and Palazzo Massimo in Rome, and a few more in other parts of Italy. One exception is Palazzo Chigi, in Ariccia, where more than 10 rooms are still decorated with leather wallpapers [
47].
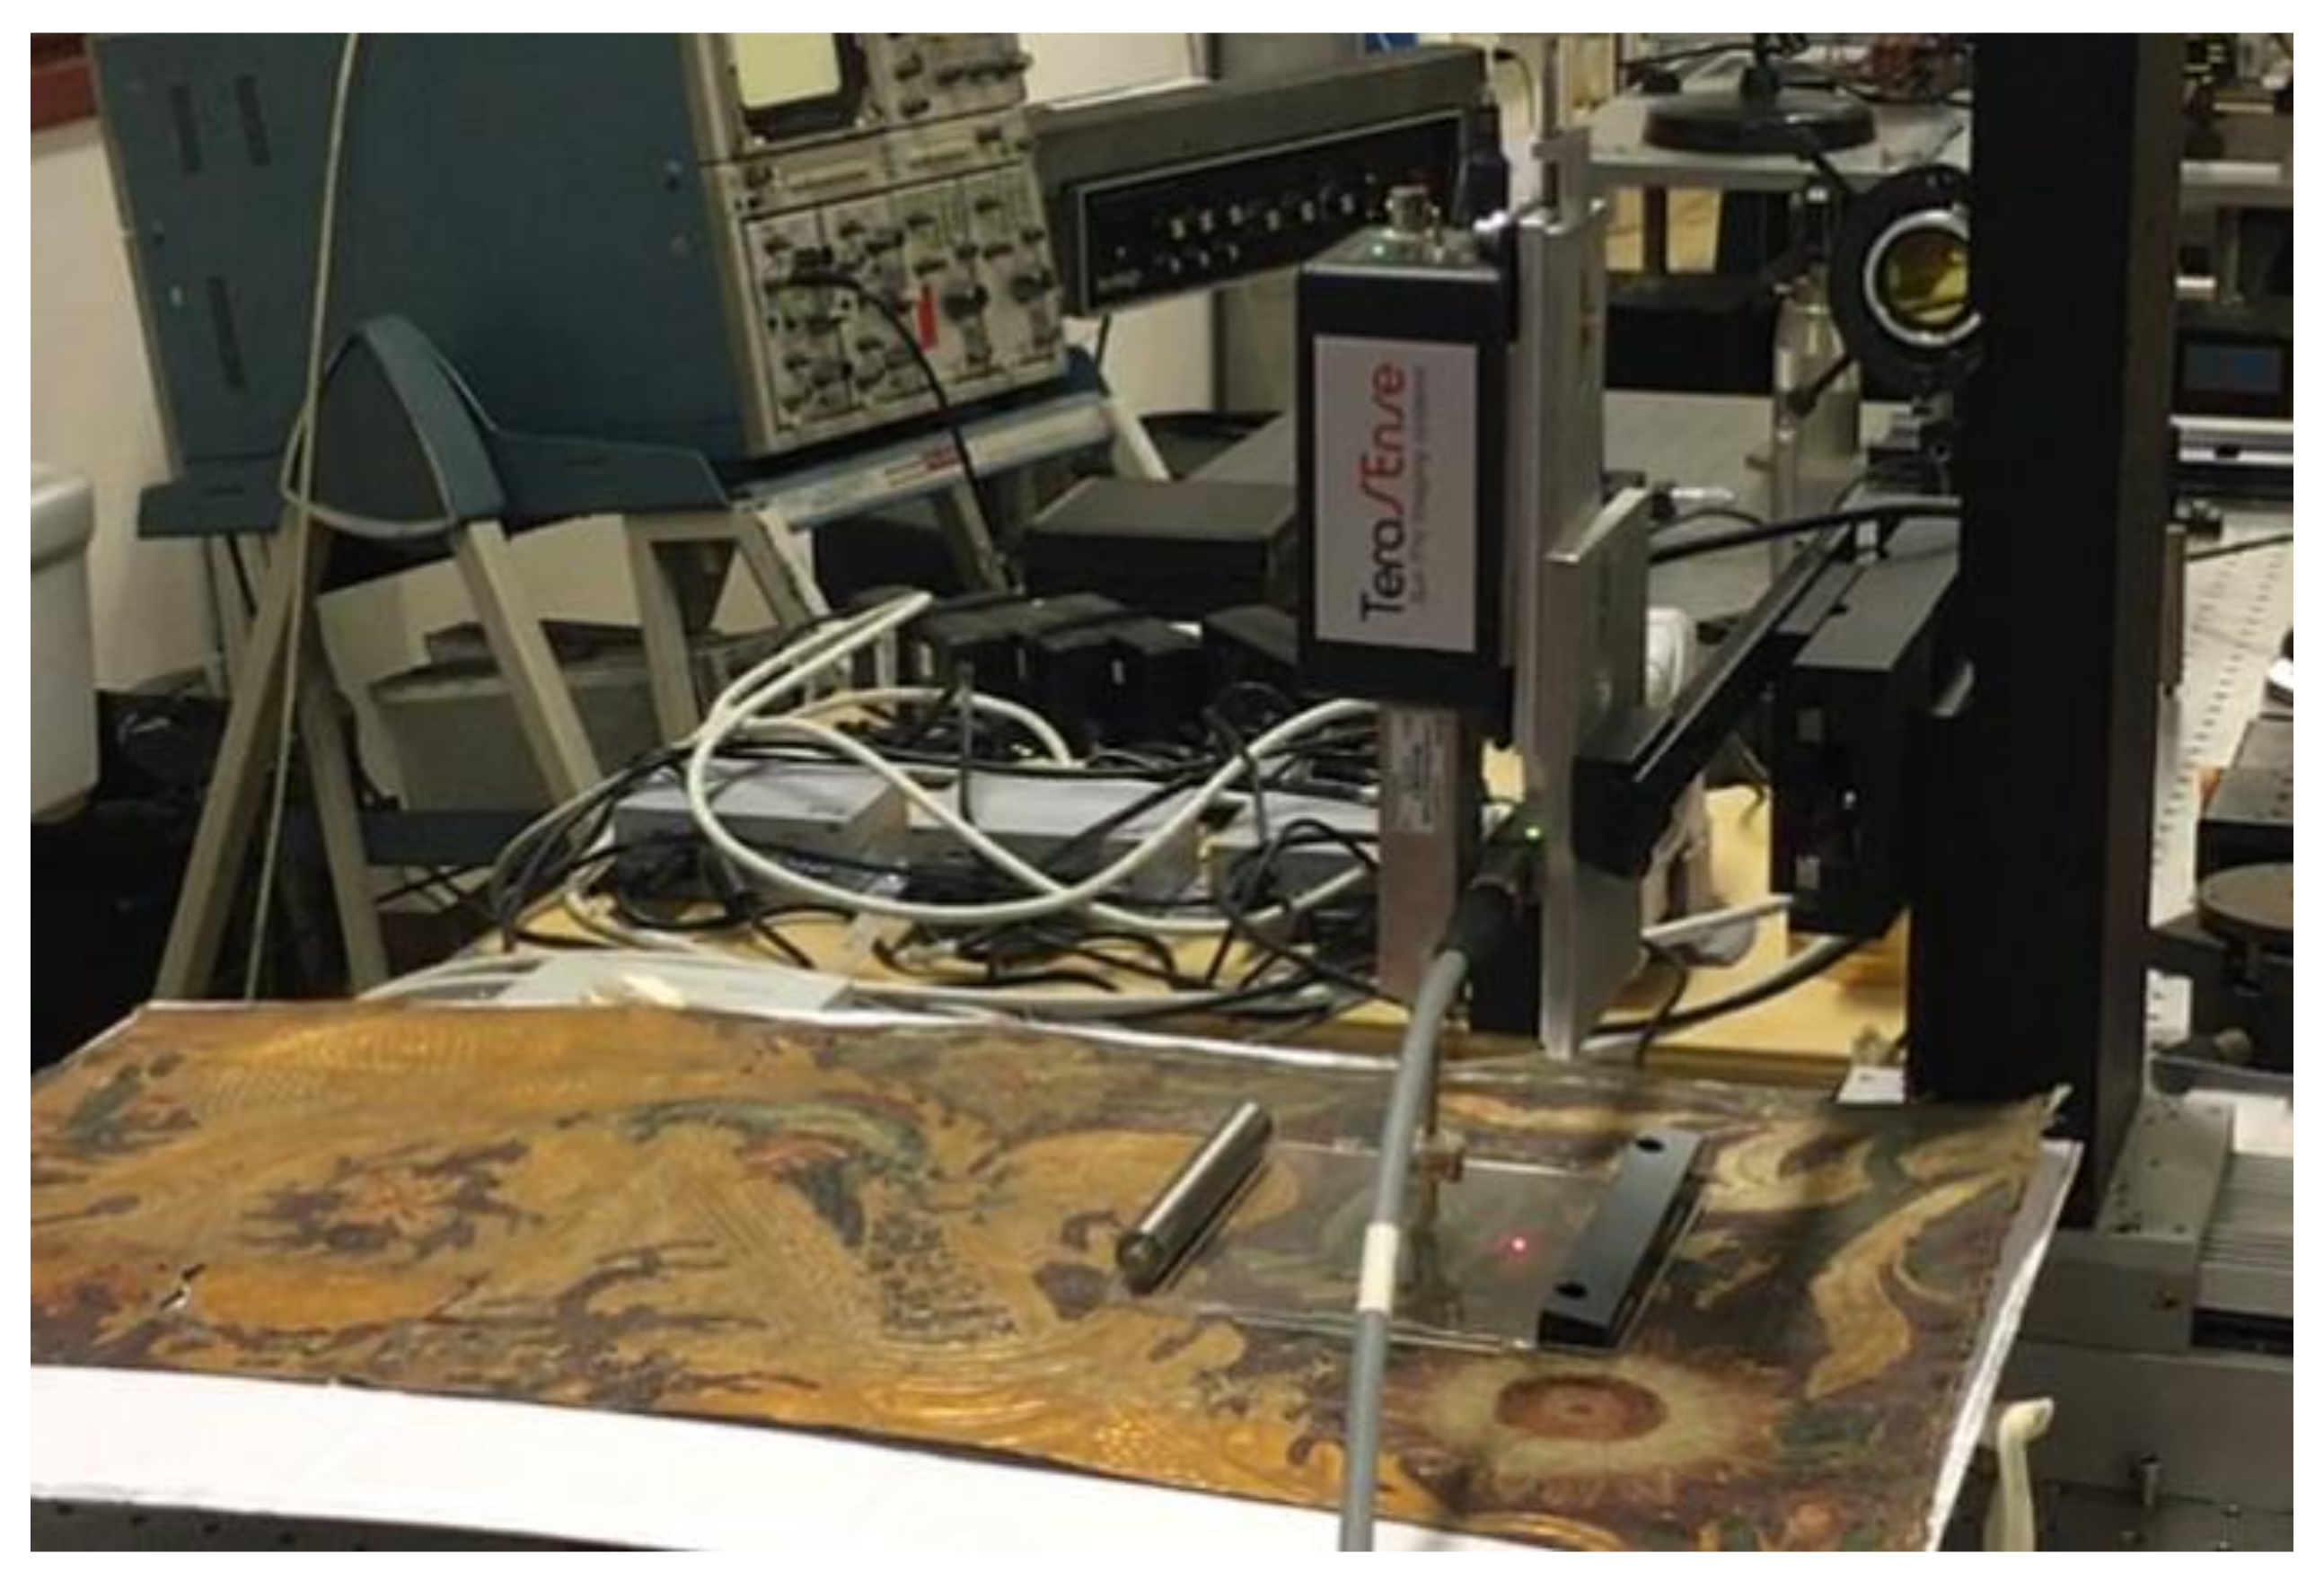
Art conservators showed interest in obtaining scientific data on these rare wall decoration materials, and several samples belonging to the Roman Baroque Museum at Palazzo Chigi, in Ariccia, were kindly made available for experiments by the Museum director, architect Francesco Petrucci. Different analytical techniques were used to analyze these samples, such as time-of-flight secondary ion mass spectrometry, attenuated total reflectance-Fourier transform infrared spectroscopy, macro X-ray fluorescence, nuclear magnetic resonance, particle-induced X-ray emission spectroscopy, scanning electron microscopy, light transmission analysis, X-ray fluorescence spectroscopy. THz imaging has also been performed on some leather wallpaper fragments from the Chigi Museum of Ariccia, in order to verify the ability of THz radiation in revealing the presence of a stratigraphy of painted layers, by exploiting the high reflectivity of painting made with pigments containing metals with a high atomic number Z. The 3D imaging system described above was modified in order to perform measurements of horizontal surfaces and scans of areas of about 10 × 10 cm
2, with a lateral resolution of about 1 mm (
Figure 28). The time needed for a single scan was about 10 min. Scan areas were selected in order to investigate selected details of the Museum’s artwork.
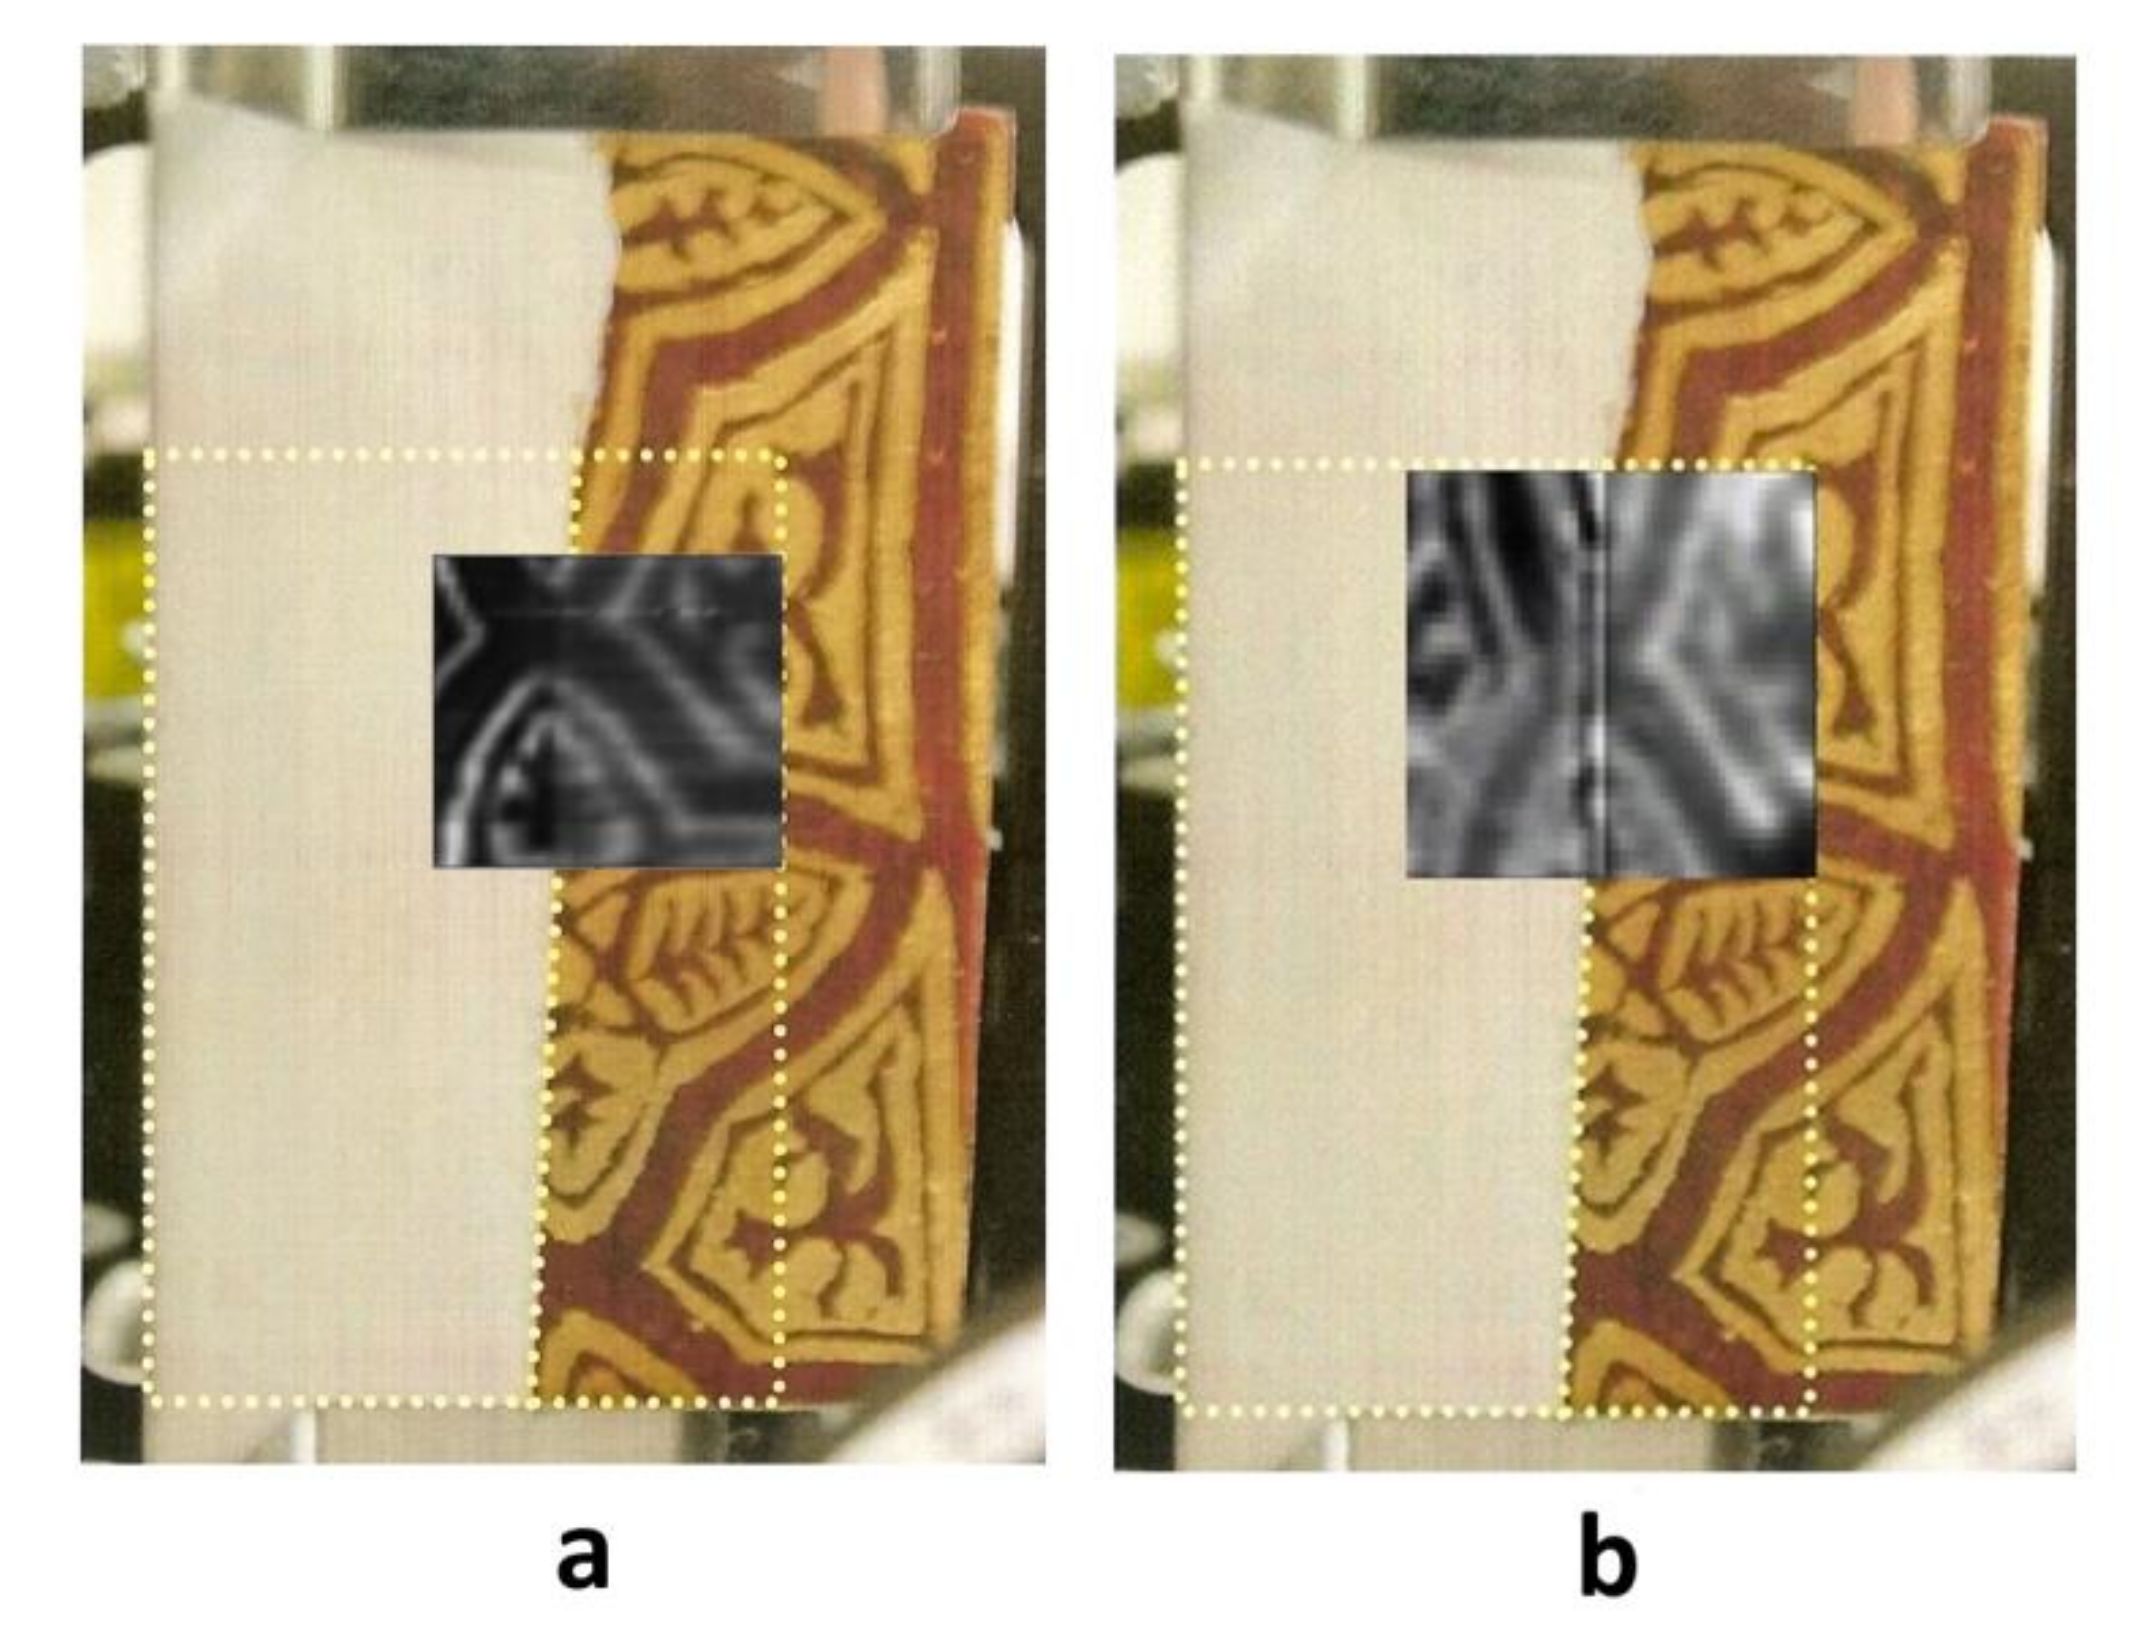
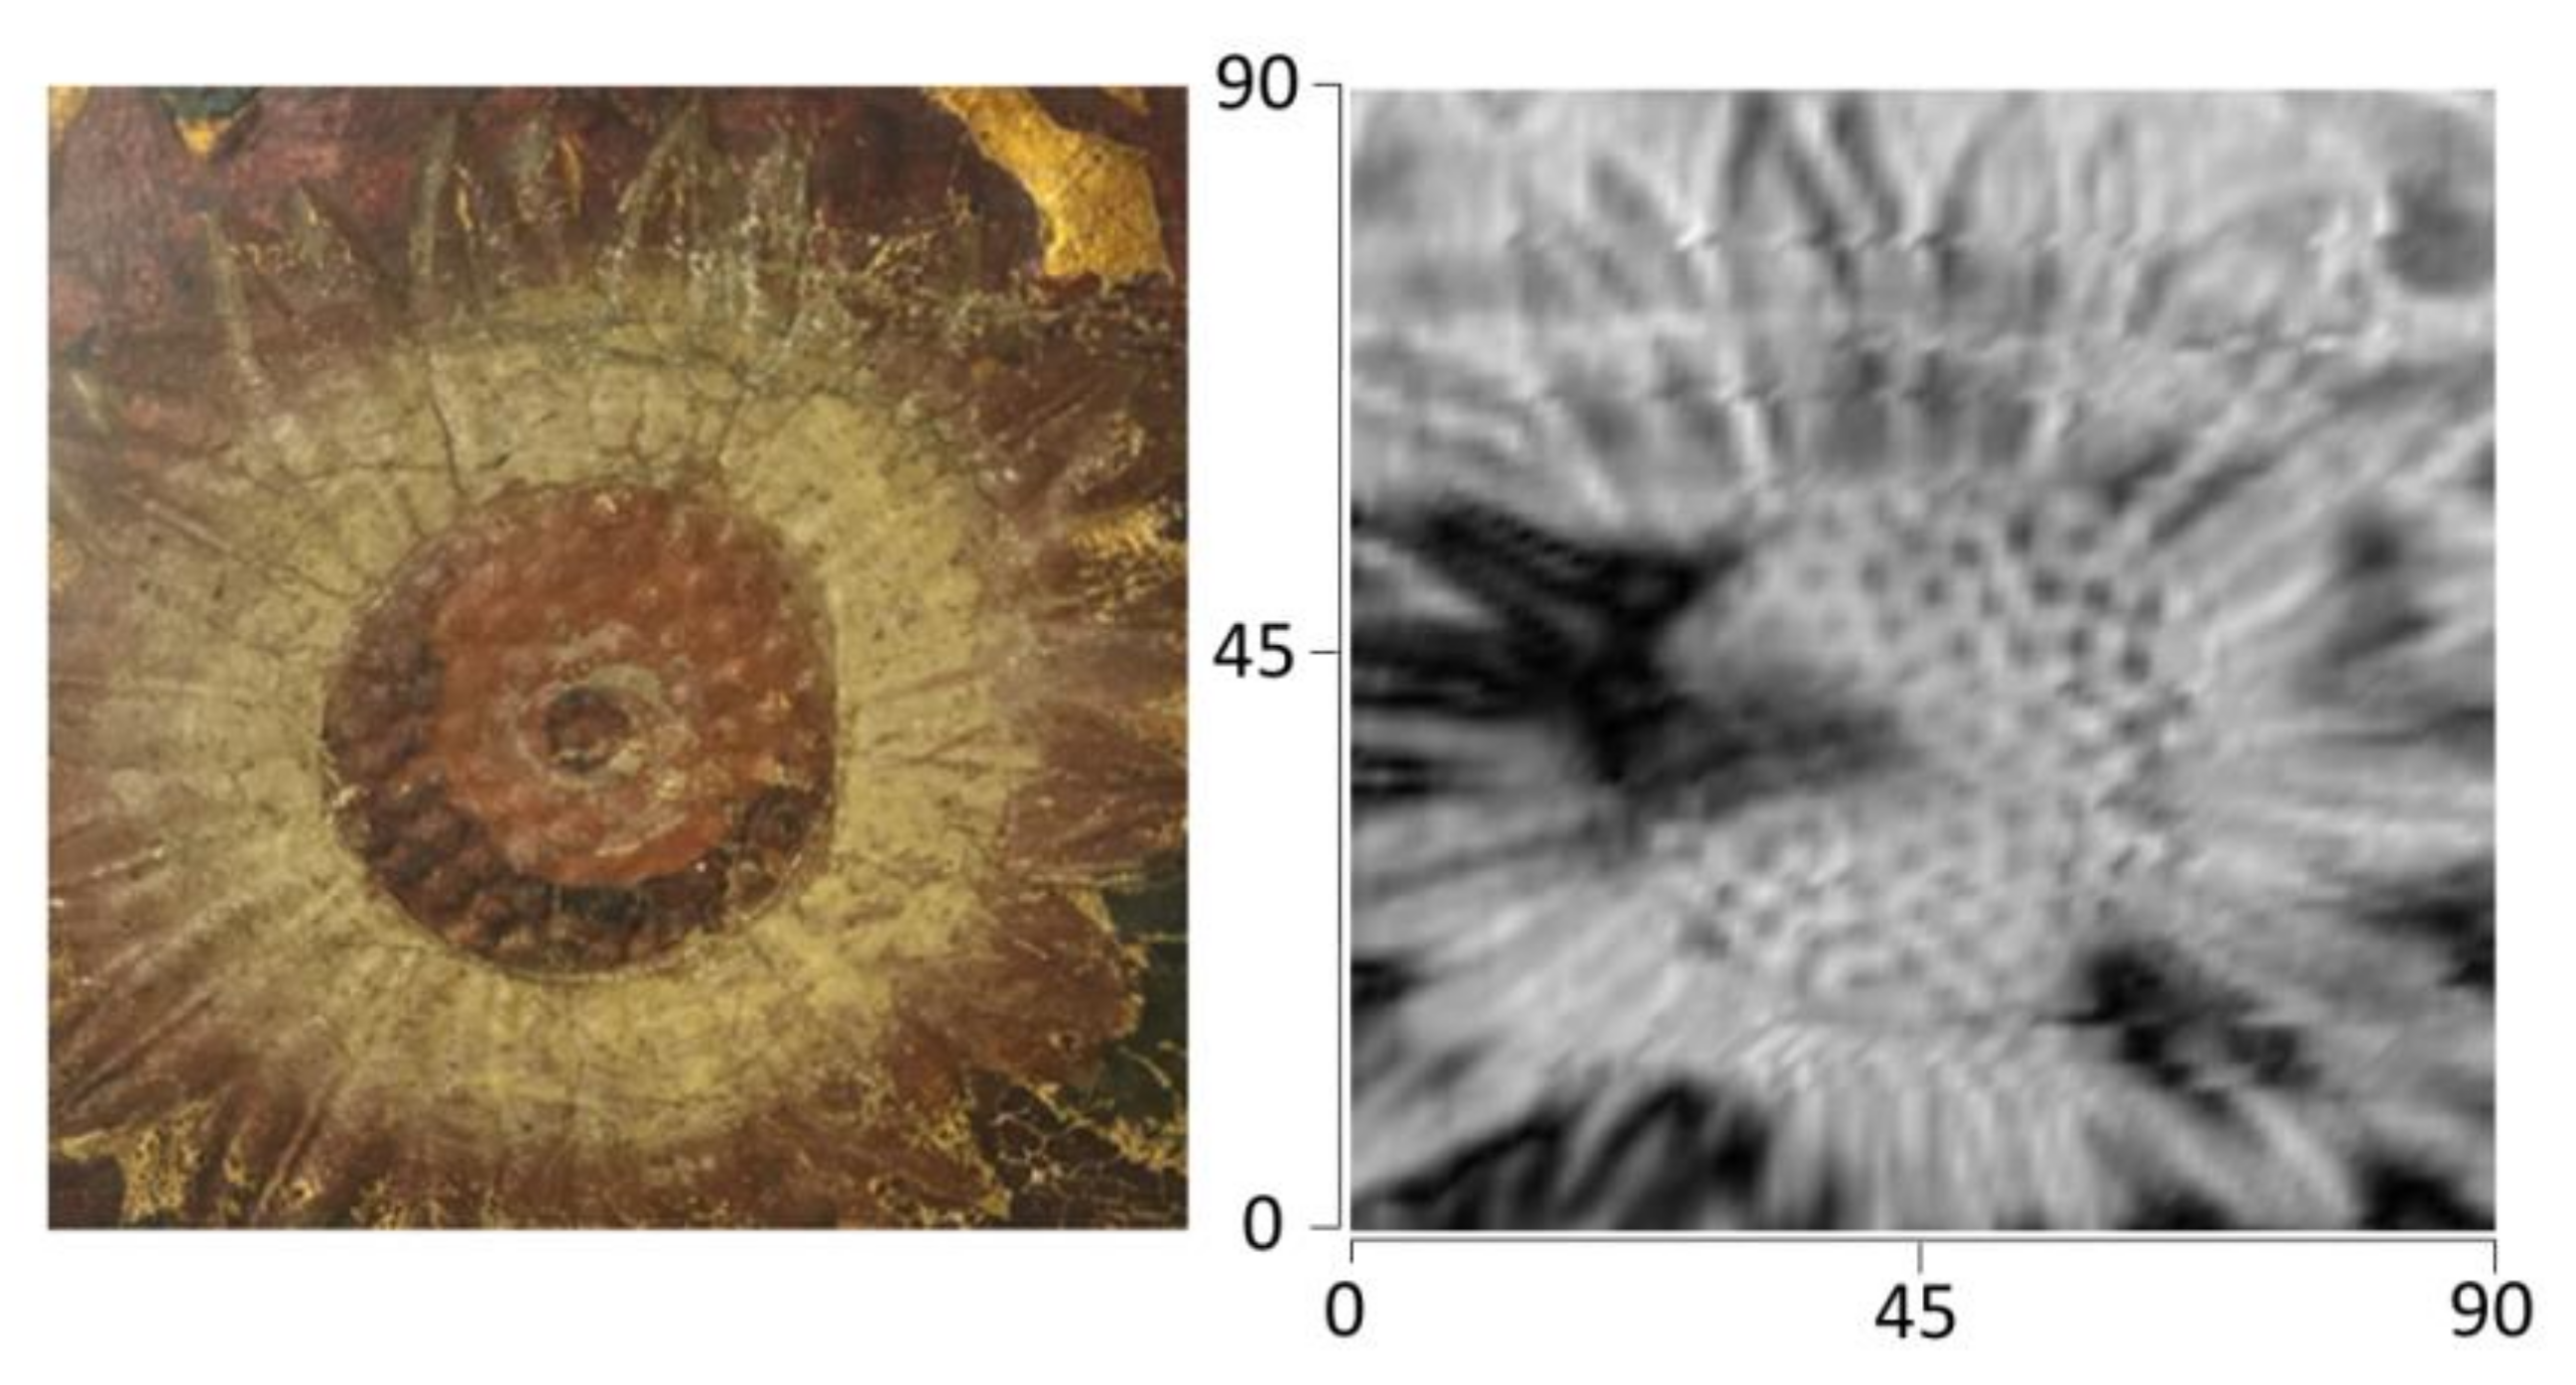
In
Figure 29, it is possible to compare the visible image of the scanned area with the image taken at 97 GHz. Details of the flower are clearly visible in the THz image, but it is impossible to distinguish the contribution made by the pigments from the contribution coming from the structure of the sample. It is possible, in fact, to correct the contribution coming from the surface morphology. However, since the leathers are prepared by using woodblock molds to impress the image upon them (a technique similar to that of xylography), the back of the leather preserves the printed image in relief. Since the THz penetration in leather is greater than the leather thickness, also the morphology of the back surface will contribute to the image, and this contribution cannot be corrected simply by using the laser triangulation system. In looking at the image, it is indeed possible to see some “dark” areas, and these do not correspond to any visible feature of the image. It can be deduced that these areas should come from some sub-superficial layers that are covered by painting.
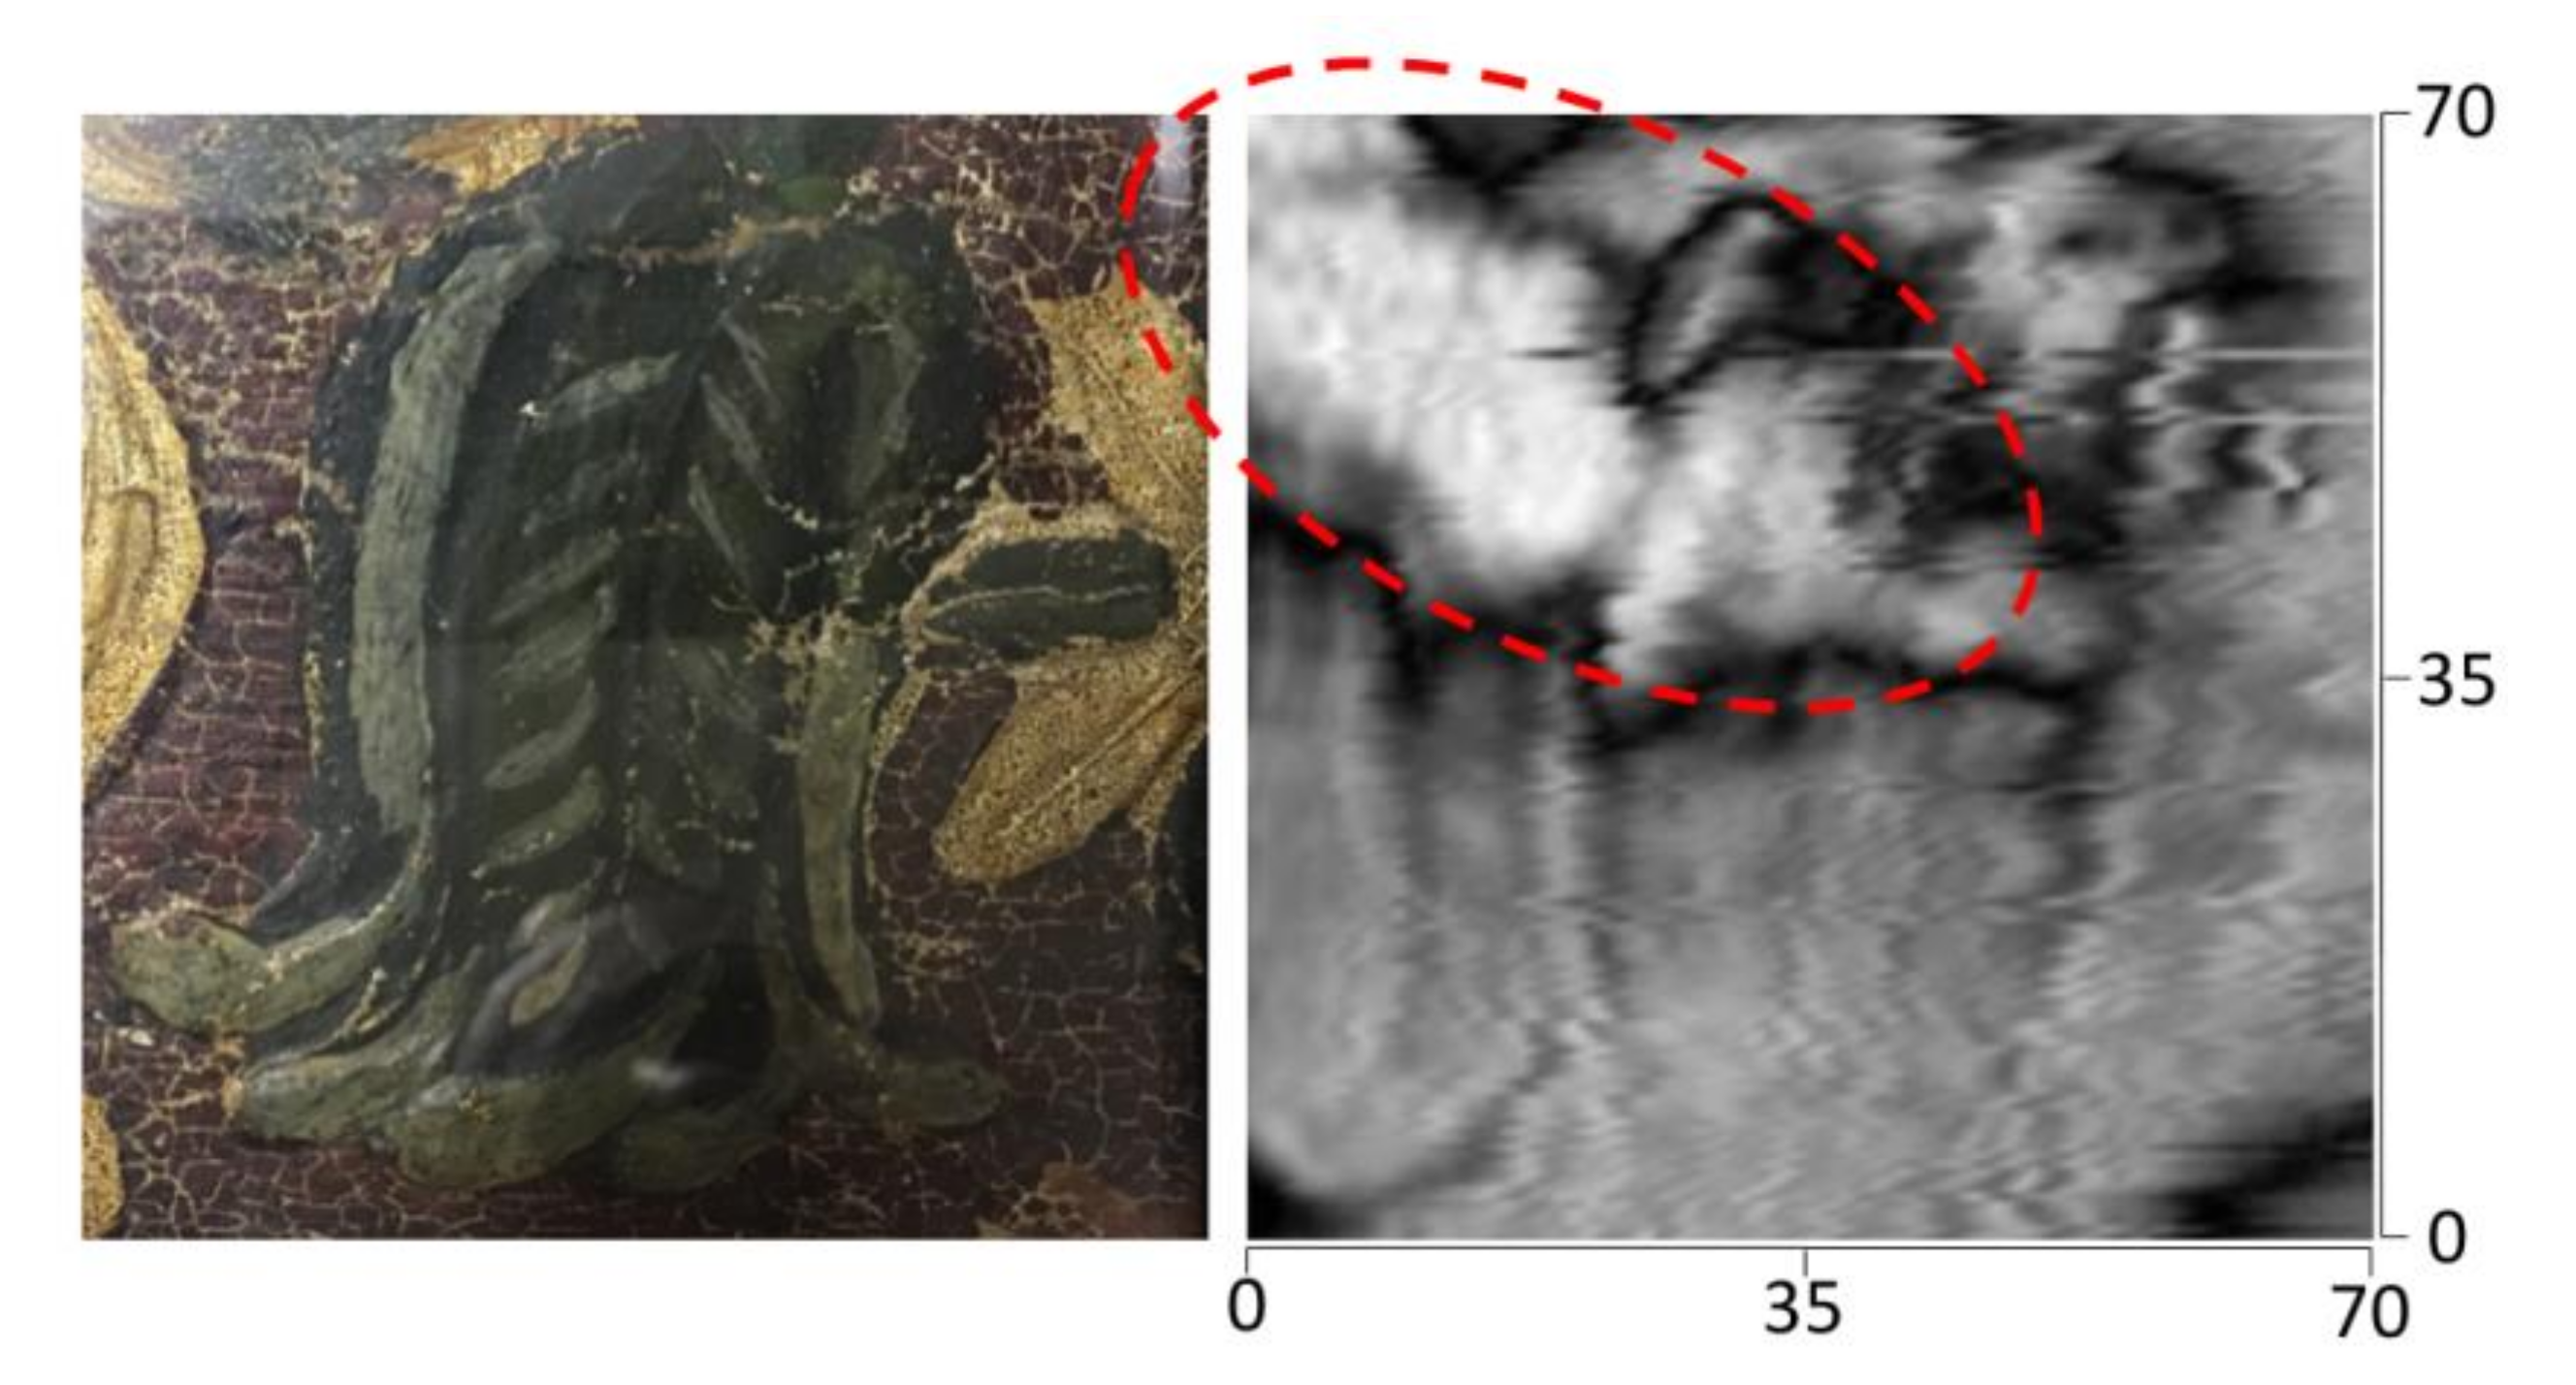
In another sample, a similar type of behavior is more evident. A comparison of the visible and THz image in
Figure 30 clearly shows an artifact in the top left corner that is not visible to the naked eye. In this area, the high value of the reflectivity probably corresponds to a layer of gold paint, covered by another layer of painting, that hides it from view. In fact, if the detail is carefully analyzed using a magnifying lens, it is possible to see traces of golden pigments in the very small cracks of the superficial green painting layer.
On-site measurements have been carried out at the Roman Baroque Museum at Palazzo Chigi, in Ariccia, by means of the same system used for mural paintings (
Figure 31). The main limitation arising from these measurements on leather came from the multiple reflections produced by the wall substrate: in a laboratory environment, such a reflection can be limited by inserting THz absorbing material, such as eccosorb, under the sample to be studied, while such a solution is not applicable for “in situ” measurements.
New laboratory measurements in transmission mode are planned, both with higher frequencies and with a different experimental configuration, in order to obtain results that will not be affected by the morphology of the sample. Measurements aimed at identifying water inside the samples are also being planned in the near future.
9. Conclusions and Perspectives
The new technique developed for THz imaging measurements has shown its strengths, but also its weakness. The portable device proved to be useful for “in situ” measurements. Problems arising from the non-planarity of the sample surface were solved by utilizing a laser triangulation system to obtain the surface topology of the sample and to correct it with the use of various techniques. Depending on the size of the sample, it is possible to choose the right technique: for small objects, a complete, but more time-consuming technique can be used for performing multiple “slice” scans, while a faster scan that adjusts the probe distance in real time is preferred for large areas. Unfortunately, the non-planarity of subsurface structures cannot be corrected with this method, thus limiting the amount of information that it is possible to obtain from the measurements. For example, it is possible to detect any sort of defect that produces a distinct change in the refraction index inside the sample (similar to a detachment in a fresco, or a nail inside wooden materials), but it is difficult to determine precisely the depth of the discontinuity and to obtain optical information regarding internal defects.
New measurements on mosaics also shown a limit in the ability of the system to correct the surface topology of the sample, when sharp angle are present on the surface. In such conditions conventional imaging technique would probably produce similar or better results, thanks to the high reflectivity of water. Differential measurement, to monitor time dependent changes in the samples would benefit from the phase sensitive technique though.
Another practical limitation of the current device configuration is related to the long wavelength: at times, the penetration depth is too great for some of the objects. For example, after the new successful measurements on leather samples in the laboratory, “in situ” preliminary measurements showed that, in scanning leathers mounted on a wall, the non-planar surface of the wall under the leather affects the measurements to enable the obtaining of meaningful results involving the leather structure. For such measurements, a higher frequency would be necessary in order to perform “in situ” measurements. Fortunately leather wallpapers can be detached from the wall in order to perform tests in a laboratory environment, where the reflection from the substrate can be easily eliminated. Such a procedure is non-invasive and is currently utilized from the art conservators when the leather wallpapers have to be restored.
According to the authors’ experience, future developments for THz measurements in the field of art conservation could then proceed in different directions.
For applications at low frequencies (<1 THz), an upgrade in the current system configuration is in progress and includes the use of a variable frequency source, in the 150–300 GHz range. The ability to electronically change the emission frequency makes this new configuration more flexible. For example, it might be possible to use the system in a configuration similar to the typical set-up of a geo-radar system in Frequency-Modulated Continuous-Wave (FMCW) operating mode.
Phase sensitivity is useful for obtaining optical information about the sample, as demonstrated by the results of the study on the pigments described in
Section 5; however, by moving towards higher frequencies, it is no longer necessary, since it is easier to find specific pigments that have transitions in this part of the THz region (above 1 THz). Therefore, it would be interesting to extend the present hyperspectral reflectometry systems toward THz frequencies. Such a system should include both a THz illumination system and a THz camera, to be coupled and assembled within the same mechanical system as the one used for IR reflectometry. The sensitivity of the THz cameras currently available on the market should be taken into account. Hence, a bolometric type camera should be the best option, due to its high sensitivity. In order to reduce the costs, it is possible to design the system in order to scan the sample by using the illumination system and to collect the radiation diffused by the sample by means of a point detector placed in the focus of a paraboloid. In a system of this particular kind, the source should be focused on the sample and the beam should raster-scan the sample surface. A “Proof of Concept” call for an industrial partnership has been recently proposed in order to check the possibility of designing and producing a prototype of a similar device.
Another possible application is related to water detection by means of the low frequency region of the THz spectrum. A system devoted to such a task does not need the phase sensitivity of the technique presented in this paper in order to detect water. Reflectivity of water, indeed, is obvious enough to make its detection easy, and it would be better to avoid the problem of phase variations coming from other sources (i.e., morphology of the sample, internal structure, etc.). A simple system, with a non-collinear geometry between the THz source and the detector, could then be designed. In that case, a paraboloid geometry for collecting diffused radiation would then be useful. Possible applications range from the detection of moss, lichen, and weed in art conservation to all of the industrial activities that require the determination of the hydration level of products.


 ,
, 


