Close Binaries and the Abundance Discrepancy Problem in Planetary Nebulae


1
Department of Physics and Astronomy, University College London, Gower St, London WC1E 6BT, UK
2
European Southern Observatory, Alonso de Córdova 3107, Casilla, Santiago 19001, Chile
3
Instituto de Astrofísica de Canarias, E-38205 La Laguna, Tenerife, Spain
4
Departamento de Astrofísica, Universidad de La Laguna, E-38206 La Laguna, Tenerife, Spain
5
European Southern Observatory, Karl-Schwarzschild-Str. 2, 85738 Garching bei München, Germany
6
Gran Telescopio Canarias S.A., c/ Cuesta de San José s/n, Breña Baja, E-38712 Santa Cruz de Tenerife, Spain
*
Author to whom correspondence should be addressed.
Galaxies 2018, 6(4), 110; https://doi.org/10.3390/galaxies6040110
Submission received: 27 July 2018
/
Revised: 12 October 2018
/
Accepted: 15 October 2018
/
Published: 19 October 2018
(This article belongs to the Special Issue Asymmetric Planetary Nebulae VII)
Abstract
:Motivated by the recent establishment of a connection between central star binarity and extreme abundance discrepancies in planetary nebulae, we have carried out a spectroscopic survey targeting planetary nebula with binary central stars and previously unmeasured recombination line abundances. We have discovered seven new extreme abundance discrepancies, confirming that binarity is key to understanding the abundance discrepancy problem. Analysis of all 15 objects with a binary central star and a measured abundance discrepancy suggests a cut-off period of about 1.15 days, below which extreme abundance discrepancies are found.
1. Introduction
Heavy element abundances in planetary nebulae (PNe) may be calculated from bright, easily-observed collisionally-excited lines (CELs; typical fluxes of 10–1000, where F(H) = 100) or from the much fainter recombination lines (RLs; typical fluxes of 0.01–1 on the same scale). For 70 years, it has been known that RL abundances exceed those from CELs, with the so-called abundance discrepancy factor (adf) ranging from 2–3 in the majority of cases, up to nearly three orders of magnitude in the most extreme cases (see, e.g., [1,2,3]). Many mechanisms have been proposed to account for the discrepancy. These include:
Abundance discrepancies in H ii regions behave quantitatively differently from those in PNe, suggesting that (at least) two mechanisms are responsible [9].
The work in [10] noted that in several cases, the most extreme values of the abundance discrepancy occurred in PNe known to have formed through the ejection of a common envelope (CE; [11,12]), having a binary central star with such a short period that the orbital radius is less than the radius of the PN’s Asymptotic Giant Branch (AGB) progenitor [13]. The work in [14] strengthened this connection by observing NGC 6778, known to have a binary central star with a period of 3.68 hours [15], and noted by [16] to show a very strong recombination line spectrum. New deep spectroscopic observations revealed an extreme abundance discrepancy as predicted from the binary nature of the central star, together with spatial patterns also seen in several other high-adf nebulae: the adf is not constant across the nebula, but rather strongly centrally peaked. In the case of NGC 6778, the value derived from the spatially-integrated spectrum is ∼18, while the spatially-resolved values peak at ∼40 close to the central star.
To investigate this connection further, we observed ∼40 PNe with known binary central stars, to measure their chemistry, predicting that we should find high abundance discrepancies in a significant fraction of them. The nebulae were observed in 2015–2016 using FORS2 at the VLT in Chile, with spectra covering wavelengths from 3600–9300 Å at a resolution of 1.5–3 Å.
2. Results
Spectra of sufficient depth to obtain recombination line abundances were obtained for eight objects in our sample. The observations of NGC 6778 were published in [14]. The seven additional objects included Hf 2-2, already known to have an extreme abundance discrepancy [2], which we included in our sample as a benchmark to verify our methodology (our results from the integrated spectrum are in good agreement with those of [2]) and to study spatially. Emission lines in the spectra were measured using the code alfa [17], which operates autonomously, first fitting and subtracting a continuum from each spectrum and then optimising Gaussian fits to emission lines using a genetic algorithm. The code detected ∼100 lines in each spectrum. These line fluxes were then analysed using neat [18], which also fully autonomously carries out an empirical analysis, calculating temperatures and densities from traditional CEL diagnostics, as well as from hydrogen continuum jumps, helium emission line ratios and oxygen recombination line ratios. The code then determines ionic abundances using a three-zone scheme and corrects for unseen ionisation stages using the scheme of [19].
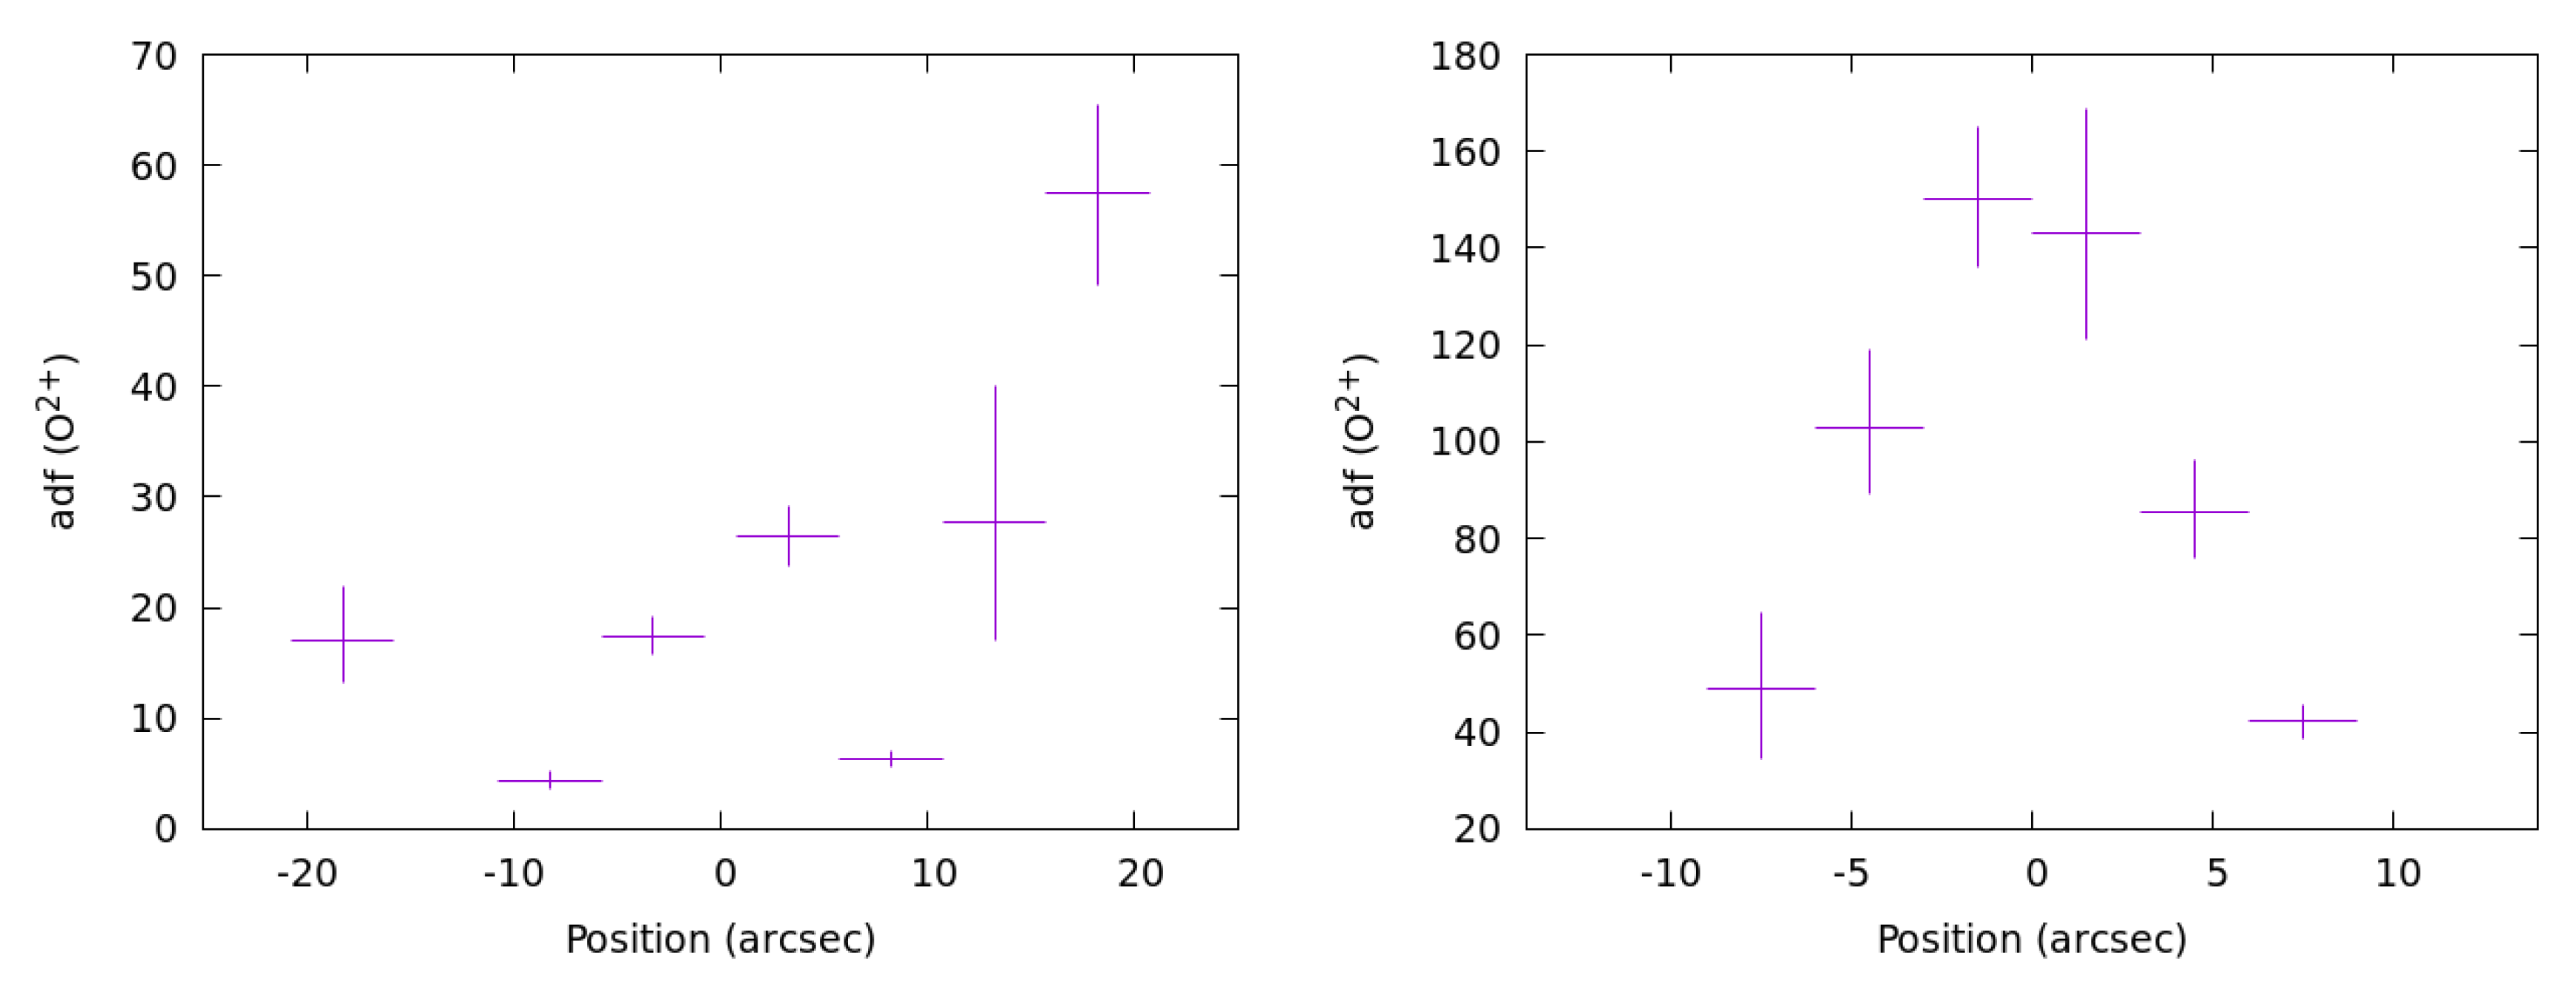
For four objects, their angular size and the depth of the spectra obtained permitted a spatially-resolved analysis. In these cases, we generally found that the adf was strongly centrally peaked; this was most clearly seen in Hf 2–2 and NGC 6326. In Fg 1, the adf showed central peaking, but the adf was also seen to be higher at the outer edge of the bright inner region of the nebula. NGC 6337 was thought to be a bipolar nebula viewed edge-on [20]; on-sky, it appears as a ring, and the highest values of the adf were seen at the inner edge of the ring. Figure 1 shows the variation of the adf along the slit for each of these objects.
3. Discussion
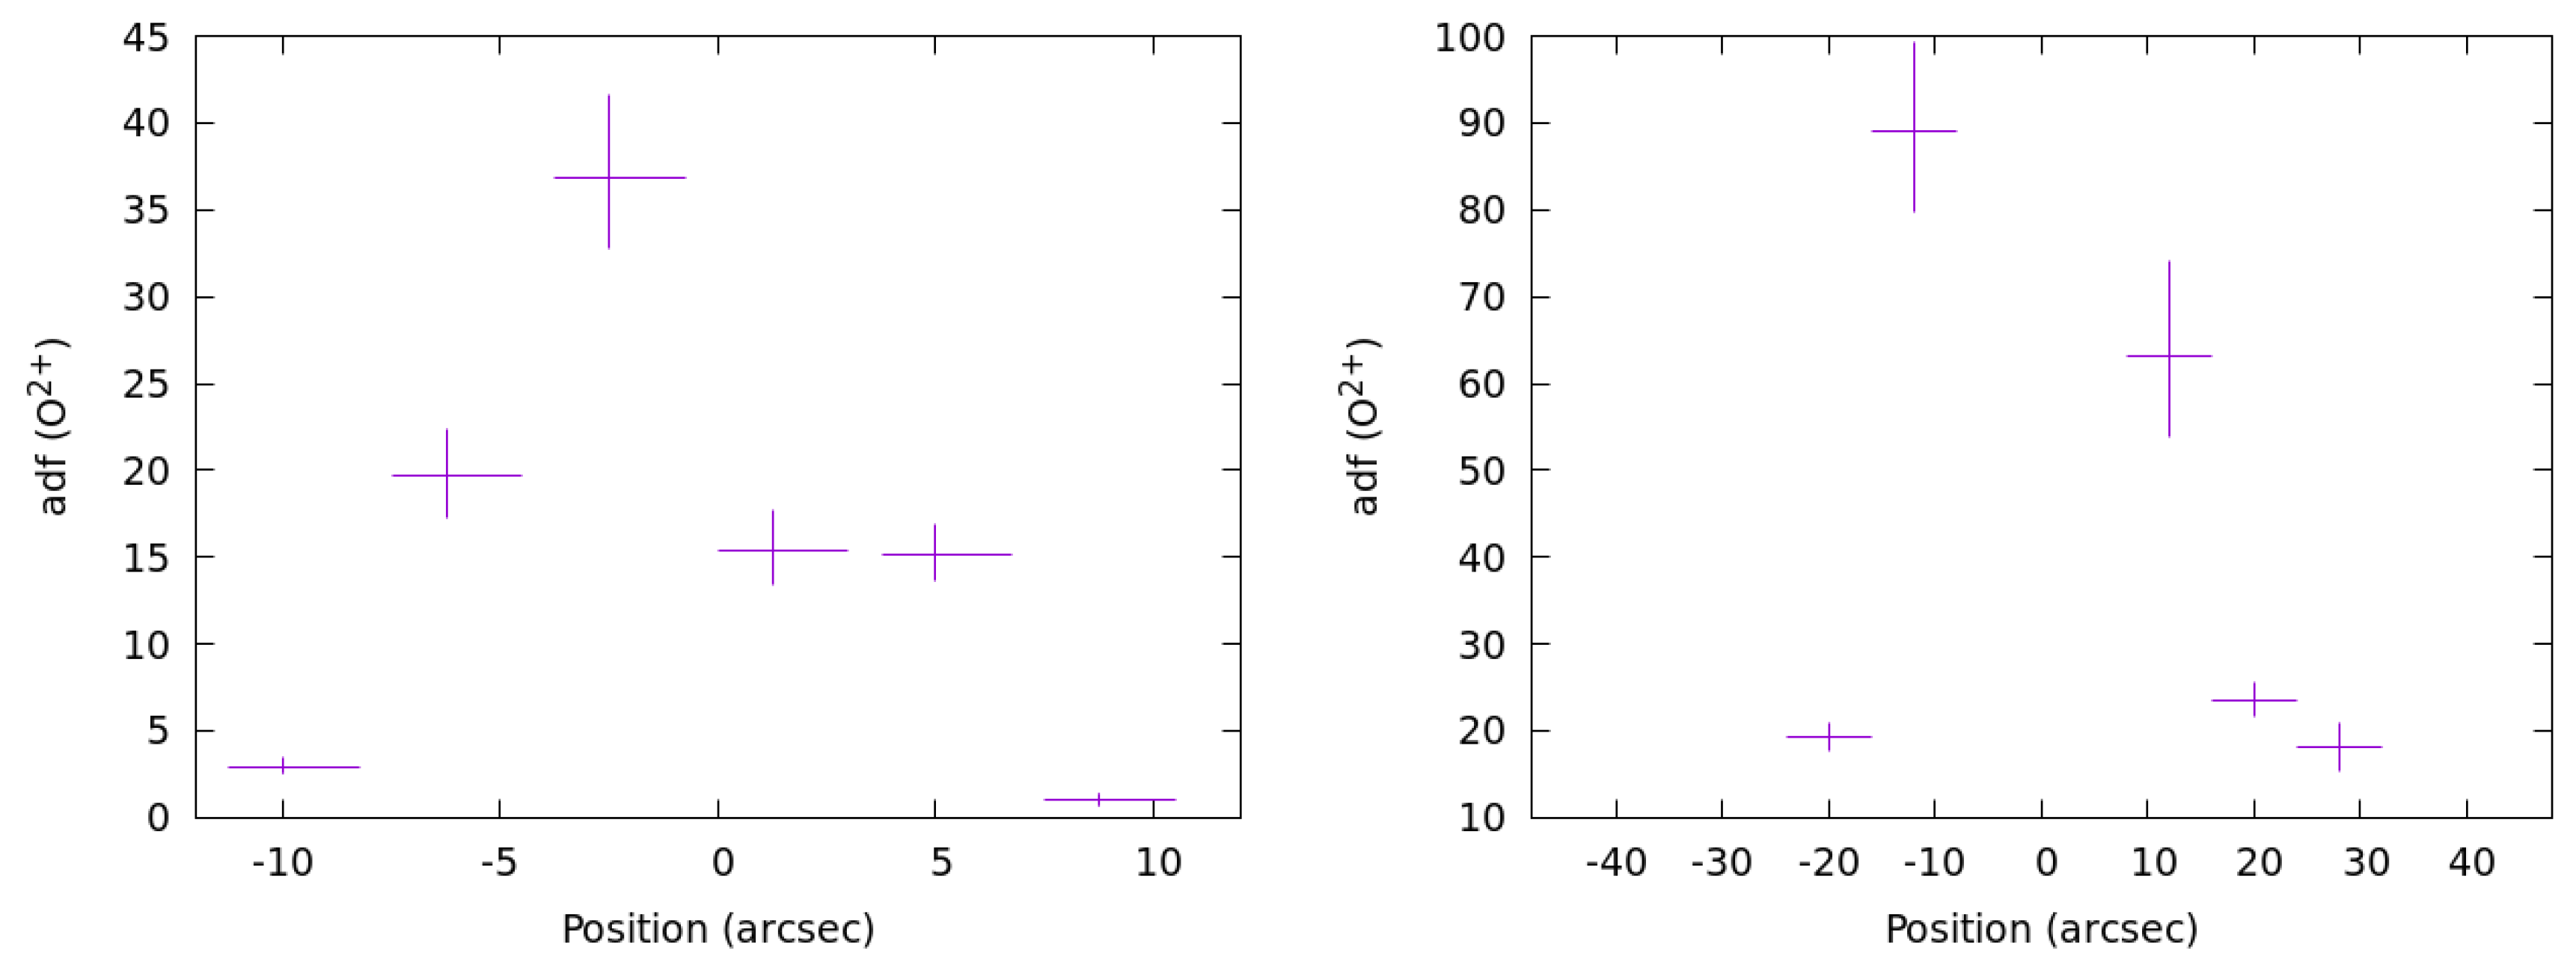
Figure 2 shows the measured adfs of 207 objects in rank order, with H ii regions highlighted in purple and PNe with close binary central stars shown in blue. This shows that the adfs of H ii regions are mostly lower than the median value of 2.3, while those of post-CE PNe are typically much higher. Henceforth, we refer to abundance discrepancy factors of less than 5 as “normal”, factors between 5 and 10 as “elevated” and those greater than 10 as “extreme”.
3.1. Relationship between adfs and Central Star Properties
3.1.1. The Binary Period
We have measured the abundance discrepancy for the first time in six post-common envelope PNe; the integrated spectra reveal five extreme and one elevated adf. Nine further post-CE nebulae with measured abundance discrepancy are found in the literature, of which two have normal adfs, two have elevated adfs and five have extreme adfs. Thus, the majority of post-CE nebulae have extreme abundance discrepancies, but a few have much lower values. In Table 1, we list some key observational parameters for all 15 objects.
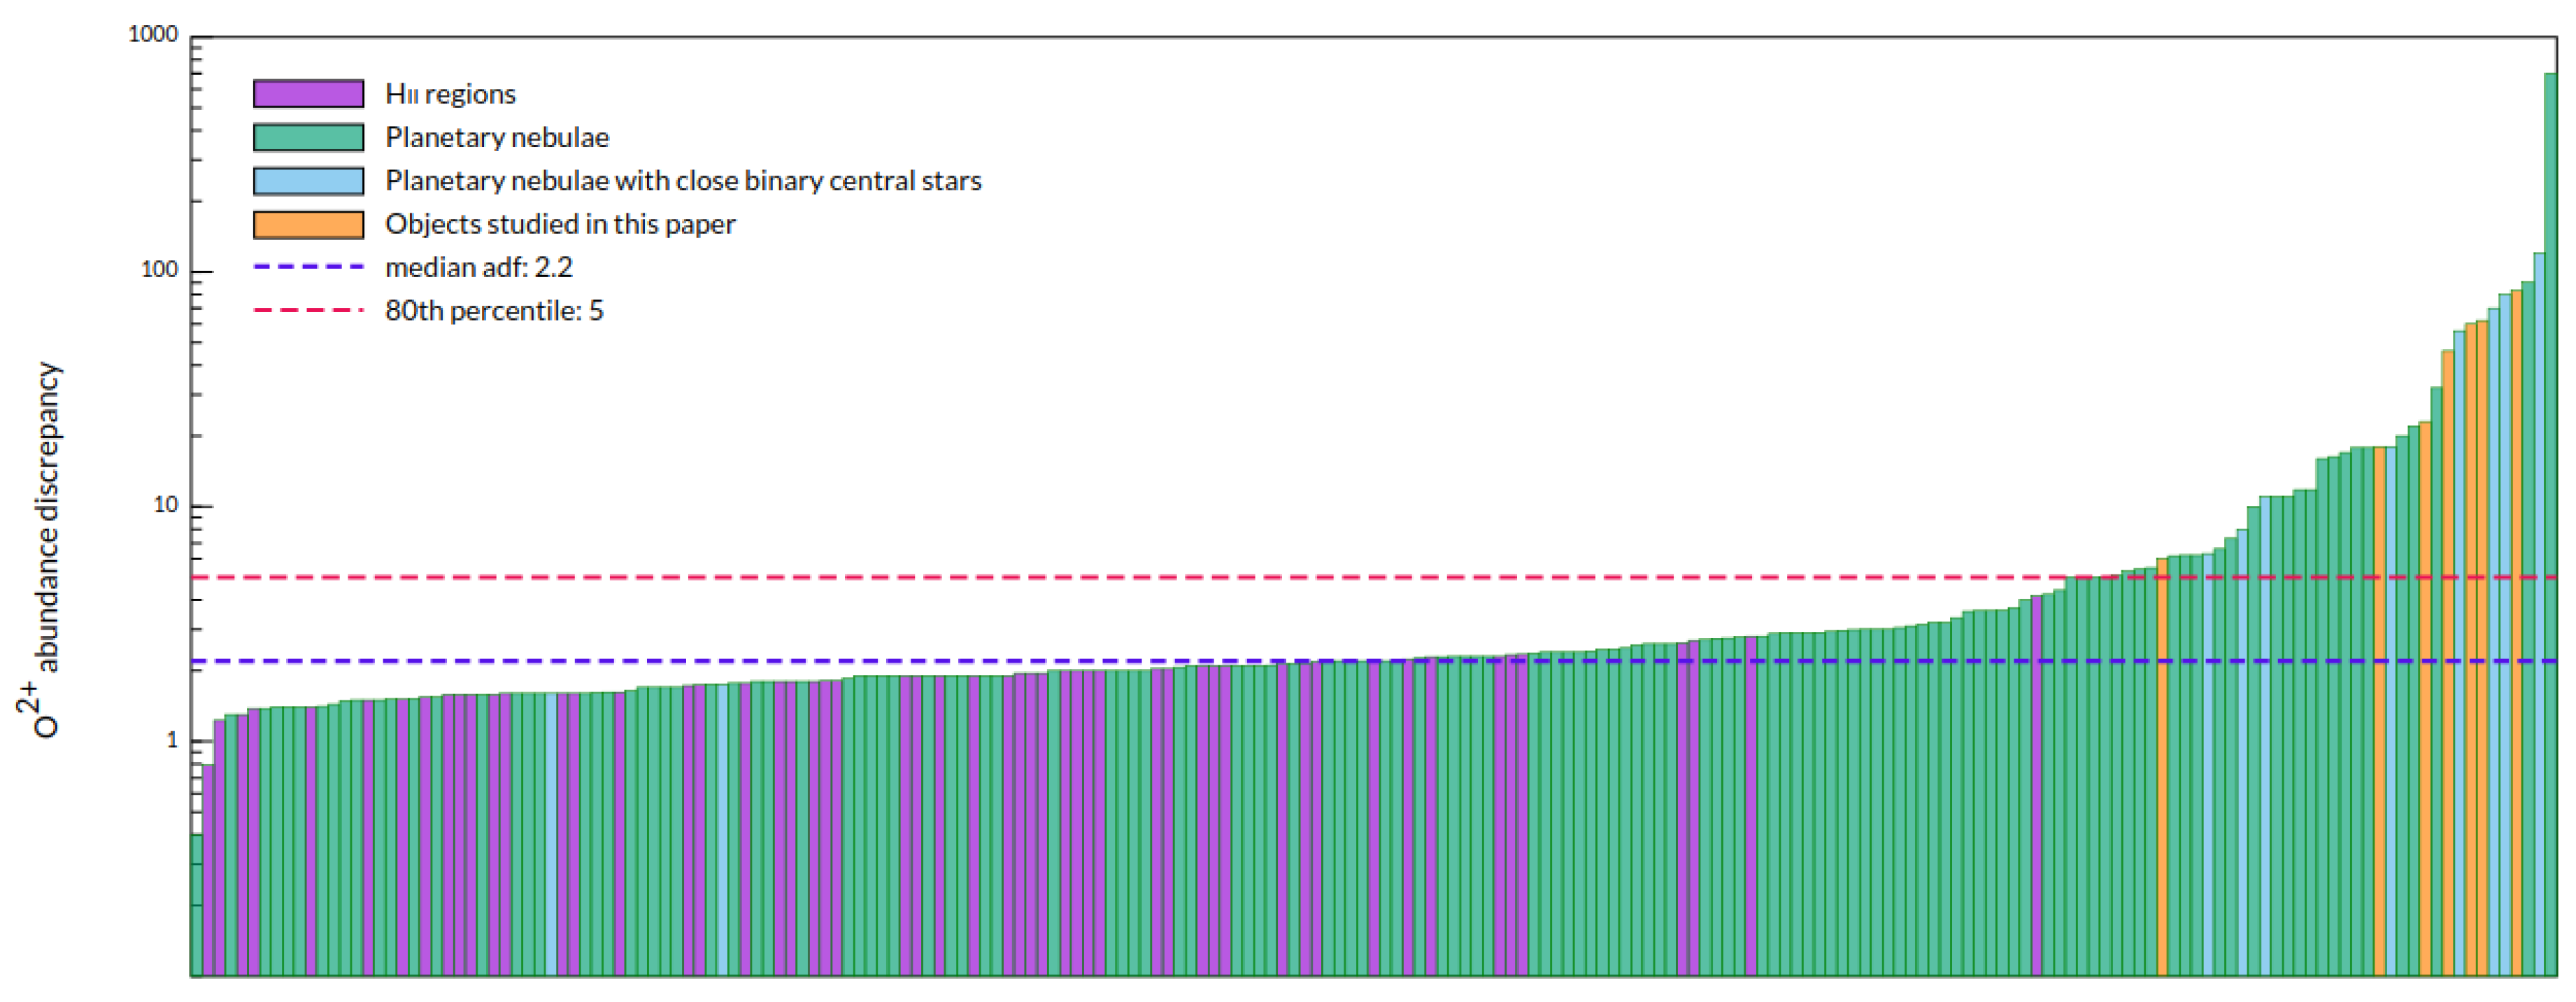
We searched for a relationship between the period of the binary central star and the abundance discrepancy. A continuous relationship would suggest that the mechanism giving rise to extreme adfs operates regardless of the binary period, but its magnitude is determined by it. On the other hand, if a threshold period can be identified that divides objects with elevated adfs from those with normal adfs, then it would imply that the mechanism is only triggered for shorter period binaries. Figure 3 shows the relation between the two properties, and although the number of points remains quite small, there is clearly no simple relationship between orbital period and adf. Instead, it suggests a threshold period, as three groups of objects can be identified: those with periods of less than one day all have elevated or extreme adfs; the objects with periods longer than 1.2 days have normal adfs; and the several objects with periods of around 1.15 days have a wide range of adfs, including Fg 1 with an adf of ∼46, Hen 2-283 with an adf of 5.1 and the Necklace, with no measured adf, but with no RLs detected in deep spectra by [25], and thus likely a normal value.
Detection biases mean that the observed period distribution of central star binaries is strongly concentrated to lower values, and thus, objects with periods of days rather than hours are quite rare [13]. The absence of high-adf objects with longer periods could arise by chance, given that only two longer period objects appear in our sample of 15 objects. However, the likelihood of the two longest period binaries having the two lowest adfs by chance alone if the two properties were uncorrelated is just under 1%. A likely third such object is MyCn 18, for which [26] recently reported a binary period of 18.15 days, while [27] measured an adf of 1.8. The probability of the three lowest adfs coinciding with the three longest periods by chance is much less than 1% and strengthens the hypothesis that only when the binary period is shorter than a threshold value of around 1.15 days will the PN exhibit an elevated or extreme adf. Further measurements of adf in objects with known binary orbital period are of course still necessary to better constrain this proposed relationship.
3.1.2. Stellar Abundances
The work in [28] suggested that there might be a relation between central star abundances and nebular abundance discrepancies, based on their discovery of the extreme abundance discrepancy of NGC 1501, which has a hydrogen-deficient central star, in common with several other then-recently identified extreme adf objects. However, they also noted that several extreme adf objects with H-rich central stars were known, concluding that no clear relationship existed. The work in [24] measured the adf in several objects with known H-deficient central stars, and did not find any elevated or extreme abundance discrepancies.
Given that extreme adfs can be reproduced by invoking cold hydrogen-deficient clumps embedded in a hot gas of normal composition, a source for these clumps needs to be identified. Two possibilities have been discussed; firstly, a very late thermal pulse (VLTP), in which a single star experiences a thermal pulse after having begun its descent of the white dwarf cooling track [29]; the second scenario is a nova-like eruption relying on a binary central star. Additional and more complex scenarios are possible: ref. [30] suggested that some combination of VLTP and nova in which the former triggered the latter could explain the properties of the hydrogen-deficient knot in Abell 58. Given the lack of observational constraints on such scenarios, we consider only these two relatively simple cases. The two scenarios make contrasting predictions for the central star abundances. The VLTP scenario would result in a hydrogen-deficient central star, and indeed, that scenario is commonly invoked specifically as a mechanism for creating such stars. Meanwhile, the nova-like scenario is as yet ill-defined. An eruption in which some hydrogen is neither burned nor ejected would be required to leave behind a hydrogen-rich post-nova object.
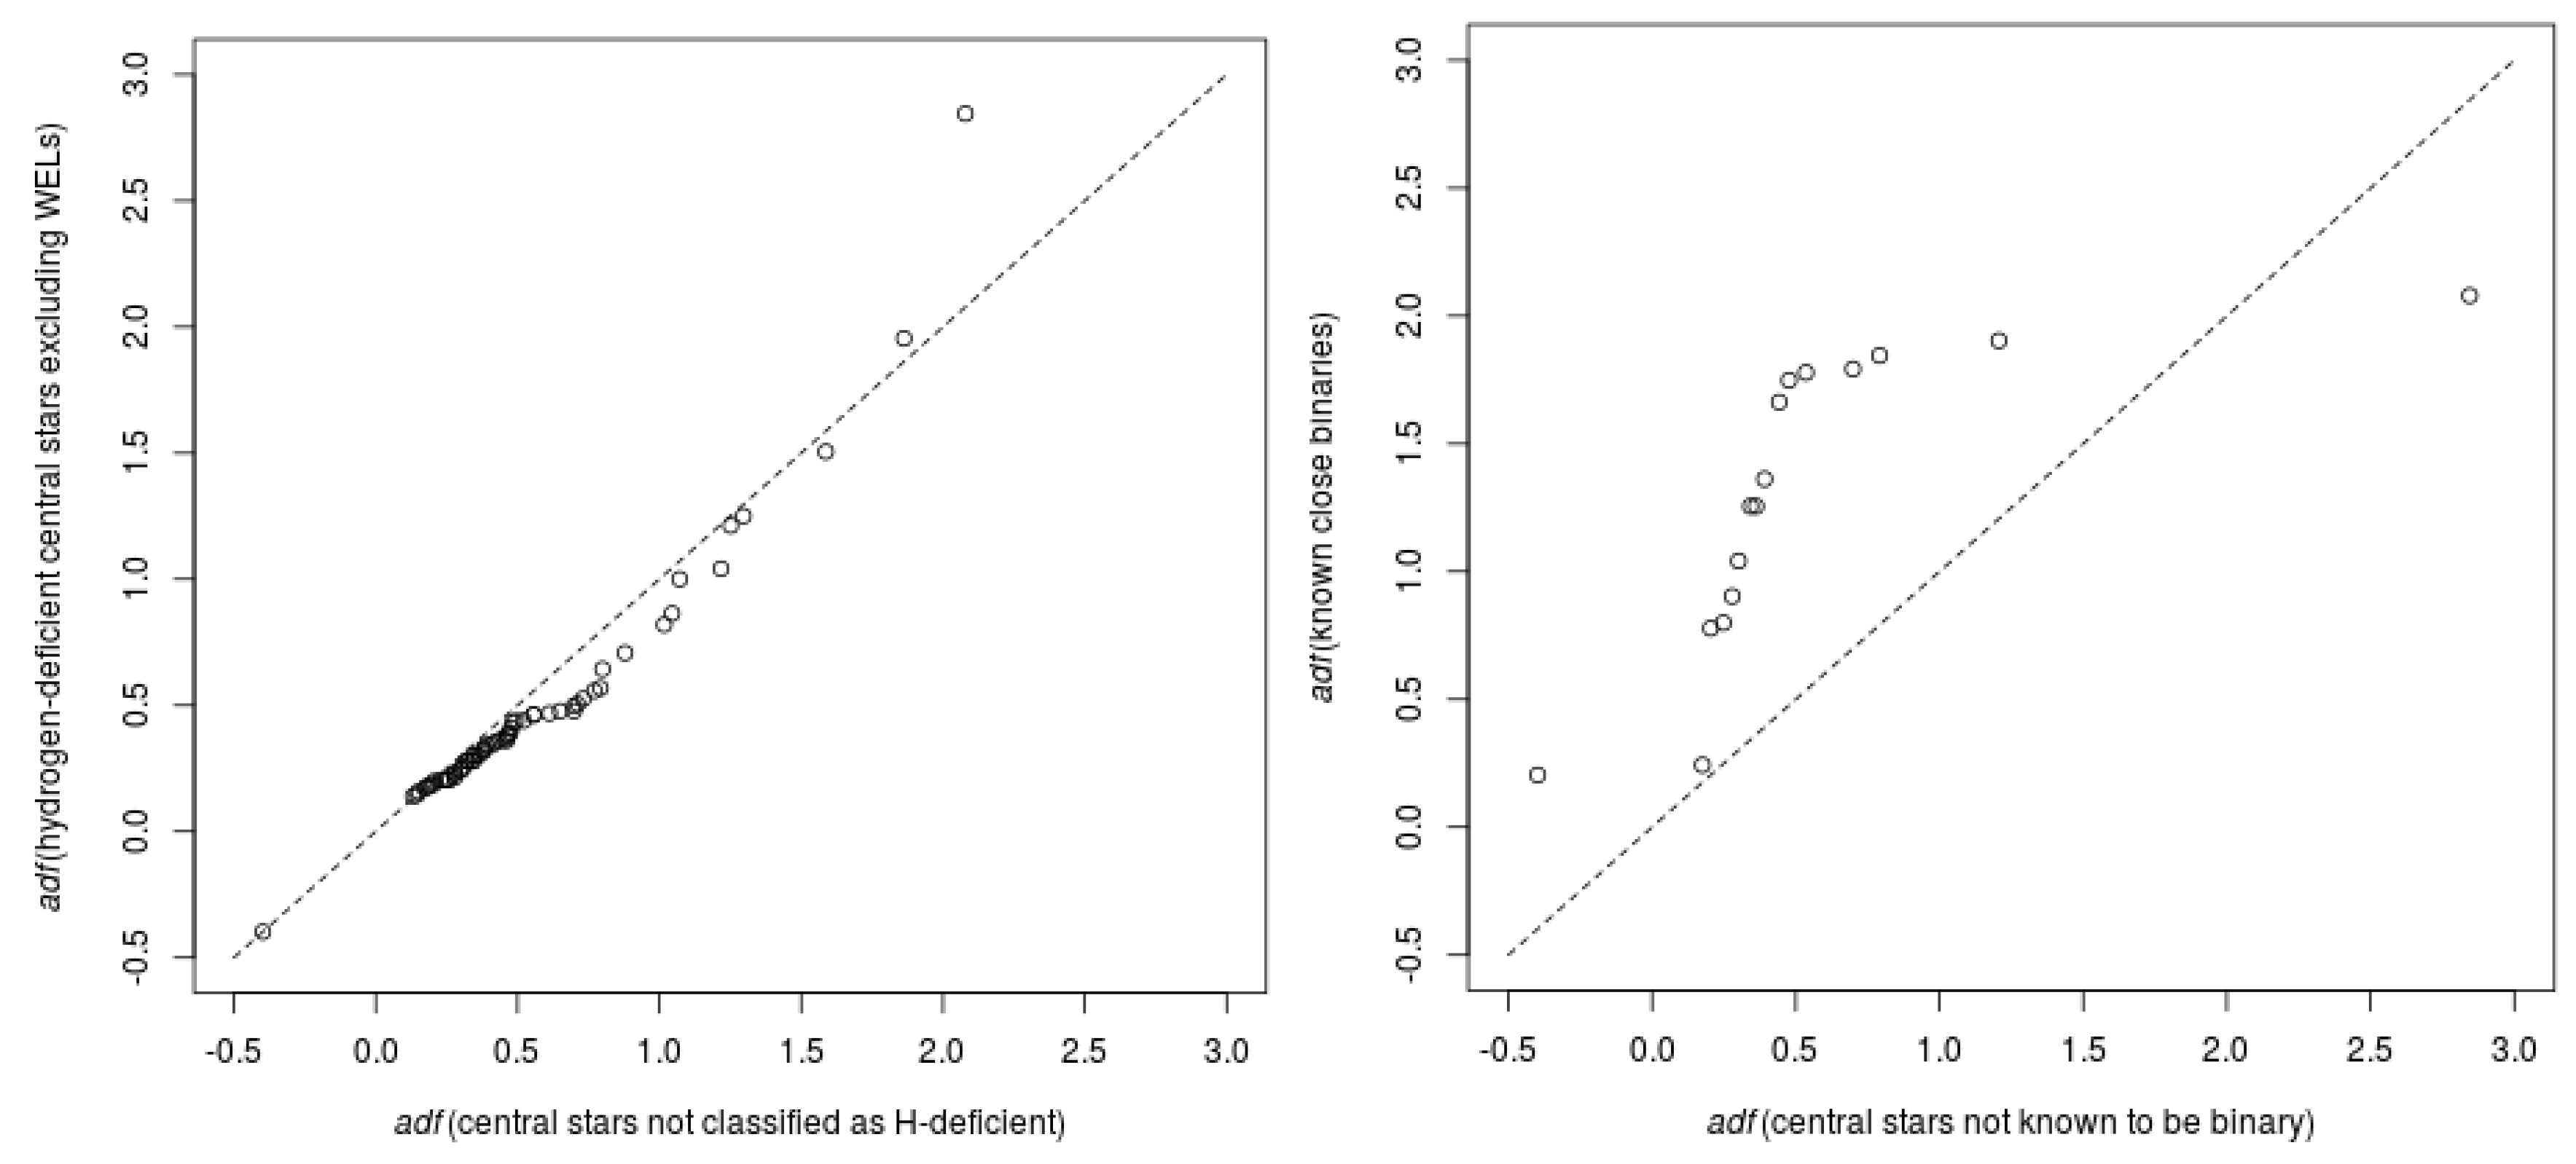
We compiled all available literature central star classifications, to compare adfs of nebulae with H-deficient central stars to those of nebulae with H-rich central stars (excluding nebulae with weak emission line stars (wels), which have a high likelihood of being due to either nebular contamination [31] or irradiation of the secondary [15]). The left-hand panel of Figure 4 shows a quantile-quantile (Q-Q) plot comparing the quantiles of the distributions of adfs, for nebulae with H-deficient central stars and those without. In such a plot, for two different datasets, if the two sets are drawn from the same underlying probability distribution, the points will lie close to the line of . Populations drawn from differing probability distributions will diverge from the 1:1 relation. In this case, the points indeed mostly lie close to . In the right-hand panel of the figure, we show the Q-Q plot for PNe with binary central stars against those without a known binary central star. The large deviations from the line indicate that the adfs of nebulae with binary central stars come from a strongly differing distribution to those without. This argues against a VLTP as the source of hydrogen-deficient material, while a nova-like outburst remains plausible.
3.2. Relationship of adfs with Nebular Properties
Electron Density
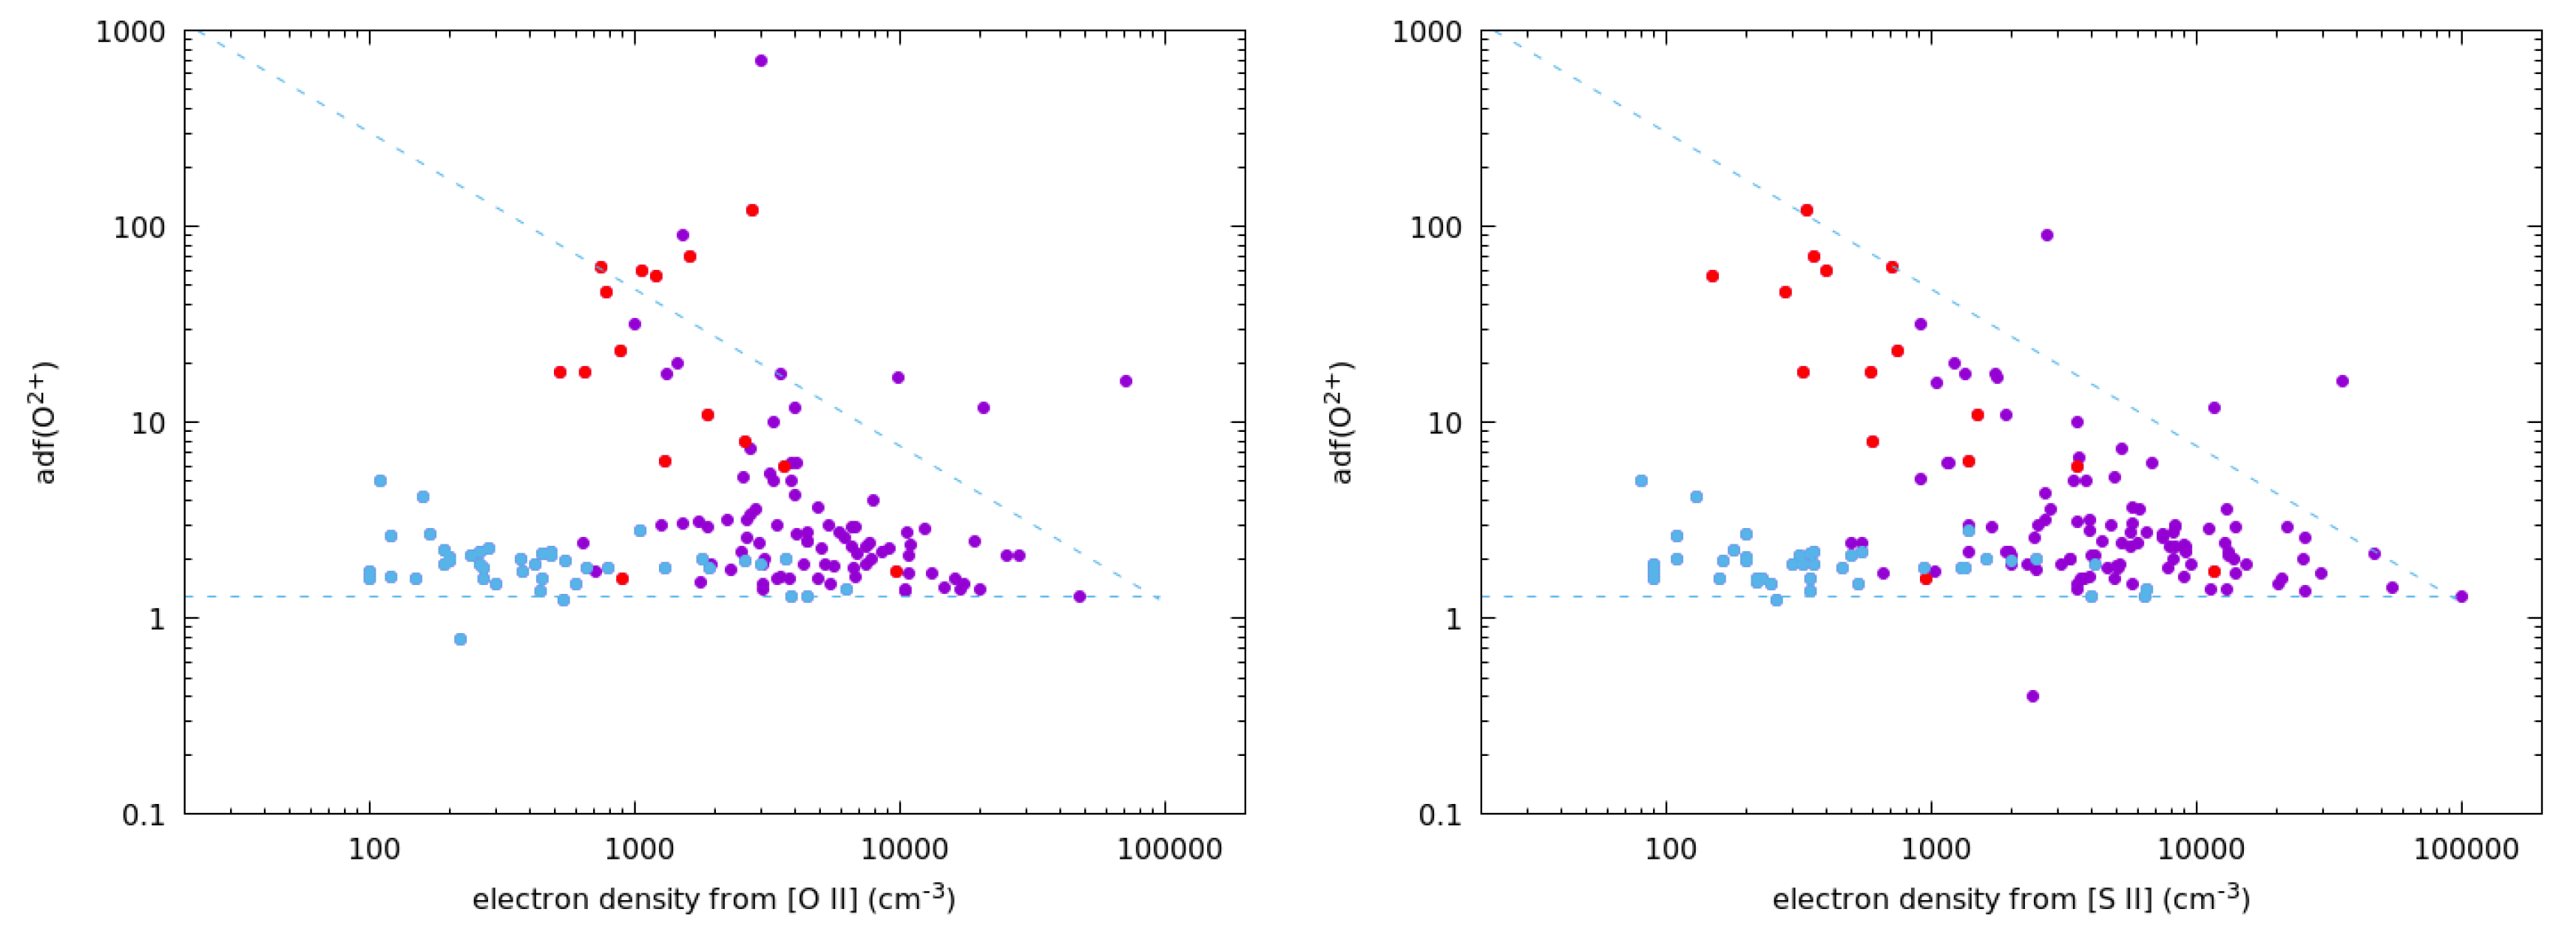
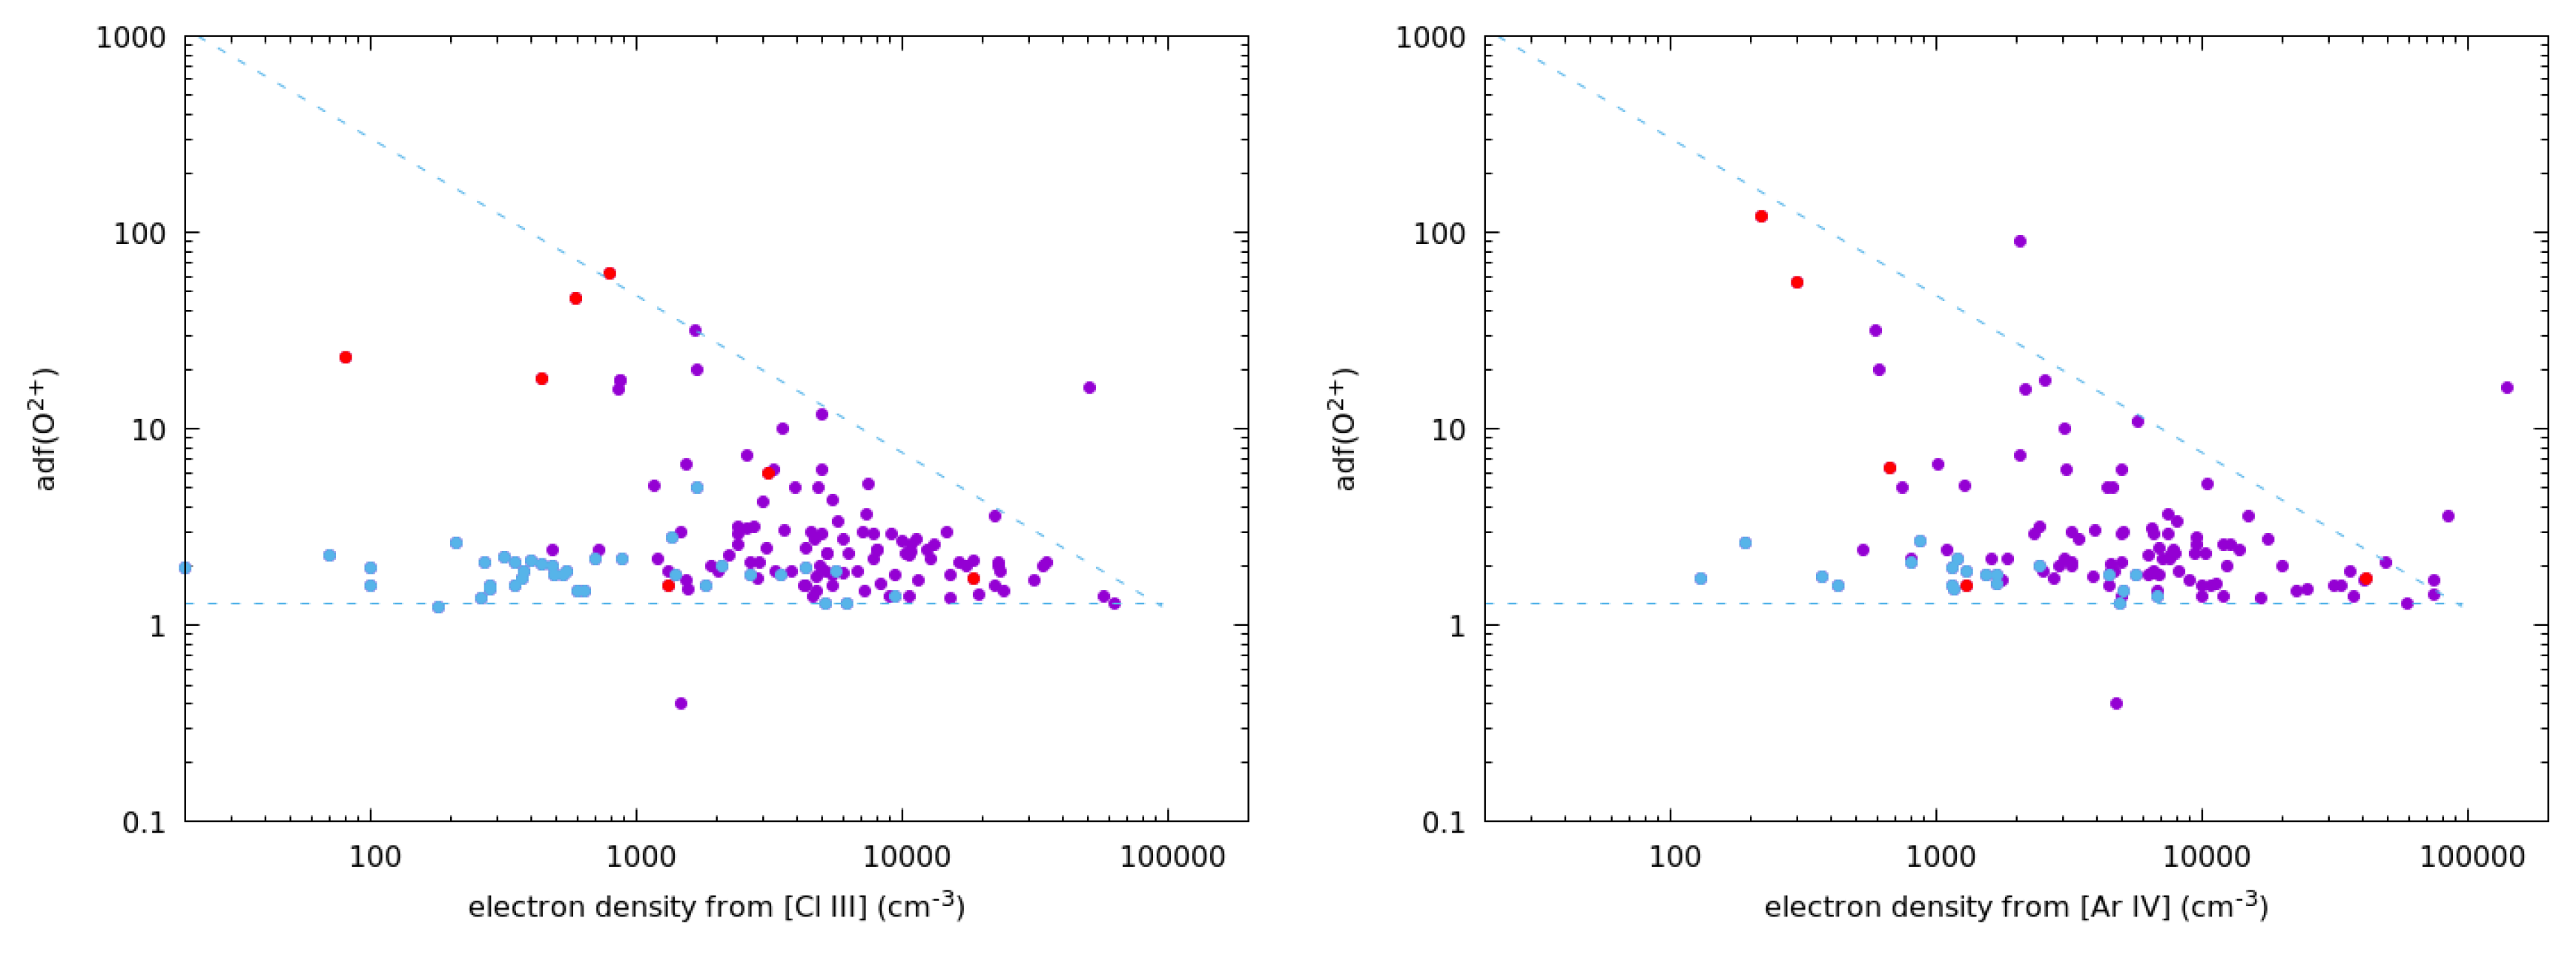
As well as the proposed cut-off period of around 1.15 days separating elevated and extreme adf objects from normal adf objects, we have identified a relation between electron density and adf. In the seven objects studied in this work, all except Hen 2-283 have extreme abundance discrepancies, and while Hen 2-283 has an electron density of ∼3200 cm, the other objects all have densities of <1000 cm. To investigate this further, we compiled literature measurements of the electron density from lines of [O ii], [S ii], [Cl iii] and [Ar iv], for all objects with a measured adf. Figure 5 shows the adf against electron density for each of the four diagnostics. These figures clearly show that the highest adfs only occur in the lowest density objects. Dashed lines indicate two bounds inside which almost all objects lie: a lower limit of adf = 1.3 and an upper limit of adf 10 n. The low densities associated with extreme adfs point to a low ionised mass, as found by [10] for the extreme-adf objects Ou 5 and Abell 48, and consistent also with the finding by [32] that post-CE nebulae have systematically lower ionised masses and surface brightnesses compared to the overall PN population.
4. Conclusions
The relationships between central star binarity, nebular density and adf show that common envelope evolution and nebular chemistry are strongly connected. We conclude that adfs provide a reliable way to infer the presence of a close binary central star; any object with an extreme adf must host a very short period binary. These objects will tend to have electron densities of ≪1000 cm. Meanwhile, if an object has a low adf, but a morphology indicative of binarity, we would predict that its binary period should be much longer than one day. One possible mechanism that could account for these observations is if the shortest period post-CE binaries experience fallback following the ejection of the common envelope, triggering an outburst of enriched material, which gives rise to extreme adfs. The implications of our results are discussed in greater detail in [33].
Author Contributions
R.W. led the analysis of the data, obtained through proposals for which D.J. was the Principal Investigator. All authors contributed to the interpretation of the results and the discussion.
Funding
This research received no external funding.
Acknowledgments
We are grateful to both referees for their careful reviews and helpful suggestions. R.W. was supported by European Research Grant SNDUST 694520. J.G.-R. acknowledges support from an Advanced Fellowship from the Severo Ochoa excellence program (SEV-2015-0548). We thank the organisers and participants of the APN7conference for a highly productive week of science and progress.
Conflicts of Interest
The authors declare no conflict of interest.
References
- Wyse, A.B. The Spectra of Ten Gaseous Nebulae. Astrophys. J. 1942, 95, 356. [Google Scholar] [CrossRef]
- Liu, X.W.; Storey, P.J.; Barlow, M.J.; Danziger, I.J.; Cohen, M.; Bryce, M. NGC 6153: A super-metal-rich planetary nebula? Mon. Not. R. Astron. Soc. 2000, 312, 585–628. [Google Scholar] [CrossRef]
- Peimbert, M.; Peimbert, A.; Delgado-Inglada, G. Nebular Spectroscopy: A Guide on Hii Regions and Planetary Nebulae. Publ. Astron. Soc. Pac. 2017, 129, 082001. [Google Scholar] [CrossRef]
- Peimbert, M. Temperature Determinations of H II Regions. Astrophys. J. 1967, 150, 825. [Google Scholar] [CrossRef]
- Torres-Peimbert, S.; Peimbert, M.; Pena, M. Planetary nebulae with a high degree of ionization—NGC 2242 and NGC 4361. Astron. Astrophys. 1990, 233, 540–552. [Google Scholar]
- Viegas, S.M.; Clegg, R.E.S. Density Condensations in Planetary Nebulae and the Electron Temperature. Mon. Not. R. Astron. Soc. 1994, 271, 993. [Google Scholar] [CrossRef]
- Ercolano, B. Can X-rays provide a solution to the abundance discrepancy problem in photoionized nebulae? Mon. Not. R. Astron. Soc. 2009, 397, L69–L73. [Google Scholar] [CrossRef]
- Nicholls, D.C.; Dopita, M.A.; Sutherland, R.S. Resolving the Electron Temperature Discrepancies in H II Regions and Planetary Nebulae: κ-distributed Electrons. Astrophys. J. 2012, 752, 148. [Google Scholar] [CrossRef]
- García-Rojas, J.; Esteban, C. On the Abundance Discrepancy Problem in H II Regions. Astrophys. J. 2007, 670, 457–470. [Google Scholar] [CrossRef]
- Corradi, R.L.M.; García-Rojas, J.; Jones, D.; Rodríguez-Gil, P. Binarity and the Abundance Discrepancy Problem in Planetary Nebulae. Astrophys. J. 2015, 803, 99. [Google Scholar] [CrossRef]
- Paczynski, B. Common Envelope Binaries. In Structure and Evolution of Close Binary Systems; Eggleton, P., Mitton, S., Whelan, J., Eds.; Cambridge University Press: Cambridge, UK, 1976; Volume 73, p. 75. [Google Scholar]
- Ivanova, N.; Justham, S.; Chen, X.; De Marco, O.; Fryer, C.L.; Gaburov, E.; Ge, H.; Glebbeek, E.; Han, Z.; Li, X.D.; et al. Common envelope evolution: Where we stand and how we can move forward. Astronomy Astrophys. Rev. 2013, 21, 59. [Google Scholar] [CrossRef] [Green Version]
- Jones, D.; Boffin, H.M.J. Binary stars as the key to understanding planetary nebulae. Nat. Astronomy 2017, 1, 0117. [Google Scholar] [CrossRef] [Green Version]
- Jones, D.; Wesson, R.; García-Rojas, J.; Corradi, R.L.M.; Boffin, H.M.J. NGC 6778: Strengthening the link between extreme abundance discrepancy factors and central star binarity in planetary nebulae. Mon. Not. R. Astron. Soc. 2016, 455, 3263–3272. [Google Scholar] [CrossRef]
- Miszalski, B.; Jones, D.; Rodríguez-Gil, P.; Boffin, H.M.J.; Corradi, R.L.M.; Santander-García, M. Discovery of close binary central stars in the planetary nebulae NGC 6326 and NGC 6778. Astron. Astrophys. 2011, 531, A158. [Google Scholar] [CrossRef]
- Czyzak, S.J.; Aller, L.H. Spectrophotometric studies of nebulae. XXI. The remarkable planetary NGC 6778. Astrophys. J. 1973, 181, 817–823. [Google Scholar] [CrossRef]
- Wesson, R. ALFA: An automated line fitting algorithm. Mon. Not. R. Astron. Soc. 2016, 456, 3774–3781. [Google Scholar] [CrossRef]
- Wesson, R.; Stock, D.J.; Scicluna, P. Understanding and reducing statistical uncertainties in nebular abundance determinations. Mon. Not. R. Astron. Soc. 2012, 422, 3516–3526. [Google Scholar] [CrossRef] [Green Version]
- Delgado-Inglada, G.; Morisset, C.; Stasińska, G. Ionization correction factors for planetary nebulae—I. Using optical spectra. Mon. Not. R. Astron. Soc. 2014, 440, 536–554. [Google Scholar] [CrossRef]
- García-Díaz, M.T.; Clark, D.M.; López, J.A.; Steffen, W.; Richer, M.G. The Outflows and Three-Dimensional Structure of NGC 6337: A Planetary Nebula with a Close Binary Nucleus. Astrophys. J. 2009, 699, 1633–1638. [Google Scholar] [CrossRef]
- Jones, D.; Boffin, H.M.J.; Rodríguez-Gil, P.; Wesson, R.; Corradi, R.L.M.; Miszalski, B.; Mohamed, S. The post-common envelope central stars of the planetary nebulae Henize 2-155 and Henize 2-161. Astron. Astrophys. 2015, 580, A19. [Google Scholar] [CrossRef]
- Liu, M.C.; Leggett, S.K.; Golimowski, D.A.; Chiu, K.; Fan, X.; Geballe, T.R.; Schneider, D.P.; Brinkmann, J. SDSS J1534+1615AB: A Novel T Dwarf Binary Found with Keck Laser Guide Star Adaptive Optics and the Potential Role of Binarity in the L/T Transition. Astrophys. J. 2006, 647, 1393–1404. [Google Scholar] [CrossRef] [Green Version]
- Sowicka, P.; Jones, D.; Corradi, R.L.M.; Wesson, R.; García-Rojas, J.; Santander-García, M.; Boffin, H.M.J.; Rodríguez-Gil, P. The planetary nebula IC 4776 and its post-common-envelope binary central star. Mon. Not. R. Astron. Soc. 2017, 471, 3529–3546. [Google Scholar] [CrossRef] [Green Version]
- García-Rojas, J.; Peña, M.; Morisset, C.; Delgado-Inglada, G.; Mesa-Delgado, A.; Ruiz, M.T. Analysis of chemical abundances in planetary nebulae with [WC] central stars. II. Chemical abundances and the abundance discrepancy factor. Astron. Astrophys. 2013, 558, A122. [Google Scholar] [CrossRef]
- Corradi, R.L.M.; Sabin, L.; Miszalski, B.; Rodríguez-Gil, P.; Santander-García, M.; Jones, D.; Drew, J.E.; Mampaso, A.; Barlow, M.J.; Rubio-Díez, M.M.; et al. The Necklace planetary nebula: Equatorial and polar outflows from a post-common-envelope system. In Proceedings of the Asymmetric Planetary Nebulae 5 Conference, Bowness-on-Windermere, UK, 20–25 June 2010. [Google Scholar]
- Miszalski, B.; Manick, R.; Mikołajewska, J.; Van Winckel, H.; Iłkiewicz, K. SALT HRS Discovery of the Binary Nucleus of the Etched Hourglass Nebula MyCn 18. arXiv 2018, arXiv:1805.0760235, arXiv:1805–07602. [Google Scholar] [CrossRef]
- Tsamis, Y.G.; Barlow, M.J.; Liu, X.W.; Storey, P.J.; Danziger, I.J. A deep survey of heavy element lines in planetary nebulae—II. Recombination-line abundances and evidence for cold plasma. Mon. Not. R. Astron. Soc. 2004, 353, 953–979. [Google Scholar] [CrossRef]
- Ercolano, B.; Wesson, R.; Zhang, Y.; Barlow, M.J.; De Marco, O.; Rauch, T.; Liu, X.W. Observations and three-dimensional photoionization modelling of the Wolf-Rayet planetary nebula NGC 1501. Mon. Not. R. Astron. Soc. 2004, 354, 558–574. [Google Scholar] [CrossRef] [Green Version]
- Iben, I., Jr.; Renzini, A. Asymptotic giant branch evolution and beyond. Ann. Rev. Astronomy Astrophys. 1983, 21, 271–342. [Google Scholar] [CrossRef]
- Lau, H.H.B.; De Marco, O.; Liu, X.W. V605 Aquilae: A born-again star, a nova or both? Mon. Not. R. Astron. Soc. 2011, 410, 1870–1876. [Google Scholar] [CrossRef]
- Basurah, H.M.; Ali, A.; Dopita, M.A.; Alsulami, R.; Amer, M.A.; Alruhaili, A. Problems for the WELS classification of planetary nebula central stars: Self-consistent nebular modelling of four candidates. Mon. Not. R. Astron. Soc. 2016, 458, 2694–2709. [Google Scholar] [CrossRef]
- Frew, D.J.; Parker, Q.A.; Bojičić, I.S. The Hα surface brightness-radius relation: A robust statistical distance indicator for planetary nebulae. Mon. Not. R. Astron. Soc. 2016, 455, 1459–1488. [Google Scholar] [CrossRef]
- Wesson, R.; Jones, D.; García-Rojas, J.; Boffin, H.M.J.; Corradi, R.L.M. Confirmation of the link between central star binarity and extreme abundance discrepancy factors in planetary nebulae. Mon. Not. R. Astron. Soc. 2018, 480, 4589–4613. [Google Scholar] [CrossRef]
Figure 1.
Spatially-resolved analyses of Fg 1 (top left), Hf 2-2 (top right), NGC 6326 (bottom left) and NGC 6337 (bottom right), showing the variation with slit position of the abundance discrepancy factor (adf(O)).
Figure 1.
Spatially-resolved analyses of Fg 1 (top left), Hf 2-2 (top right), NGC 6326 (bottom left) and NGC 6337 (bottom right), showing the variation with slit position of the abundance discrepancy factor (adf(O)).


Figure 2.
Two hundred and seven measurements of adf(O) available in the literature as of September 2018, including the new measurements presented in this paper, shown in rank order. Objects with close binary central stars are highlighted in blue, H ii regions in purple and the objects studied in the current work in orange. A full list of the individual objects and references used to compile this figure is available at https://www.nebulousresearch.org/adfs.

Figure 3.
Abundance discrepancy for O plotted against binary period for the 15 objects where both are known: nine literature values (purple dots) and seven from this study (red squares). Also plotted is a point for the Necklace, which has a period of 1.16 days and an unmeasured abundance discrepancy, but with an upper limit reported to be low and plotted here as a factor of 3.0. A horizontal line indicates an adf of 5.0, which we consider the dividing line between “normal” and “elevated”, and a vertical line indicates the period of 1.15 days, which roughly divides objects with low and extreme adfs.

Figure 4.
Q-Q plots for adf for (l) nebulae with hydrogen-deficient central stars against those without; (r) nebulae with close binary central stars against those without. When samples are drawn from the same underlying distribution, points in a Q-Q plot will lie close to .
Figure 4.
Q-Q plots for adf for (l) nebulae with hydrogen-deficient central stars against those without; (r) nebulae with close binary central stars against those without. When samples are drawn from the same underlying distribution, points in a Q-Q plot will lie close to .

Figure 5.
adf against electron density estimated from [O ii] (top left), [S ii] (top right), [Cl iii] (bottom left) and [Ar iv] (bottom right) line ratios. Planetary nebulae with binary central stars are shown with red points; other PNe are shown with purple points; and H ii regions are shown with light blue points. Dashed lines indicate the empirical limits inside which almost all objects are found (see the text for details).


Table 1.
Properties of the 15 nebulae with close binary central stars and a measured adf.
| Object | adf | Period (days) | N/H | O/H | Electron Density (cm) | Reference |
|---|---|---|---|---|---|---|
| A 46 | 120 | 0.47 | 6.77 | 7.93 | 1590 | [10] |
| A 63 | 8 | 0.46 | 7.46 | 8.59 | 1560 | [10] |
| Fg 1 | 46 | 1.2 | 7.84 | 8.26 | 500 | this work |
| Hen 2-283 | 5.1 ± 0.5 | 1.15 | 8.56 | 8.75 | 3200 | this work |
| Hen 2-155 | 6.3 | 0.148 | 7.85 | 8.21 | 1300 | [21] |
| Hen 2-161 | 11 | 1.01? | 8.06 | 8.34 | 1600 | [21] |
| Hf 2-2 | 83 ± 15 | 0.4 | 7.60 | 7.92 | 700 | [22]; this work |
| IC 4776 | 1.75 | 9 | 7.80 | 8.57 | ∼20,000 | [23] |
| MPA 1759 | 62 ± 8 | 0.5 | 7.52 | 8.25 | 740 | this work |
| NGC 5189 | 1.6 | 4.04 | 8.60 | 8.77 | 1000 | [24] |
| NGC 6326 | 23 ± 3 | 0.37 | 7.10 | 7.43 | 820 | this work |
| NGC 6337 | 18 ± 2 | 0.173 | 8.31 | 8.40 | 500 | this work |
| NGC 6778 | 18 | 0.153 | 8.61 | 8.45 | 600 | [14] |
| Pe 1-9 | 60 ± 10 | 0.140 | 7.85 | 7.98 | 740 | this work |
| Ou 5 | 56 | 0.36 | 7.58 | 8.40 | 560 | [10] |
© 2018 by the authors. Licensee MDPI, Basel, Switzerland. This article is an open access article distributed under the terms and conditions of the Creative Commons Attribution (CC BY) license (http://creativecommons.org/licenses/by/4.0/).
Share and Cite
MDPI and ACS Style
Wesson, R.; Jones, D.; García-Rojas, J.; Boffin, H.M.J.; Corradi, R.L.M. Close Binaries and the Abundance Discrepancy Problem in Planetary Nebulae. Galaxies 2018, 6, 110. https://doi.org/10.3390/galaxies6040110
AMA Style
Wesson R, Jones D, García-Rojas J, Boffin HMJ, Corradi RLM. Close Binaries and the Abundance Discrepancy Problem in Planetary Nebulae. Galaxies. 2018; 6(4):110. https://doi.org/10.3390/galaxies6040110
Chicago/Turabian StyleWesson, R., D. Jones, J. García-Rojas, H. M. J. Boffin, and R. L. M. Corradi. 2018. "Close Binaries and the Abundance Discrepancy Problem in Planetary Nebulae" Galaxies 6, no. 4: 110. https://doi.org/10.3390/galaxies6040110
Note that from the first issue of 2016, this journal uses article numbers instead of page numbers. See further details here.