Article

Experimental Investigation on the Pressure Drop of Air Flows Through Aluminum and Nickel-Chromium Metallic Foams for HVAC Applications

1
CIRI-EC, Alma Mater Studiorum Università di Bologna, Via del Lazzaretto 15, 40136 Bologna, Italy
2
Dipartimento di Ingegneria Industriale (DIN), Alma Mater Studiorum Università di Bologna, Viale Risorgimento 2, 40136 Bologna, Italy
*
Author to whom correspondence should be addressed.
Energies 2020, 13(1), 172; https://doi.org/10.3390/en13010172
Submission received: 22 November 2019 / Revised: 14 December 2019 / Accepted: 24 December 2019 / Published: 30 December 2019
(This article belongs to the Section D1: Advanced Energy Materials)

Abstract

:
In this paper, a series of experimental data about the role of the metal foam thickness on the total air flow pressure drop is presented. The tested metallic foams are based on aluminum and nickel-chromium and they are characterized by a considerable value of porosity (>0.92) and by a number of pores per linear inches (PPI) close to 10. The measures were conducted in a range of air velocity values typical for HVAC fan-coils. Under these conditions, the flow regime into the pores is highly turbulent. It was demonstrated that below a threshold value of the ratio between the thickness of the porous medium (H) and the characteristic dimension of the pores (d), the dispersion of the pressure drop values from a sample to another one can be very high. This behavior can limit the industrial use of these materials. In addition, the results presented in this paper confirm that the pressure drop data obtained under highly turbulent conditions can be conveniently used in order to determine the inertia coefficient, C, of the metal foam.

1. Introduction

During the last decade, many experimental and theoretical investigations have been carried out regarding the analysis of the thermal performances of open cell metal foams. The flow characteristics and pressure drop of the fluid flow in the open pores of a metal foam have been extensively studied in the past for many applications, such as catalysts, filters, heat exchangers, etc. Kumar and Topin [1] presented a critical review of experiments and correlations for determination of the pressure drop in open cell metal foams. They highlighted how the available data in terms of pressure drops in the open literature are widely dispersed. Dukhan and Minjeur [2] confirmed the discrepancies in values of both the permeability, K, and form drag coefficients, cf, found in the literature for metal foams. Following Kumar and Topin [1], this data dispersion is due to: (i) Non-consistent method of measuring the pressure drop [1]; (ii) wrong data extraction and treatment methods [1]; and (iii) non-uniform definition of the morphological characteristics of the metal foams [3]. Baril et al. [4] showed how the pressure gradient can be dependent on the sample thickness in the flow direction. They observed the decrease of the pressure gradient when the sample thickness was increased and the existence of an asymptotic value of the pressure gradient after a critical thickness was reached. Similar results were confirmed by Dukhan and Patel [5], Oun and Kennedy [6], and de Carvalho et al. [7]. The goal of this experimental research was to test the performance of open-cell metal foams as a replacement of conventional aluminum fins adopted in air-water compact heat exchangers for HVAC emitters. In fact, metal foams are usually characterized by large surface-to-volume values and by an internal structure, which improve the fluid mixing and promote the thermal boundary layer breaking. In this way, the air-side thermal resistance, representing up to 70% of the overall thermal resistance of the compact heat exchangers for HVAC emitters, can be, in principle, strongly reduced by adopting metal foams instead of finned surfaces. On the other hand, an increase of the air-side pressure drop is expected when metal foams are used, and this aspect can reduce the attractivity of the use of metal foams for HVAC applications. In this paper, the pressure drop characterization of a series of aluminum and nickel-chromium metallic foams is described by considering a sequence of experimental runs in which the air flow operative conditions (i.e., air velocity range) were fixed in order to be compatible with the typical values adopted in HVAC systems. The aim of this study was to evaluate whether the random distribution of the pores, typical of these materials, can influence the pressure drop values obtained by using different samples of the same material. This aspect, not investigated in detail until now, was studied by measuring the effect of the foam thickness along the flow direction on the pressure drop results obtained with an air flow in a fully turbulent regime. According to this regime of flow, it was also shown how the inertia coefficient, C, a combination of the form-drag coefficient (cf) and the permeability (K), is the only accurate parameter, which can be provided by the experimental data for the foam characterization.

2. Experimental Test Rig and Materials
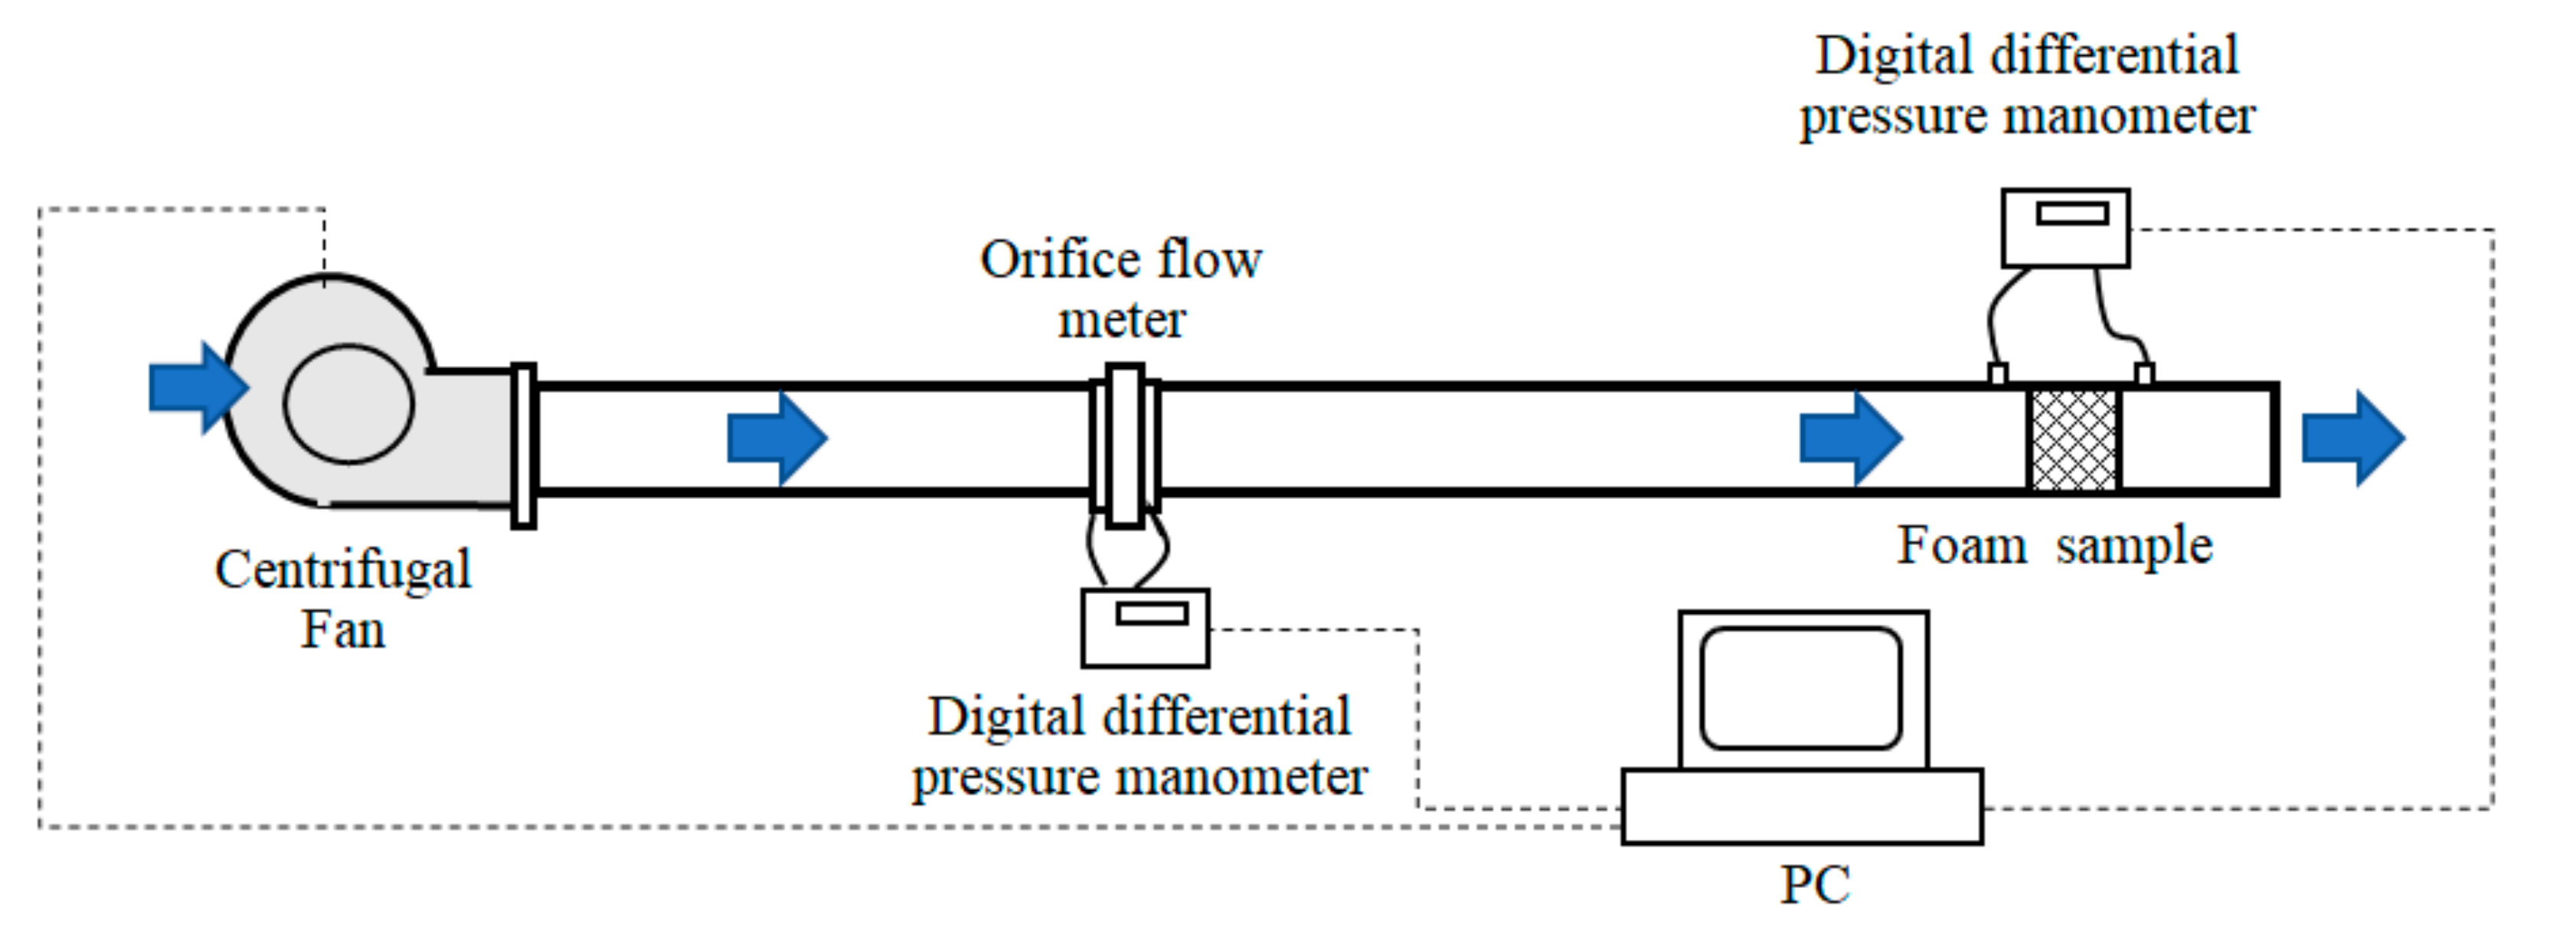
In this work, a series of experimental runs on samples of aluminum and nickel chromium open cell metallic foams were performed in order to measure the pressure drop under an imposed air flow.

2.1. The Test Rig

The test rig was composed of an inverter-driven centrifugal fan (Cimme, Lodi, Italy, mod. GCH 003540) by means of which air flow was introduced in an open-loop wind tunnel, where an orifice flow meter and the metallic foam sample were placed (see Figure 1).
The calibrated orifice (ISO 5617) was connected to a digital differential pressure manometer (TSI Inc., Shoreview, MN, US, VelociCalc® Plus, mod. 8386A). An additional differential micromanometer (TSI Inc., Shoreview, MN, US, DP-Calc™, mod. 8710) was used in order to measure the air pressure drop at the ends of the sample. The air temperature at the inlet was monitored by means of a K-type thermocouple. In addition, the air flow rate across the sample was varied by means of the inverter, which was controlled with LabView thanks to a PC.

2.2. Data Reduction and Uncertainty

The experimental tests were calibrated in order to investigate the behavior of the metal foams for typical average air velocity values used in commercial fan-coils for HVAC systems. Under these conditions, the air flow in the porous medium is not laminar at all. For this reason, the pressure drop across the metallic foam was studied by using the Darcy–Forchheimer model:
μ K 1 + ρ c f K μ u u = p + f ,
where K is the foam permeability, µ is the fluid dynamic viscosity, p is the fluid pressure, cf is a property of the porous medium called the form-drag coefficient, and f is the external body force per unit volume applied to the fluid (i.e., the gravitational body force). The Forchheimer term in Equation (1) highlights that the pressure gradient along the porous medium becomes proportional to the square of the seepage fluid velocity (u) if the flow is highly turbulent within the pores. The integration of Equation (1) on the sample cross-section leads to the following equation:
1 u d p d z = μ K + ρ c f K u = a + b u ,
in which the linear dependence on the frontal air velocity (u) of the pressure gradient across the porous medium scaled on the air frontal velocity is highlighted. The coefficients, a and b, in Equation (2) depend on the air properties (ρ, µ) as well as on the foam properties (K, cf). As demonstrated by the results presented in this paper, as well as the ones illustrated in [1], there in no chance to obtain an accurate evaluation of the foam permeability (K) and cf by using experimental data referring to highly turbulent flows through the porous medium. It is worth mentioning that this point was not completely clarified in previous works in the literature, where the use of pressure drop measurements made in a fully turbulent regime is frequently observed for the estimation of the foam permeability (K) with highly inaccurate results.
To assess the accuracy of measurements presented in this work, the uncertainty associated to each measurement device is reported in Table 1.
The uncertainty of the derived quantities was estimated by applying the theory on the error propagation to the uncertainty associated with the measurement of the single quantities p, D, L, and so on, following Figliola and Beasley [8]. In the present case, by using the ISO 5167 procedure for the determination of the air flow rate with the calibrated orifice, the following uncertainty values were detected: (i) Air mass flow rate: ±0.7%, (ii) air velocity: ±1%, (iii) pressure gradient across the sample: ±2.6%, and (iv) pressure gradient scaled on the air velocity: ±3%.

3. Results and Discussions

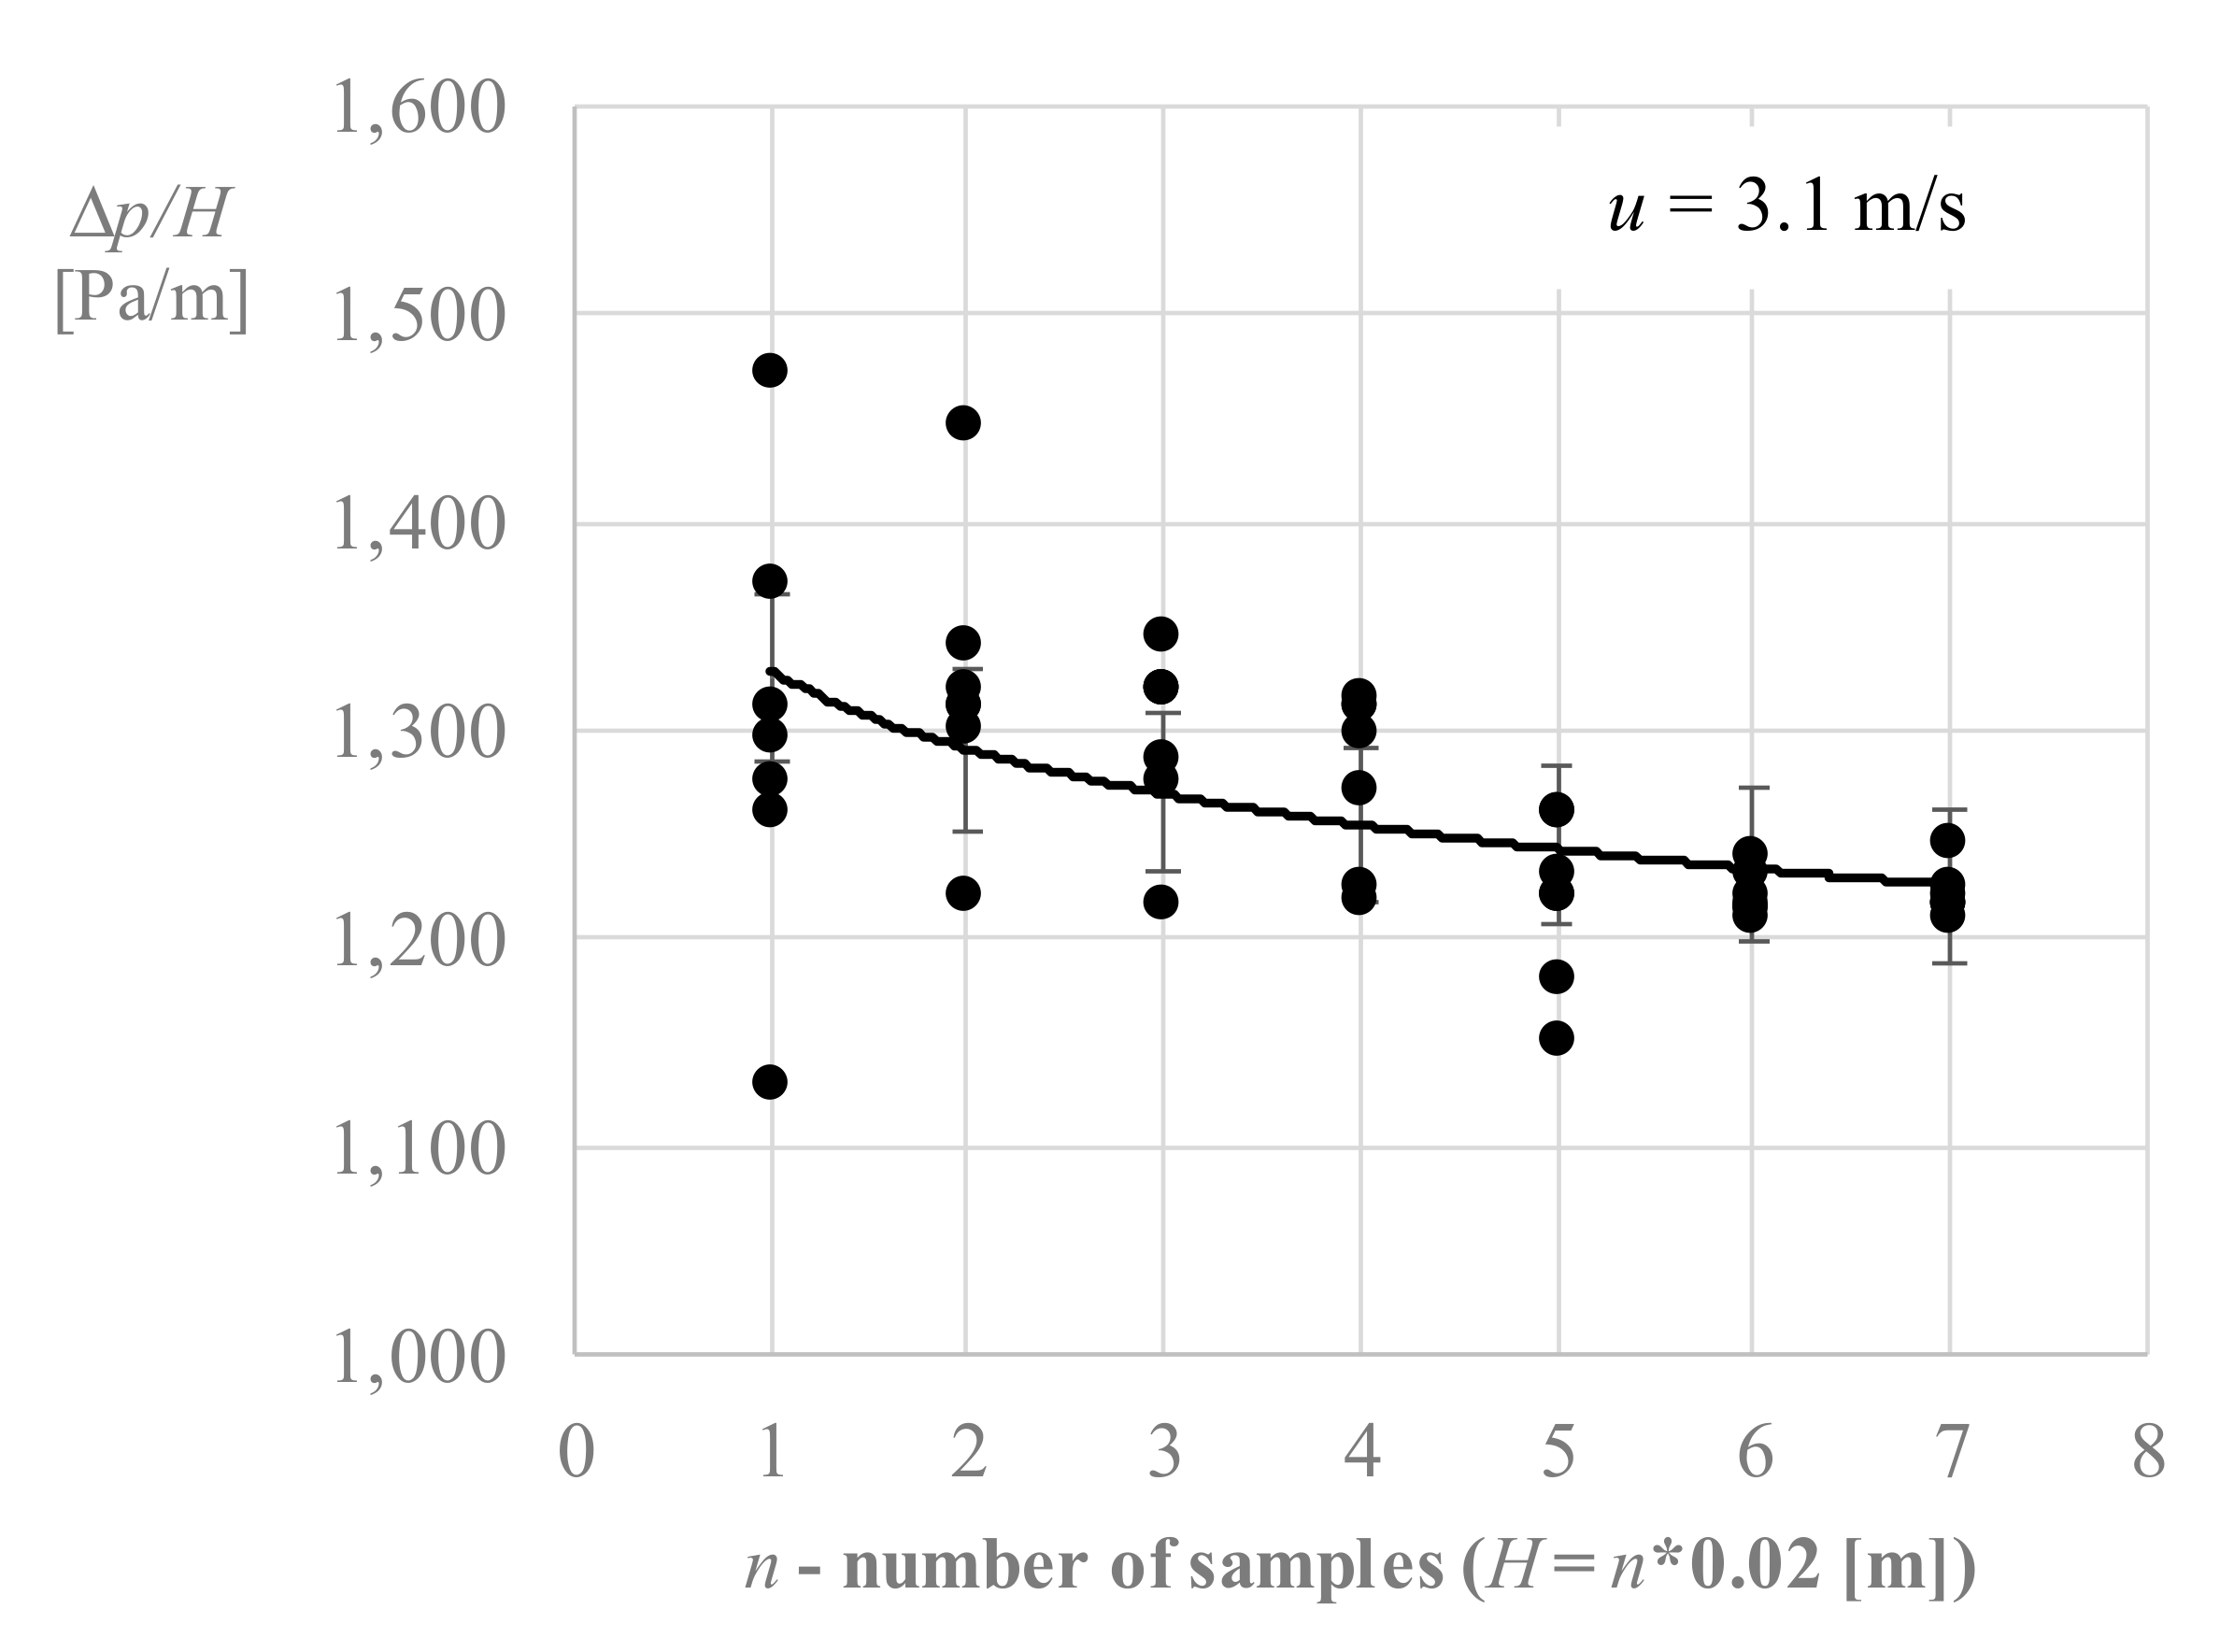
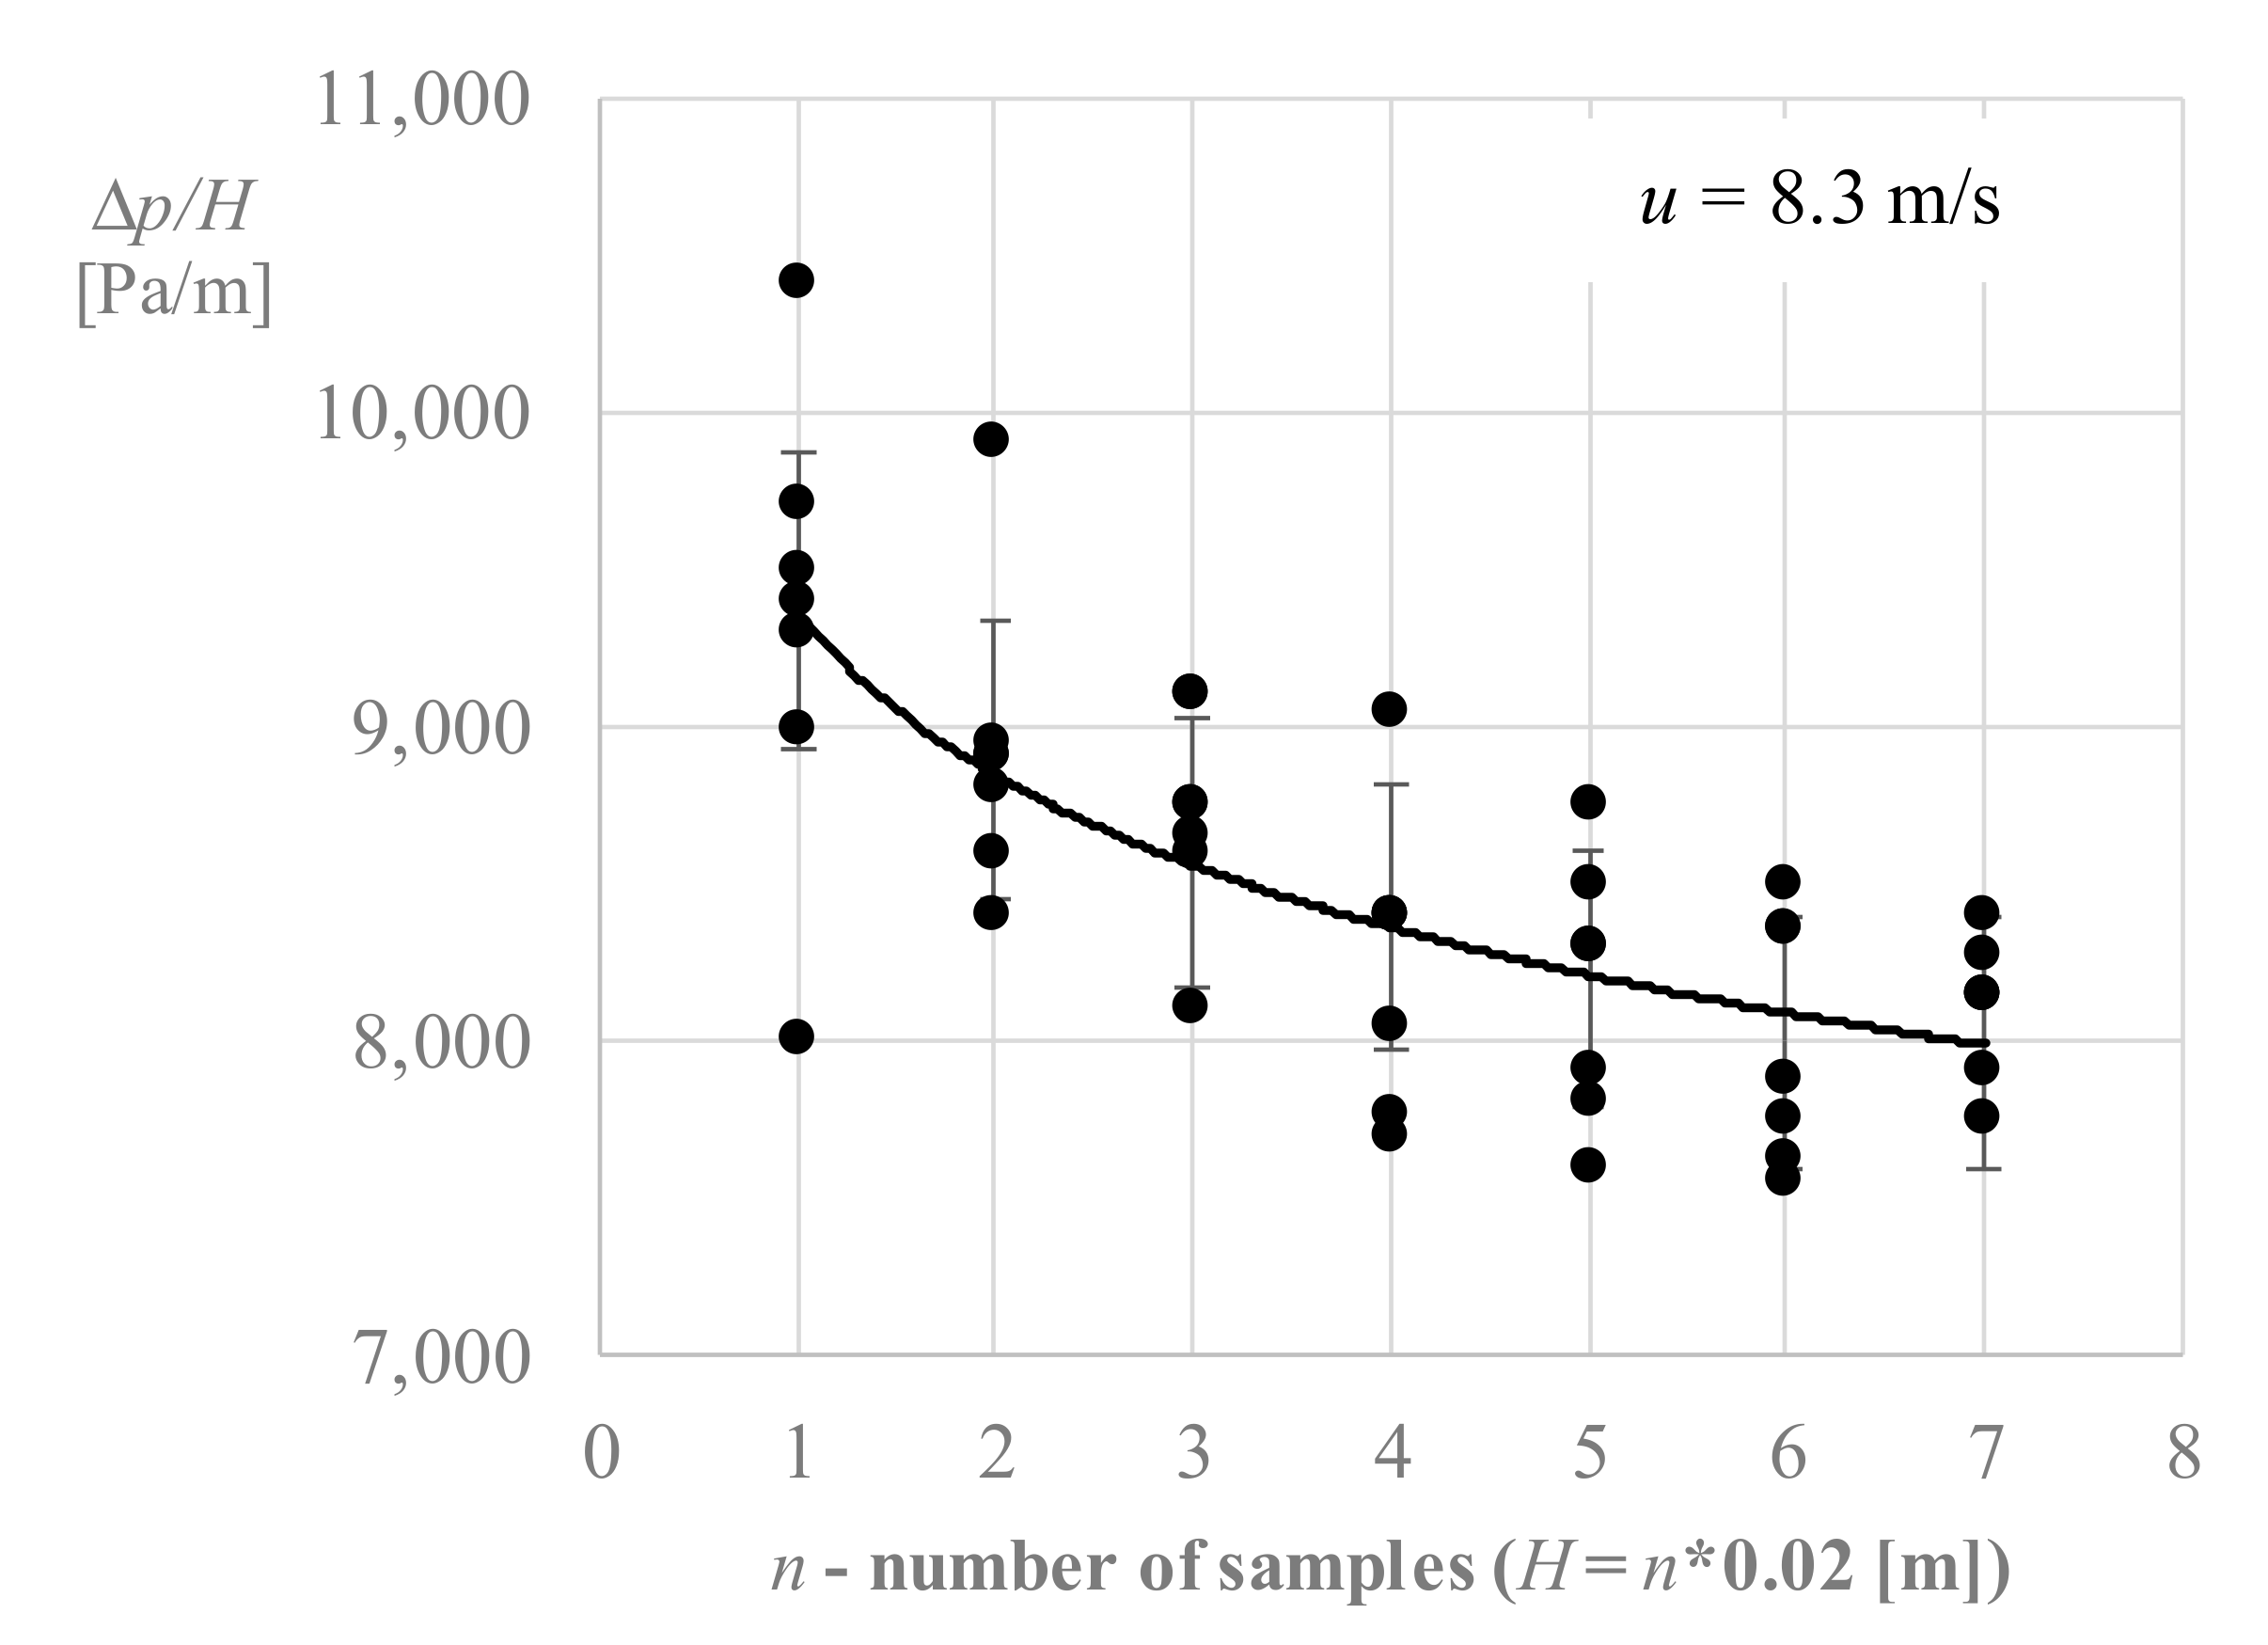
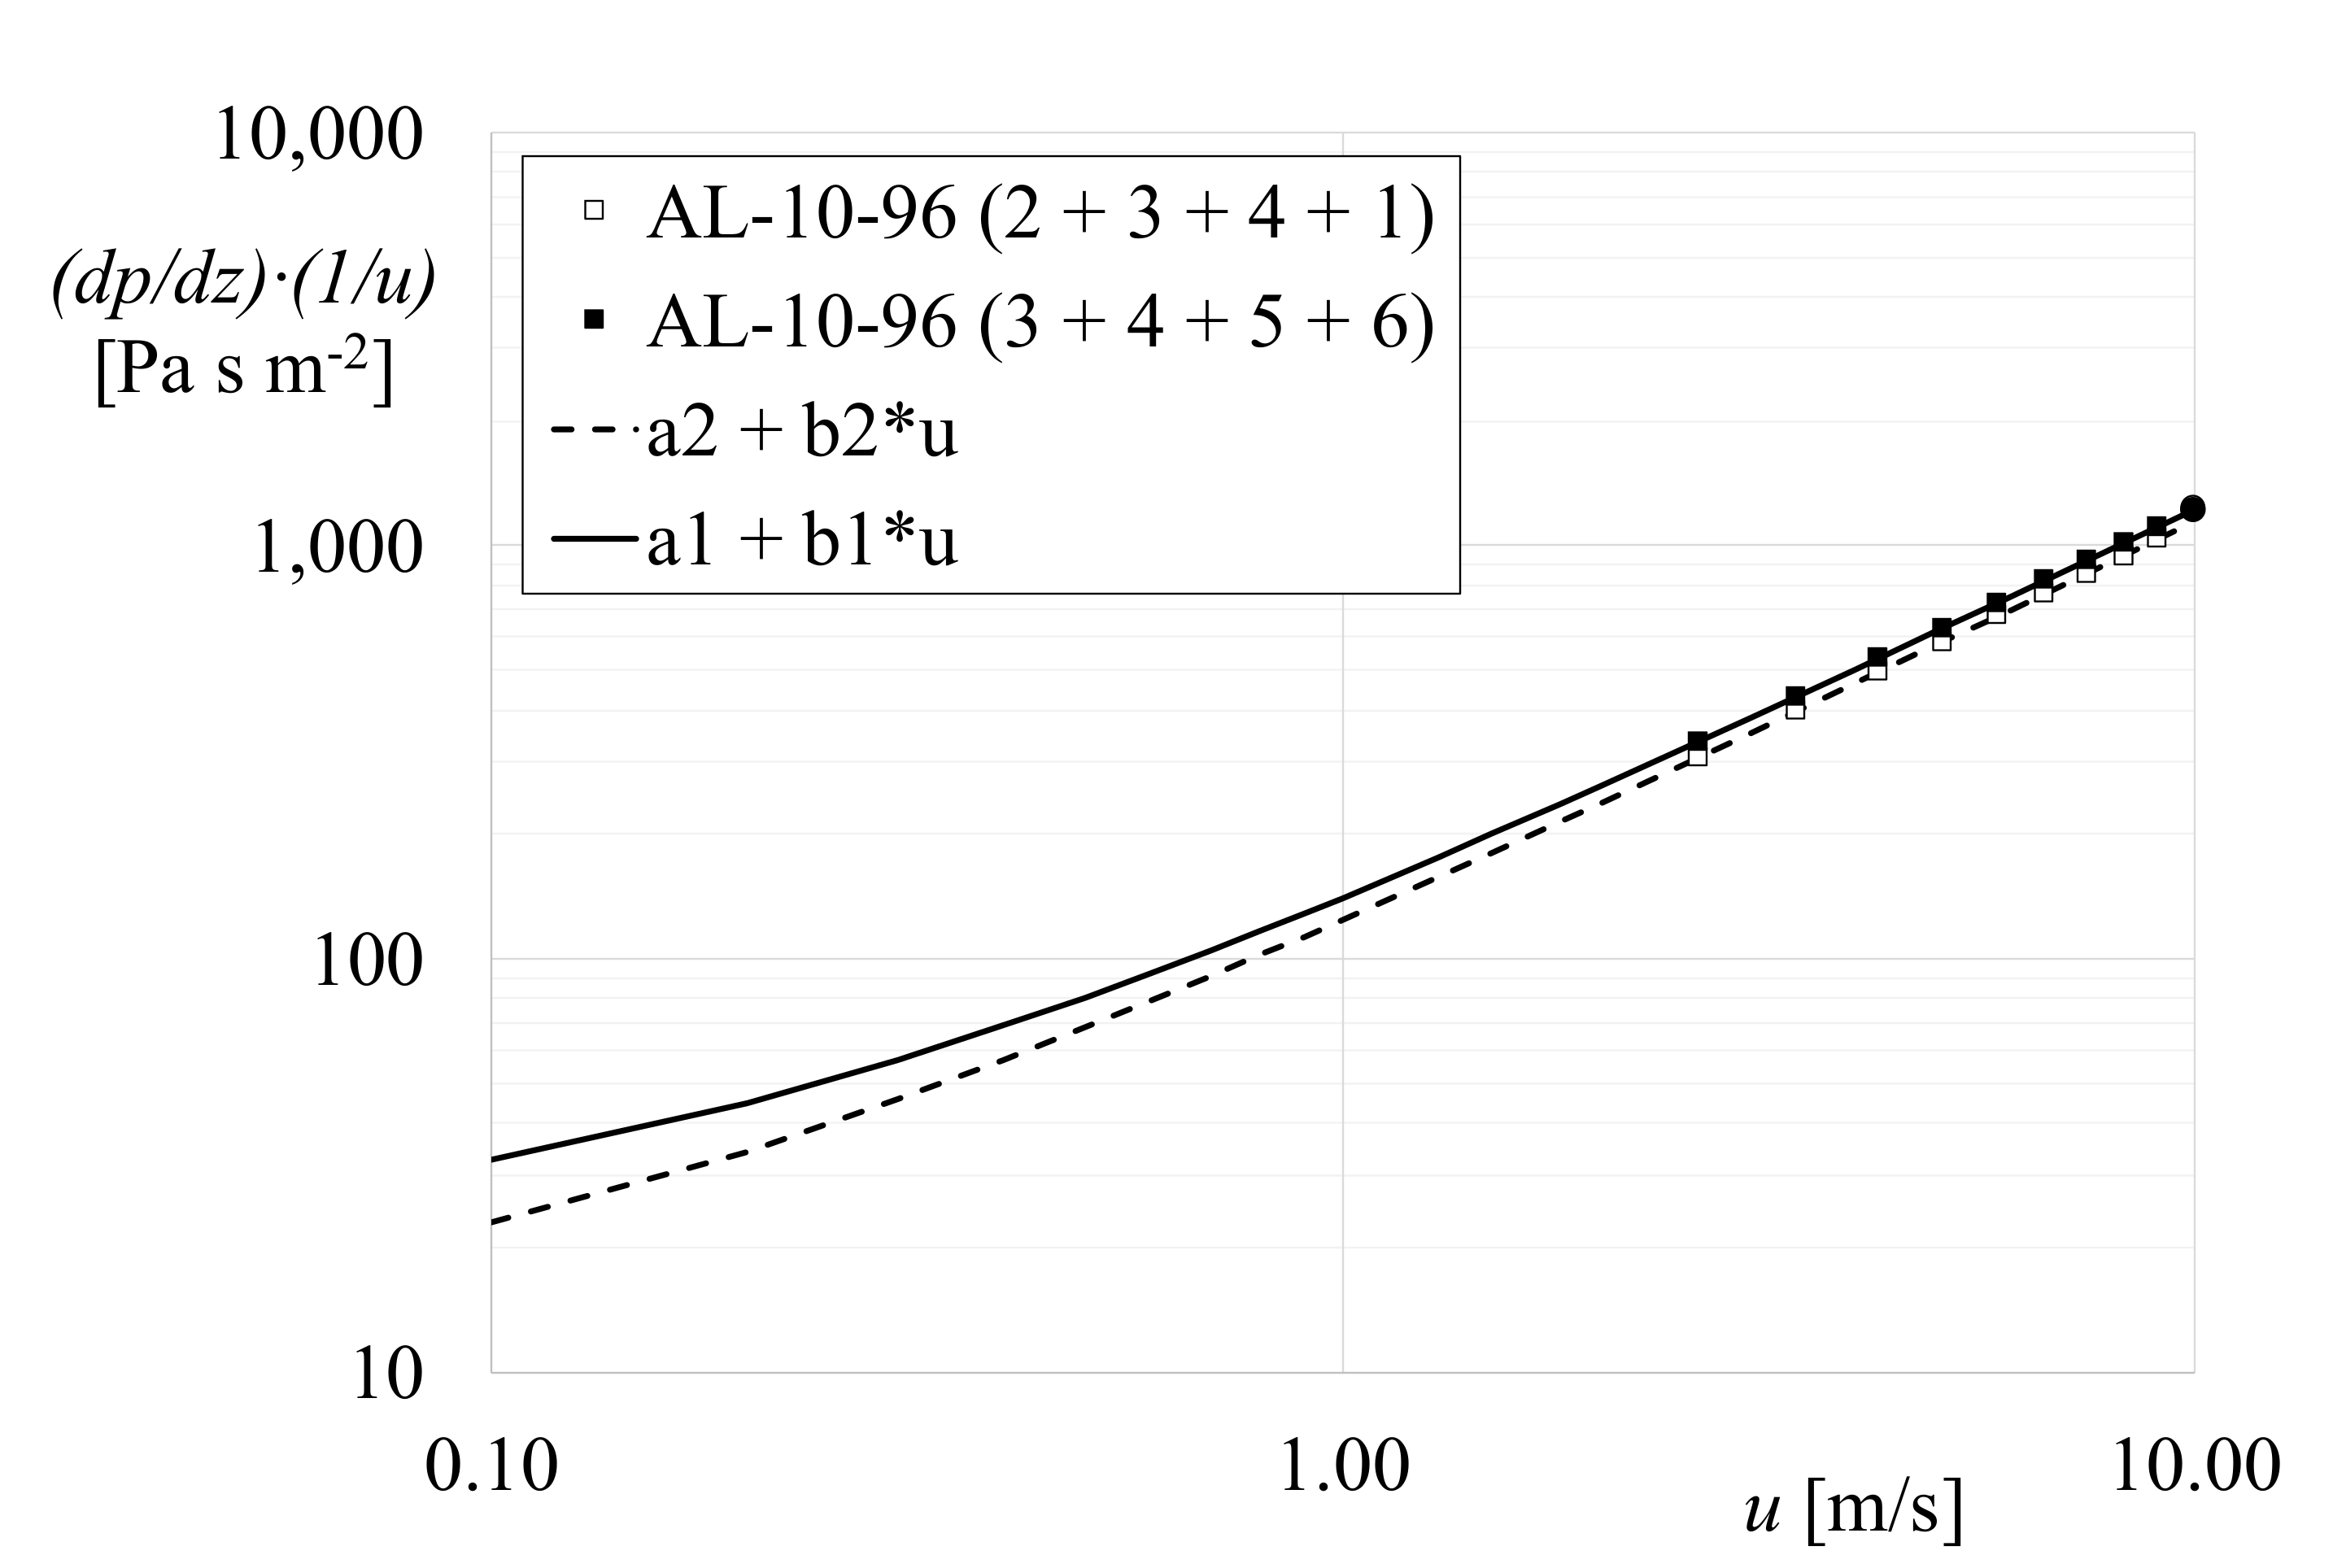
3.1. Pressure Drop and Critical Foam Thickness

Eight samples of aluminum foams and three samples of Nichel-Chromium foams with the same external dimensions were obtained by a unique sheet. The main characteristics of each sample are described in Appendix A (see Table A1). Each sample is named XX-YY-ZZ in Table A1, where XX indicates the main material of the foam, YY and ZZ express respectively porosity and Pores Per Inches (PPI) values declared by the manufacturer. In this work, seven samples of AL-10-96 were used in order to create different foam assemblies. By combining the samples, it is possible to vary the total thickness of the assembly crossed by the air flow from 20 mm (using one sample of AL-10-96) up to 140 mm (with seven samples of AL-10-96). The experimental results confirmed that no significant differences are evidenced by changing either the order of the samples or the faces exposed at the air flow. In other words, the difference in terms of the pressure drop was always within the typical experimental uncertainty for an assembly obtained with n samples (i.e., 1, 2, 3) by testing all the possible combinations (i.e., 1 + 2 + 3 or 1 + 3 + 2 or 2 + 3 + 1 and so on). However, for a fixed number of samples (n), the variation of the measured pressure drop changes if the samples coupled in the assembly are different. As an example, different results in terms of pressure drop are usually obtained for an assembly based on three samples if different combinations are used (i.e., 1 + 2 + 3, 1 + 7 + 6, 5 + 6 + 7, and so on). In Figure 3, the total pressure gradient across the total thickness (H) of the assembly is shown as a function of the number of samples of the assembly for fixed values of the frontal air velocity equal to 3.1 and 8.3 m/s by considering all the samples’ combinations that can be used for a fixed number of samples.
It is evident that the measured value of the total pressure gradient is extremely variable with the sample tested when only one sample of AL-10-96 is crossed by the air flow. This is due to the random distribution of the pores and to the low value of the ratio between the thickness of the sample (H) and the dimensions (d) of the pores (in this case, H/d = 7–8 for one sample). A low value of the ratio of H/d means that the volume of the assembly cannot be considered as representative of the morphology of the bulk material due to the low statistics of the pores involved. For this reason, it is expected that each test can evidence a different value of the pressure drop, linked to the different morphology of the samples. On the contrary, when H/d increases, the characteristics of the volume crossed by the air flow become independent of the morphology of each sample and the fluid-dynamic behavior of the system is proven to not be influenced by the samples. This conclusion is confirmed in Figure 2. When the total thickness of the assembly is augmented by increasing the number of samples, the differences among the gradient pressure across the total thickness of the assembly for different combinations of samples (i.e., 1 + 2, 2 + 3, 3 + 6, 1 + 7, and so on) tends to be reduced. For a fixed air velocity of 3.1 m/s (see Figure 2a), all the combinations of samples for assemblies obtained by coupling more than four samples (H = 80 mm) have a pressure gradient that falls within the experimental uncertainty (5%).
In Figure 2b, it is possible to observe that when the air velocity is increased to 8.3 m/s, a larger number of samples are needed in order to reduce to 5% the deviation of the pressure gradient from a combination to another one. This experimental evidence is extremely important because it shows that the hydraulic performances of metal foams can vary significantly from a sample to another one if the total thickness of the foam is lower than a “threshold value”, linked to the ratio of H/d between the thickness of the foam crossed by the air flow and the typical pore dimension. These observations seem to confirm that in order to reduce the differences among the samples in terms of pressure gradients, the ratio of H/d has to exceed a threshold value, which is variable with the air velocity. For the aluminum foams, AL-10-96, considered in this study, the abovementioned threshold value of the ratio of H/d varies from 20 for an air velocity of 3.1 m/s up to 50–60 for an air velocity of 8 m/s. This result means that the AL-10-96 foam thickness crossed by the air flow in a fan-coil must be larger than 100 to 120 mm in order to obtain the same fluid dynamic behavior, in terms of pressure drops, from a fan-coil to another one.

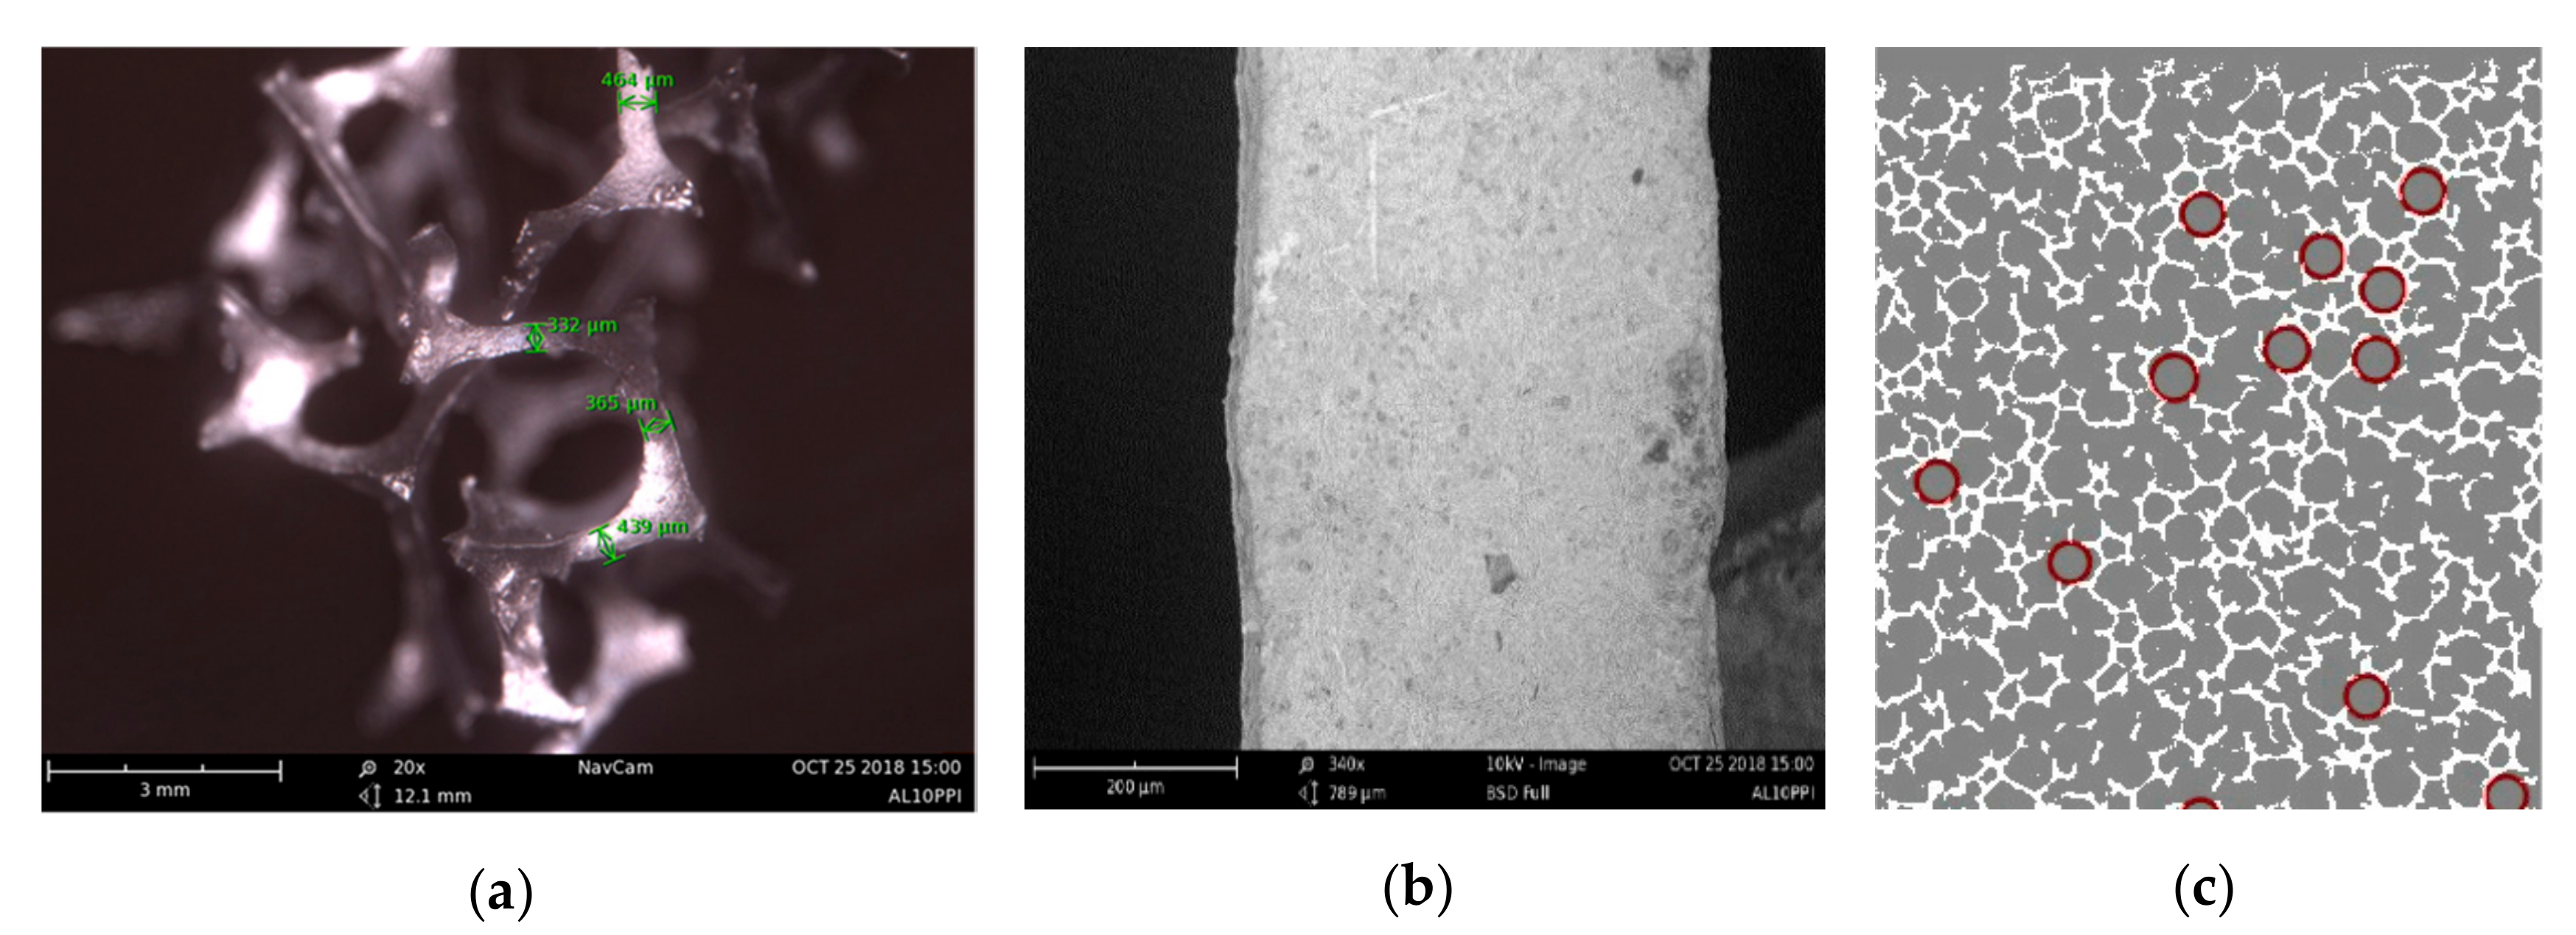
3.2. Characterization of the Metal Foam

In Figure 3, the pressure gradient scaled on the air frontal velocity is depicted as a function of the air velocity. In agreement with the Darcy–Forchheimer model (Equation (1)), the observed trend is perfectly linear. For H larger than 80 mm, the observed data dispersion is generally lower than 10%, with some exceptions in correspondence with air frontal velocity values larger than 9 m/s or lower than 2 m/s, as evidenced in Figure 3. In Figure 3a, it is possible to observe how, for assemblies with a number of samples lower than 4 and air velocity lower than 2 m/s, the difference of the pressure drop observed from an assembly to another one becomes more and more evident due to the combination of the random distribution of the pores within the samples and the larger uncertainty of the measured pressure drop and velocity. This is a limitation of the test rig used in this work, and for this reason, the investigation was not extended to air velocity values lower than 1.6 m/s.
From each experimental test from the linear trend of (dp/dz)(1/u), it is possible to extract the values of the coefficients of a and b of Equation (2), and one can calculate the permeability (K) and form-drag coefficient (cf) of the porous medium if the thermophysical properties of the air are known:
K = μ a ; c f = b K ρ .
Many authors used this method to obtain the dynamic parameters of metal foam (K, cf), but it is possible to demonstrate that it is able to give an accurate estimation of the permeability only if pressure drops are measured in correspondence with very low air velocity values for which the flow regime into the pores is laminar or early turbulent [1].
Unfortunately, this is not the case for many of the experimental tests conducted using air as working fluid across metal foams. To better explain the potential inaccuracy of this method for determining K, let us now consider the experimental data shown in Figure 4. These data were obtained by testing two assemblies with a different combination of four samples. For a fixed air velocity, the total pressure drop across the assembly differs by around 8%, larger than the typical experimental uncertainty (2.5%), which is due to the differences of the morphology of the samples involved. If these two series of experimental data are used in order to obtain the coefficients, a and b, of Equation (3), one can observe how this method is able to give an indication of the slope (b) with a variation of the order of 6.4% between the two series in agreement with the differences in terms of the measured pressure drop. On the contrary, the value of a is affected by a very large variation (+78.5%). This difference on a (see a1 and a2 in Figure 4) is reflected on the permeability, K, whose percentual variation is equal to −44.3% by using these two series of experimental results, which is very similar indeed in terms of the total pressure drop.
It is possible to follow Richardson et al. [9] and Tadrist et al. [10] by determining from the experimental data the inertia coefficient, C, defined as the ratio between b and the air density, ρ. C is a combination of the permeability and the form-drag coefficient of the metal foam (see Equation (3)). The value of C is more appropriate for the characterization of the fluid dynamic behavior of fluid flow across metal foams in a highly turbulent regime with respect to K and cf. Furthermore, it is recommended that researchers only use the parameter, C, for turbulent flows. In Figure 5, the values of C extracted by the experimental data for aluminum samples are shown as a function of the thickness, H, of the assembly tested (which is linked to the number of samples coupled). It is evident that there are differences among the values of C associated to the different assemblies obtained by coupling various samples. This is due to the different morphology of each sample and it has been observed by other researchers [9,10,11,12,13,14]. In this case, C ranges from 68 to 118 m−1 for aluminum foams, with an average value of 90 m−1.
In Table 2, the comparison with the experimental values of C found in the literature for aluminum metal foams with 10 PPI and porosity of 96% is shown. The results obtained in this work are in coherence, especially with the results of De Schampheleire et al. [13], who tested the aluminum metal foam AL-10-96 made by the same manufacturer (Mayser, Lindenberg, Germany).
The same conclusions can be obtained by working with nickel-chromium (NCX-11-92) metal foams; even for this foam, the values of C obtained in this work are fully consistent with the results obtained by different research teams [15,16]. This confirms that when, for a fixed metal foam, the comparison is made in terms of C, a convergence of results is easily reached in the context of similar foams. However, the uncertainty on the definition of the foam’s PPI value can justify the discrepancies shown in Table 2 among C values determined using different samples.

4. Conclusions

In this work, an experimental campaign dealing with the characterization of aluminum and nickel chrome open-cell metal foams with a fixed PPI value (10) and high porosity (>92%) was described.
The main purpose was to verify whether these materials can be conveniently applied as a replacement of conventional finned surfaces for the air-water heat exchangers used in HVAC systems.
Many ideas emerged from the experimental campaign performed:
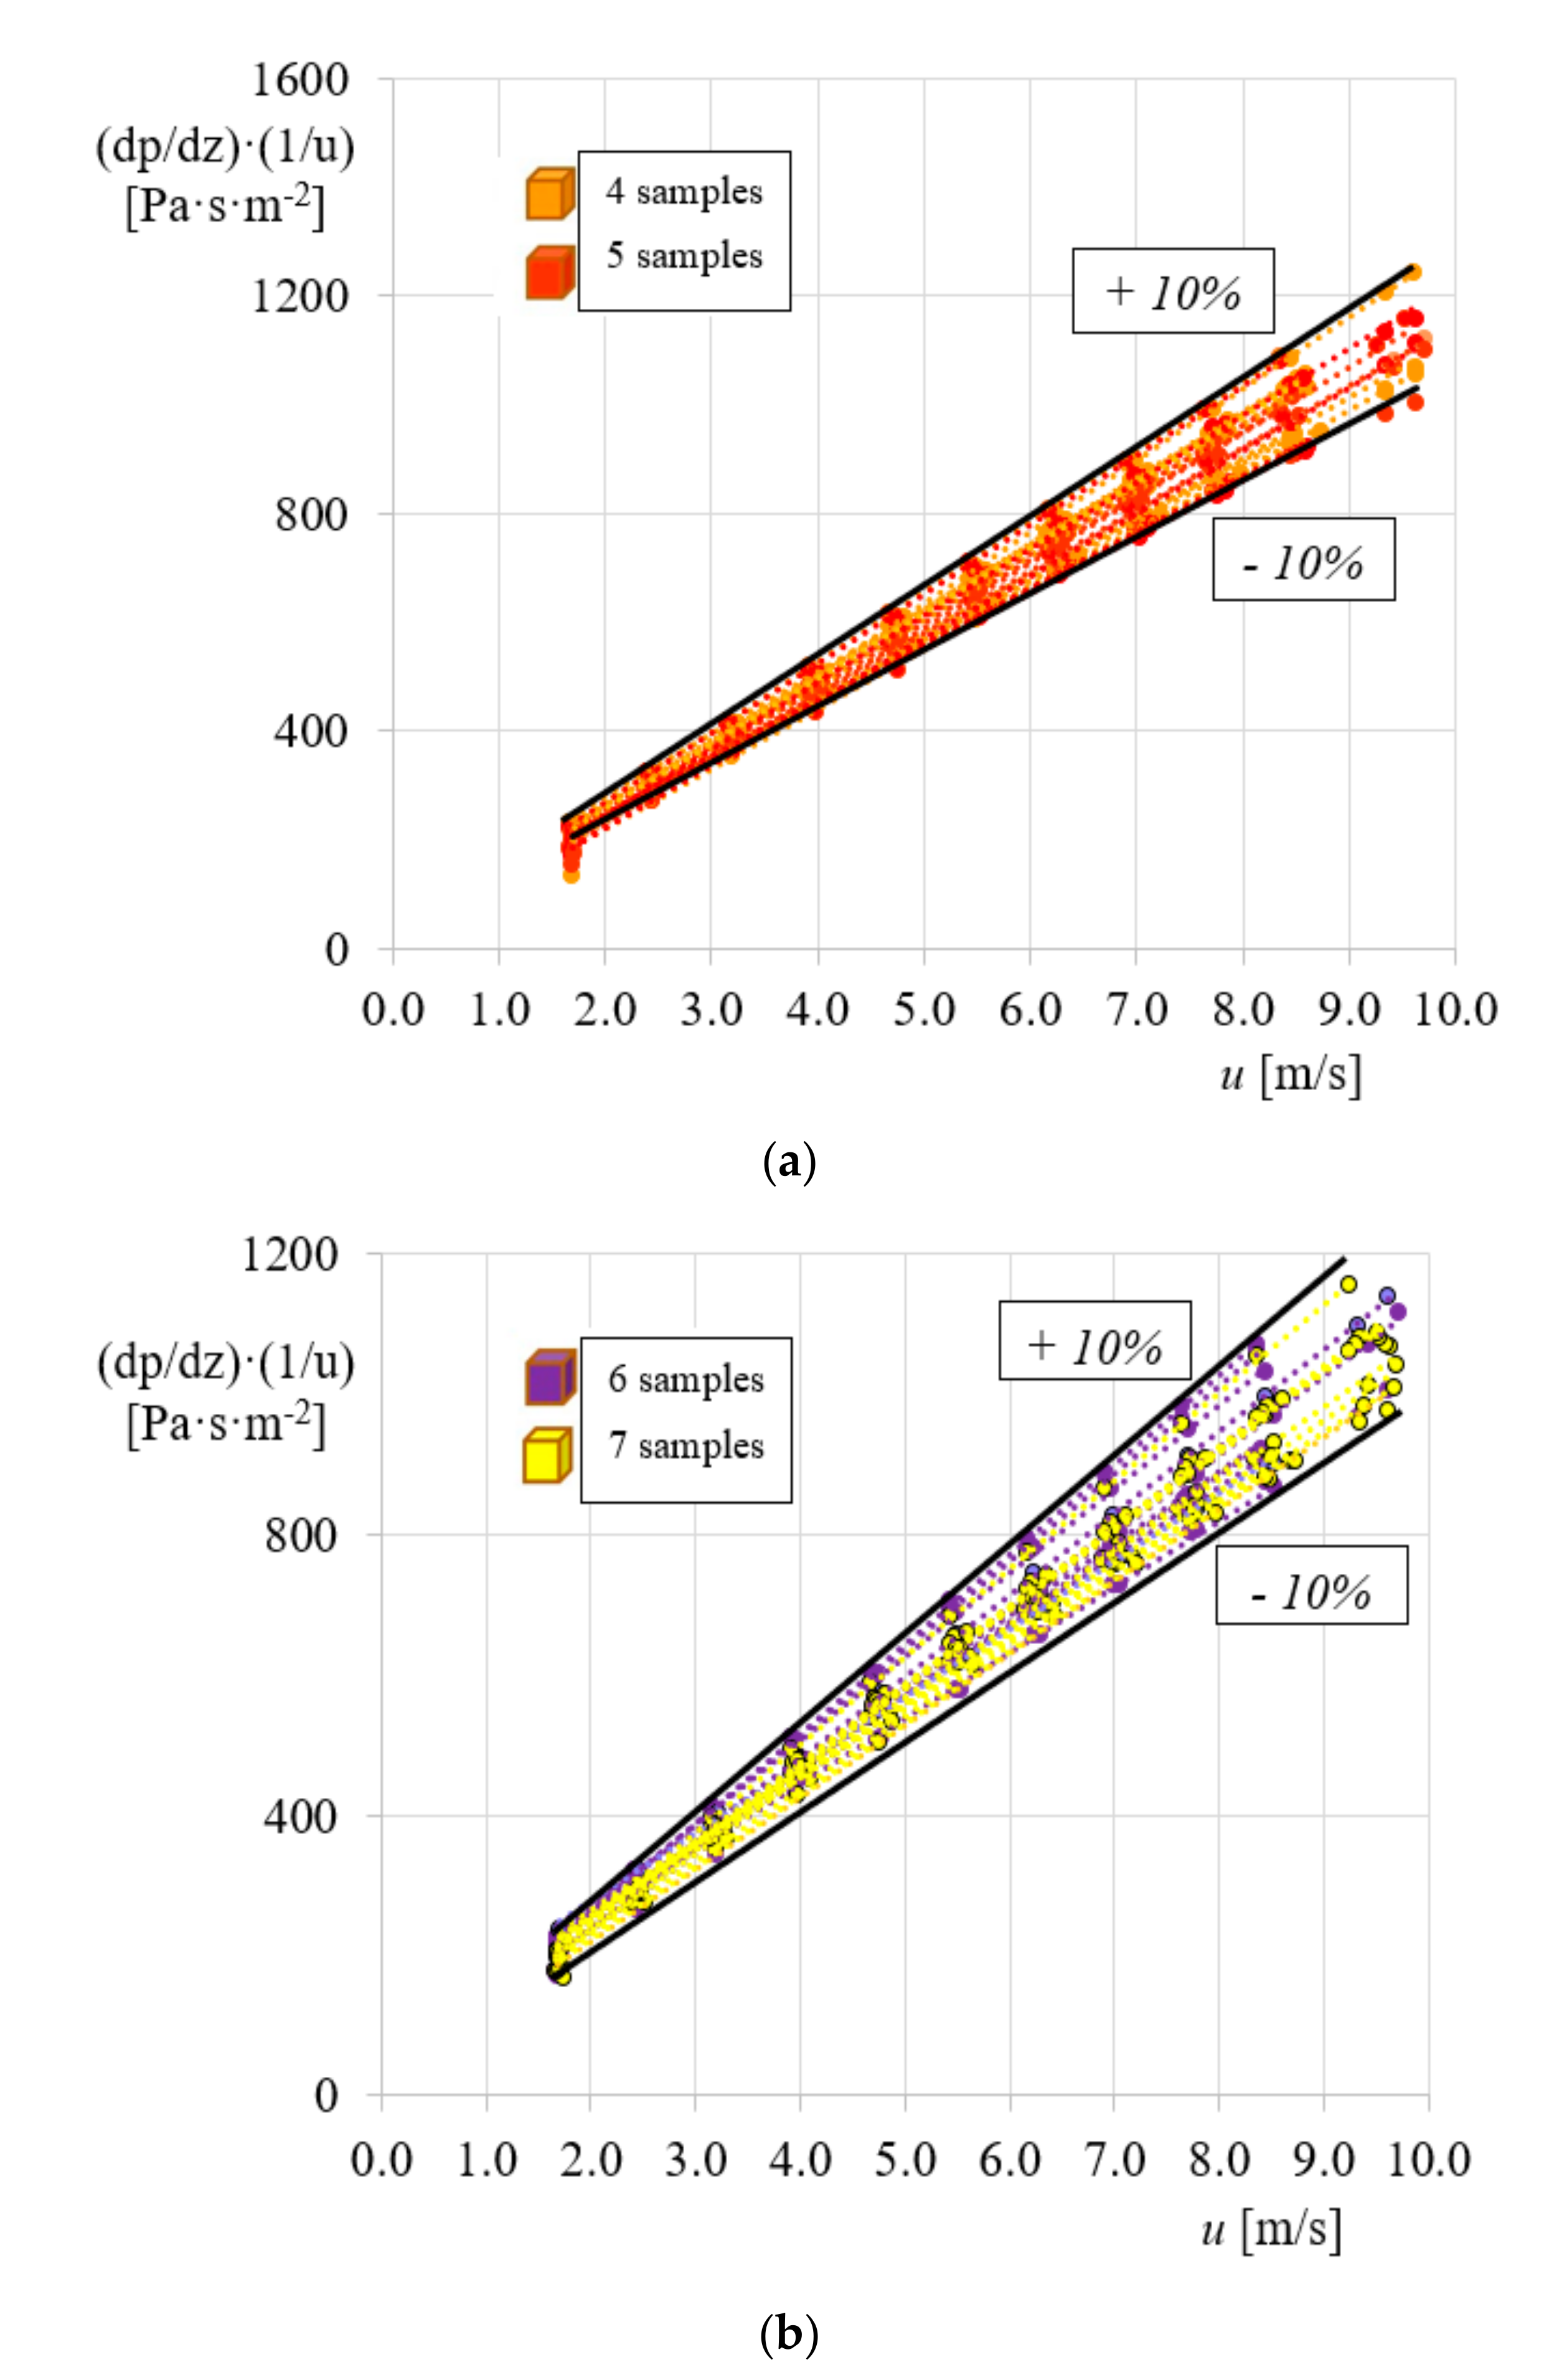
  • The flow regime of air, with the frontal velocity ranging from 2 to 10 m/s (typical for HVAC air-water compact heat exchangers), is highly turbulent in metal foams with a porosity of 96% and 10 PPI. In this regime, the pressure drop depends on the squared value of the frontal air velocity value.
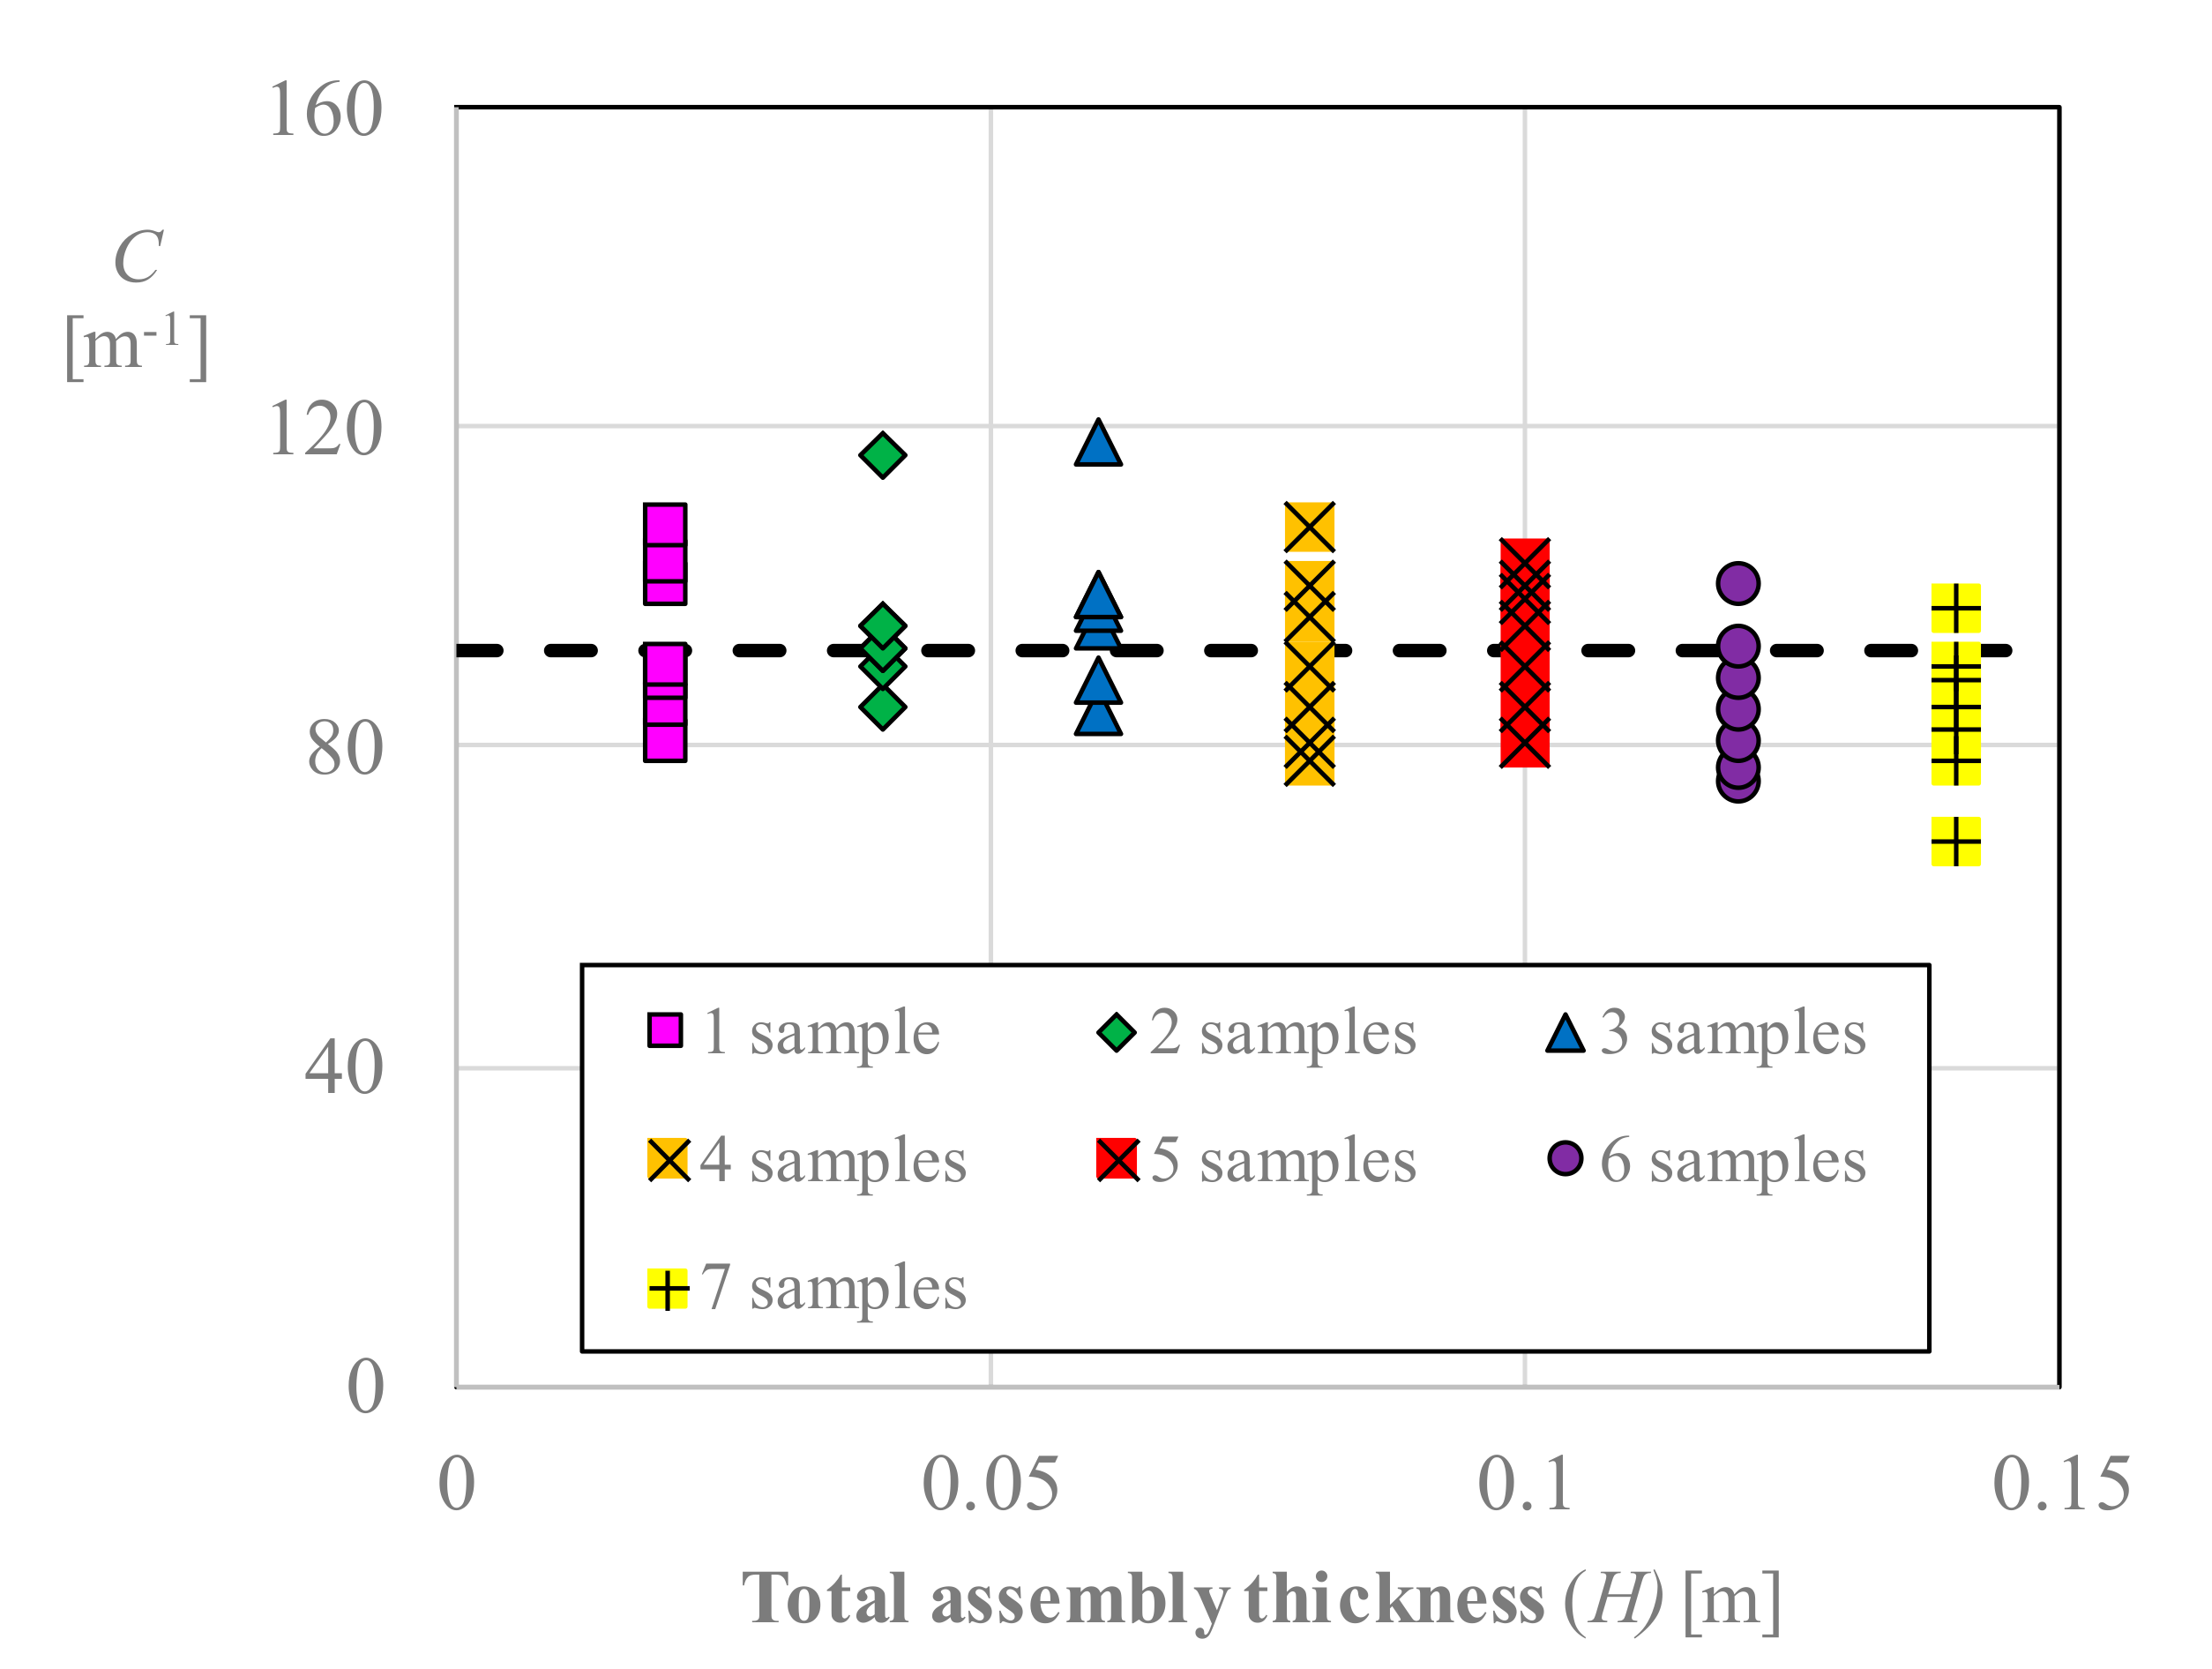
  • The ratio between the thickness of the metallic foam and the characteristic dimension of the pores (H/d) must be larger than a threshold value in order to obtain pressure drop values independent of the considered sample. This threshold value increases with the augmentation of the air velocity.
  • The permeability, K, of the metallic foam derived by the pressure drop data under a turbulent regime is affected by large inaccuracy. For this reason, the use of the pressure drop data obtained in the turbulent regime is suggested to extract the inertia coefficient, C, which is suitable for the characterization of foam behavior in a turbulent regime.

Author Contributions

Conceptualization, G.L.M., C.B. and G.F.; Methodology, G.L.M.; Validation, G.L.M., S.C., M.D. and M.G.; Formal analysis, G.L.M., S.C., M.D. and M.G.; Investigation, S.C. and M.G.; Resources, G.L.M. and G.F.; Data curation, S.C.; Writing—original draft preparation, G.L.M. and C.B.; Writing—review and editing, G.L.M. and C.B.; Supervision, G.L.M.; Project administration, G.L.M.; Funding acquisition, G.L.M. All authors have read and agreed to the published version of the manuscript.

Funding

This research was funded by POR-FESR 2014-2020 Program (Regione Emilia-Romagna, Italy) under the NANOFANCOIL project.

Acknowledgments

The Authors are grateful to the fan-coil manufacture Galletti Spa (Bentivoglio (BO), Italy) for the technical materials provided for the experiments and the discussion of the results.

Conflicts of Interest

The authors declare no conflict of interest. The funders had no role in the design of the study; in the collection, analyses, or interpretation of data; in the writing of the manuscript, or in the decision to publish the results.

Appendix A

Open-Cell Metal Foam Samples

Eight samples of aluminum foams with the same external dimensions (see Table A1) were obtained by a unique sheet. In addition, three samples of nickel chromium foams are also tested.
The manufacturer of the aluminum foam (Mayser, Lindenberg, Germany) declared a porosity of the samples equal to 96% and 10 Pores Per Inches (PPI). The manufacturer of the nickel chromium foams (Recemat BV, Dodewaard, the Netherlands) declared for the samples a value of porosity of 92% and a range of 11 to 16 PPI. Both PPI values and porosity were verified for each sample through different methods. The porosity of each sample was measured by comparing the weight of the sample with the expected weight of the volume filled by the solid material. The weight of the samples was measured by using an analytical balance (RADWAG, Radom, Poland, mod. AS 220.R2). From Table A1, it is worth mentioning that the measured values of porosity confirm the indication of the manufacturer with a maximum deviation less than 1%. Moreover, a slightly larger value of the maximum deviation between the measured and declared porosity was observed for nickel chromium foams but, even in this case, the difference was lower than 2%.
Table A1. List of the main characteristics of the tested metallic foam samples.
SampleMaterialSizes
[mm]
Porosity [%]
Declared/Measured
PPI
Declared/Measured
d/t
[mm]
AL-10-96(1)Al7SiMg100 × 100 × 2096/96.510/8-113.1/0.47
AL-10-96(2)Al7SiMg100 × 100 × 2096/96.710/8-112.80/0.47
AL-10-96(3)Al7SiMg100 × 100 × 2096/96.610/8-112.59/0.47
AL-10-96(4)Al7SiMg100 × 100 × 2096/96.510/8-113.17/0.47
AL-10-96(5)Al7SiMg100 × 100 × 2096/96.610/8-112.60/0.47
AL-10-96(6)Al7SiMg100 × 100 × 2096/96.410/8-112.82/0.47
AL-10-96(7)Al (99.7%)100 × 100 × 2096/96.510/8-112.19/0.47
AL-10-96(8)Al (99.7%)100 × 100 × 2096/96.610/8-112.61/0.47
NCX-11-92(1)Ni (49%) Cr (45%)100 × 100 × 2092/93.911-16/11-161.4/0.35
NCX-11-92(2)Ni (49%) Cr (45%)100 × 100 × 2092/93.311-16/11-161.4/0.35
NCX-11-92(3)Ni (49%) Cr (45%)100 × 100 × 2092/91.811-16/11-161.4/0.35
In order to verify the PPI values, the pore size (d) and the average fiber thickness (t) of each sample, a series of measures was made by means of the acquisition of digital images of the foam surface by SEM. In Figure A1, the typical digital image of a portion of the aluminum foam obtained by SEM is depicted (Figure A1a) and the zoomed view of a single fiber (Figure A1b). In order to check the typical dimensions of the pores, the digital images were treated numerically by using the MATLAB Image Toolbox (Mathworks Inc., Natick, MA, US). First of all, the sample surface was painted white in order to improve the contrast between the solid part and the pores. A black/white image was obtained by using the function, im2bw, with a fixed threshold value (i.e., 0.5).
With the combination of the functions strel, imclose, and imfindcircles, it was possible to automatically detect the pores and their sizes (Figure A1c). As a final result, the distribution of the pores size on the surface was obtained by extracting the average value (d) reported in Table 1 for each sample. In addition, by means of the digital image, the average PPI value was extracted. The obtained values of PPI were close to the values declared by the manufacturers (see Table A1).
The automatic procedure in the MATLAB Image toolbox framework was not able to give a complete overview of the porous medium characteristics because it is based on the observation of the external surfaces of the sample but it can be considered as an interesting fast, non-destructive, and inexpensive technique for the characterization of a metallic foam sheet before its industrial use.
Figure A1. (a) SEM image of the aluminum foam; (b) zoomed view of a fiber; (c) automatic individuation of pores having similar sizes.
Energies 13 00172 g0a1

References

  1. Kumar, P.; Topin, F. State-of-the-art of pressure drop in open-cell porous foams: Review of experiments and correlations. J. Fluids Eng. 2017, 139, 111401. [Google Scholar] [CrossRef]
  2. Dukhan, N.; Minjeur, C.A. A two-permeability approach for assessing flow properties in metal foam. J. Porous Mater. 2011, 18, 417–424. [Google Scholar] [CrossRef]
  3. Iasiello, M.; Bianco, N.; Chiu, W.K.S.; Naso, V. Thermal conduction in open-cell metal foams: Anisotropy and Representative Volume Element. Int. J. Therm. Sci. 2019, 137, 399–409. [Google Scholar] [CrossRef]
  4. Baril, E.; Mostafid, A.; Lefebvre, L.P.; Medraj, M. Experimental demonstration of entrance/exit effects on the permeability measurements of porous materials. Adv. Eng. Mater. 2008, 10, 889–894. [Google Scholar] [CrossRef] [Green Version]
  5. Dukhan, N.; Patel, K. Effect of sample’s length on flow properties of open-cell metal foam and pressure-drop correlations. J. Porous Mater. 2011, 18, 655–665. [Google Scholar] [CrossRef]
  6. Oun, H.; Kennedy, A. Experimental investigation of pressure-drop characteristics across multi-layer porous metal structures. J. Porous Mater. 2014, 21, 1133–1141. [Google Scholar] [CrossRef] [Green Version]
  7. De Carvalho, T.P.; Morvan, H.P.; Hargreaves, D.M.; Oun, H.; Kennedy, A. Pore-scale numerical investigation of pressure drop behaviour across open-cell metal foams. Transp. Porous Media 2017, 117, 311–336. [Google Scholar] [CrossRef] [Green Version]
  8. Figliola, R.S.; Beasley, D.E. Theory and Design for Mechanical Measurements, 2nd ed.; John Wiley & Sons: New York, NY, USA, 2011. [Google Scholar]
  9. Richardson, J.T.; Peng, Y.; Remue, D. Properties of ceramic foam catalyst supports: Pressure drop. Appl. Catal. A Gen. 2000, 204, 19–32. [Google Scholar] [CrossRef]
  10. Tadrist, L.; Miscevic, M.; Rahli, O.; Topin, F. About the use of fibrous materials in compact heat exchangers. Exp. Therm. Fluid Sci. 2004, 28, 193–199. [Google Scholar] [CrossRef]
  11. Kamath, P.M.; Balaji, C.; Venkateshan, S.P. Experimental investigation of flow assisted mixed convection in high porosity foams in vertical channels. Int. J. Heat Mass Transf. 2011, 54, 5231–5241. [Google Scholar] [CrossRef]
  12. Boomsma, K.; Poulikakos, D. The effects of compression and pore size variations on the liquid flow characteristics in metal foams. J. Fluids Eng. 2002, 124, 263–272. [Google Scholar] [CrossRef]
  13. De Schampheleire, S.; de Kerpel, K.; Ameel, B.; de Jaeger, P.; Bagci, O.; De Paepe, M. A discussion on the interpretation of the Darcy equation in case of open-cell metal foam based on numerical simulations. Materials 2016, 9, 409. [Google Scholar] [CrossRef] [PubMed] [Green Version]
  14. Mancin, S.; Zilio, C.; Cavallini, A.; Rossetto, L. Pressure drop during air flow in aluminum foams. Int. J. Heat Mass Transf. 2010, 53, 3121–3130. [Google Scholar] [CrossRef]
  15. Khayargoli, P.; Loya, V.; Lefebvre, L.P.; Medraj, M. The impact of microstructure on the permeability of metal foams. Proc. Can. Soc. Mech. Eng. (CSME) Forum 2004, 2004, 220–228. [Google Scholar]
  16. Bonnet, J.P.; Topin, F.; Tadrist, L. Flow laws in metal foams: Compressibility and pore size effects. Transp Porous Media 2008, 73, 233–254. [Google Scholar] [CrossRef]
Figure 1. Lay-out of the experimental loop.
Energies 13 00172 g001
Figure 2. Pressure gradient across the total thickness of the assembly made with AL-10-96 samples as a function of the number of samples coupled and the air frontal velocity: (a) u = 3.1 m/s; (b) 8.3 m/s.
Energies 13 00172 g002aEnergies 13 00172 g002b
Figure 3. Pressure gradient (absolute value) scaled to the air velocity as a function of the frontal air velocity for: (a) assemblies with 4 (H = 80 mm) or 5 (H = 100 mm) AL-10-96 samples; (b) assemblies with 6 (H = 120 mm) or 7 (H = 140 mm) AL-10-96 samples.
Energies 13 00172 g003
Figure 4. Pressure gradient (absolute value) scaled on the air velocity as a function of the frontal air velocity for two series of experimental data obtained for two assemblies with four samples (H = 80 mm).
Energies 13 00172 g004
Figure 5. Inertia coefficient (C) values obtained for AL-10-96 as a function of the assembly thickness (n° of samples).
Energies 13 00172 g005
Table 1. Characteristics and uncertainties of the measurement instruments.
InstrumentRangeUncertainty
TSI, VelociCalc® Plus, mod. 8386A0–3735 Pa±1% FS
TSI, DP-Calc™ mod. 87100–3735 Pa±2% FS
Digital caliber0–10 mm±0.5% FS
Thermocouple (K-type)0–100 °C±0.25%FS
Table 2. Comparison of the obtained inertia coefficients C values with literature values for similar foams.
Metal FoamReferenceC [m−1]C [m−1]
Present Results
AL-10-96Kamath et al. [11]90 ÷ 16068–118
Tadrist et al. [10]114 ÷ 128
Boomsma et al. [12]110
De Schampheleire et al. [13]60 ÷ 120
Richardson et al. [9]123
Mancin et al. [14]170–240
NCX-11-92Khayargoli et al. [15]370360–420
Bonnet et al. [16]381

