Article

Improvement of the Steel-Plate Temperature during Preheating by Using Guide Vanes to Focus the Flame at the Outlet of a Gas Torch

1
School of Mechanical and Automotive Engineering, University of Ulsan, Ulsan 44610, Korea
2
Faculty of Mechanical Engineering, Ho Chi Minh City University of Technology (HCMUT), VNU-HCM, Ho Chi Minh City 700000, Vietnam
*
Author to whom correspondence should be addressed.
Energies 2019, 12(5), 869; https://doi.org/10.3390/en12050869
Submission received: 18 January 2019 / Revised: 22 February 2019 / Accepted: 22 February 2019 / Published: 5 March 2019

Abstract

:
The temperature distribution on a steel plate during a preheating process was compared using gas torch models with and without guide vanes. Numerical simulations were done using ANSYS FLUENT software, and experiments were done using thermal images obtained by a TVS-200EX infrared thermal camera. Liquefied petroleum gas (LPG) was used as fuel for the gas torch in the simulation and experiment. The temperature distribution on the steel plate and the flame region were first compared. The temperature increase caused by the flame concentration with the guide vanes was 65 °C. The transient and steady-state temperature distribution on the back side of the steel plate were then examined. The results showed good agreement between the simulation and experimental results. At steady state, the back-side temperature deviation of the steel plate between the numerical simulation and experimental results was approximately 4.9%. The effects of the equivalence ratio (Φ), Reynolds number (Re), and the downstream distance ratio of the combustion gas from the torch outlet to the steel plate (H/d) on the temperature distribution were also investigated. The highest temperature distribution was found in stoichiometric combustion. The temperature of the plate increased as the Reynolds number increased from 2368 to 4876 but decreased as the distance ratio (H/d) increased from 25 to 75. The guide vane angles at the gas torch outlet were from 30 to 60 degrees, and the angle of 40 degrees resulted in the highest temperature of the steel plate.

1. Introduction

Impinging flame jets are widely used in industrial applications, such as preheating steel before welding and glass processing. Jet impingement heat transfer has been well established as a high-performance technique for heating due to high heat transfer. It is essential to understand the heat transfer characteristics of a flame jet impinging on a steel plate. Various parameters have significant effects on the heat transfer characteristics of an impinging flame jet, including the ratio of the distance between the burner tip and the plate to the nozzle diameter (H/d), the Reynolds number (Re), and the equivalence ratio (Φ).
Experimental work on single impinging flame jets has been reported by Li et al. [1,2], Zhen et al. [3], Chander et al. [4], Katti et al. [5], Hindasageri et al. [6], Wei et al. [7], Zhao et al. [8], and Akram et al. [9,10]. These studies were conducted with experimental methods, and the local heat transfer distribution was presented. Many researchers have investigated the heat transfer characteristics of an impinging flame with a single nozzle through an analysis and numerical simulation method with computational fluid dynamics (CFD), such as Remie et al. [11], Sahu et al. [12], and Tajik et al. [13]. Liu et al. [14] and Zhen et al. [15,16] studied the effect of the hydrogen concentration on the heat transfer characteristics of a premixed liquefied petroleum gas (LPG) and hydrogen flame. The results showed that the flame temperature and NOx emission increased at high hydrogen concentrations but the CO emission decreased. They also compared the heat transfer between LPG-H2 and CH4-H2 mixtures and found that the heat transfer was enhanced for both mixtures when hydrogen was added. The heat transfer rate of the CH4-H2 mixture was higher than that of LPG-H2 for various hydrogen concentrations. Mohr et al. [17] studied the radial jet reattachment combustion (RJRC) flame with a single nozzle for metal heating to achieve high convective heat transfer and low values of impingement pressure coefficient. The RJRC flame was stable with a circumferentially symmetrical surface-temperature profile and low production of CO and NOx.
Swirling flows have been commonly used to improve mixing between fuel and air to achieve flame stabilization and enhance heat release. The heat transfer of an impinging flame jet with induced swirl was studied to obtain more uniform heat flux distribution by Singh et al. [18,19,20], Huang et al. [21], Zhao et al. [22], and Luo et al. [23]. Experiments showed that the local heat flux was higher at the stagnation point of the impinging plate with the swirling flame than that without swirl. This occurred because there was less unburned fuel around the stagnation region due to the swirling flow enhancing the air and fuel mixing. Agrawal et al. [24] investigated the effect of the inclination of the plate with respect to the horizontal direction. The investigated angles were 0, 10, and 30 degrees. The perpendicular impinging plate (0 degrees) had the highest local heat flux.
Multiple impinging flame jets have been adopted for both industrial and domestic heating applications. Jets with an array can help to enhance the heat transfer for heating a large surface area and to avoid local hot spots [25]. Multiple impinging flame jet studies on laminar combustion have investigated the effects of flame jet arrays [26,27,28,29,30]. Experiments revealed the effect of the parameters on the local heat flux distribution on an impinging plate. Interference between jets reduced the heat transfer rate in the interacting region at a small H/d ratio. For three jets, the highest heat transfer was found when both H/d and S/d (the ratio of the distance between two jets to the jet nozzle diameter) were around five [28,29].
Li et al. [31] simulated the combustion characteristics in four-point lean direct injection combustors with hydrogen and air. The total temperature increased rapidly at an axial distance and then increased slowly to the theoretical equilibrium temperature. Pantangi et al. [32], Muthukumar et al. [33], and Boggavarapu et al. [34] conducted experiments and CFD simulations to investigate the thermal efficiency as a function of the equivalence ratio for a burner with multiple jets. Wu et al. [35] did experiments on the characteristics of an array of RJRC flames at different nozzle spacings. A certain nozzle array produced lower NOx emissions, and the flame temperatures were higher inside the reattachment zone. Tajik et al. [36] performed a two-dimensional axisymmetric CFD simulation by using FLUENT software to find the heat flux and pressure coefficient. The results were in good agreement with the experimental data from Wu [35].
Comprehensive literature reviews reveal that multiple flame jets could enhance the uniformity of temperature distribution during preheating process. Unfortunately, most of the previous studies on impinging flame jets are on laminar combustion. However, most practical applications of impinging flame jets are related to turbulent combustion. In addition, during the preheating process, a pertinent guide vane angle at the outlet may have the possibility of enhancing the temperature distribution of a steel plate, but such a study has rarely been found. LPG is considered as a clean fuel compared with diesel and gasoline and has an advantage for achieving clean combustion with higher combustion efficiency and reduced pollutant emissions [9]. Therefore, LPG was used as a fuel for the gas torch in this study.
The objectives of this study are to examine the effect of guide vanes on enhancing the steel plate temperature during a preheating process and to investigate the trends of the temperature distribution with respect to the angle of the guide vanes at the outlet of the torch. A numerical simulation was done using ANSYS FLUENT 18.2 for impinging flame jets with an LPG/air mixture as the fuel, turbulent combustion, and an array of premixed flame jets. An experiment was also done for the validation of the simulation results. The temperature distribution on the back side of the steel plate during the preheating process was examined in terms of the equivalence ratio (Φ), Reynolds number (Re), and the ratio of the torch outlet distance to the nozzle diameter (H/d). Optimization of the guide vane angle was then carried out to achieve the highest steel plate temperature.

2. Steel Preheating Process and Numerical Simulation

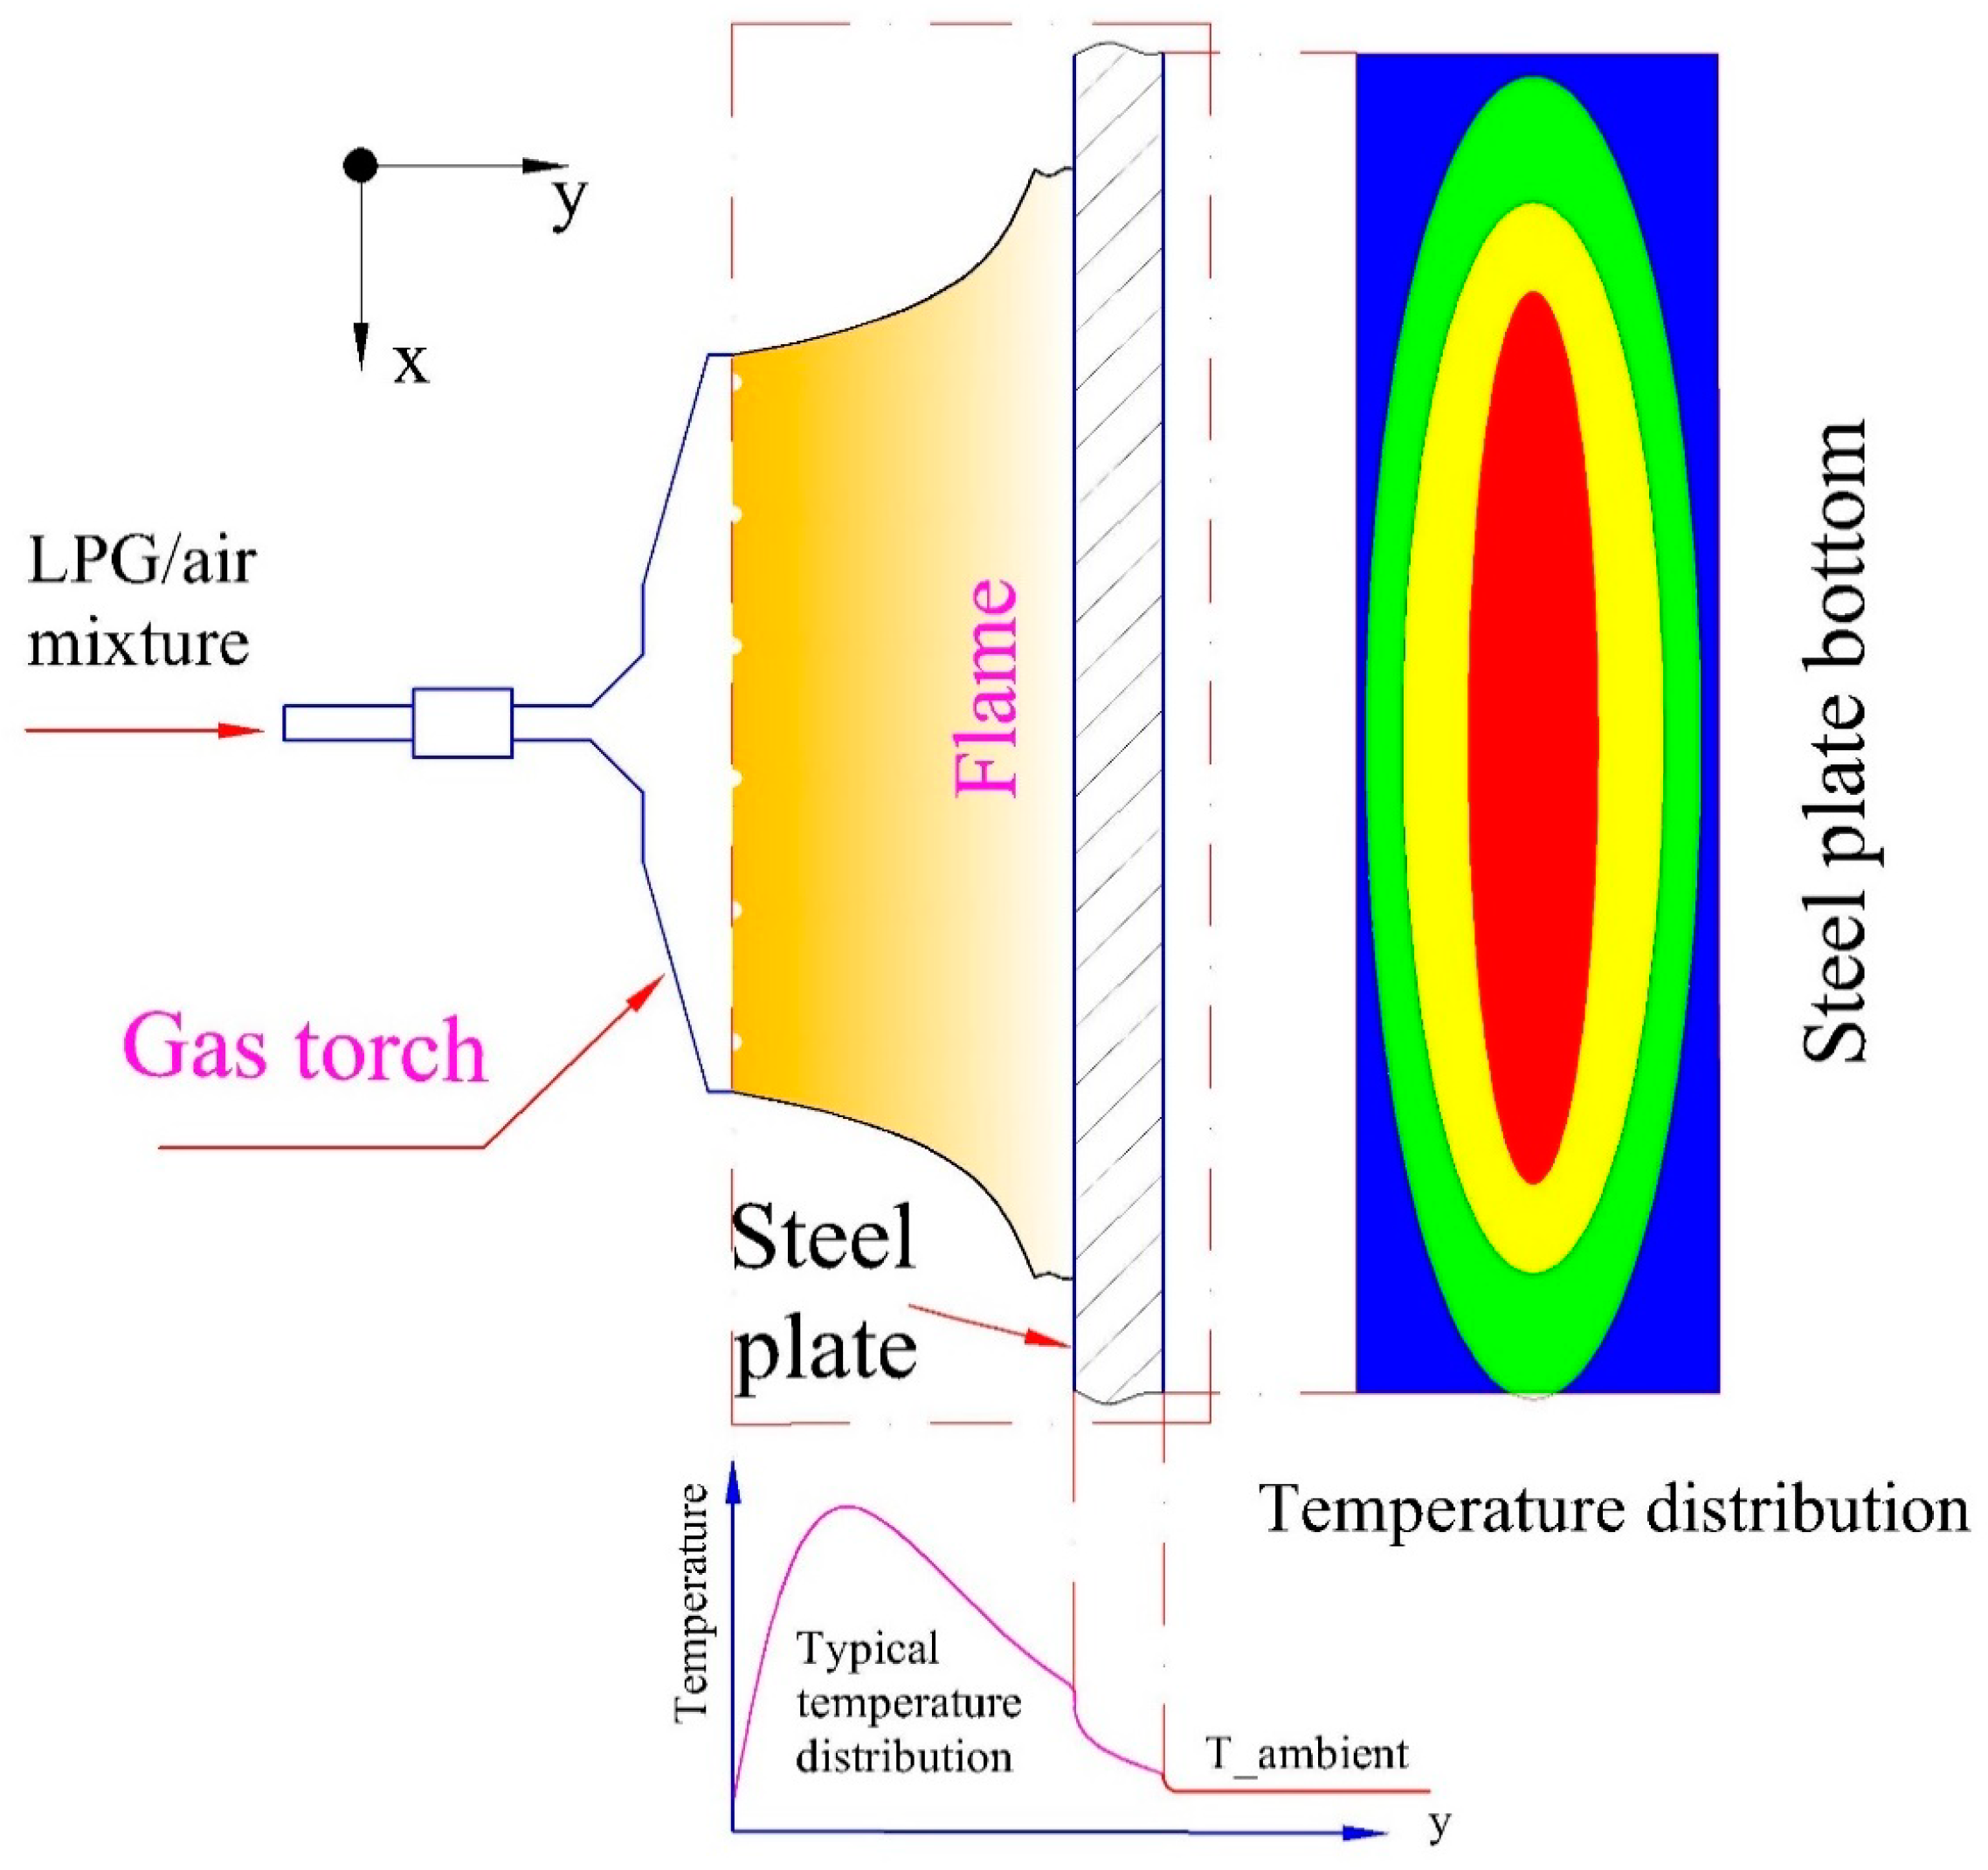
2.1. Description of Steel Preheating Process

Figure 1 shows the steel preheating with a gas torch, the expected results of the flame temperature, and the steel plate temperature. The fuel and air are mixed together in the gas torch for combustion. The mixture of the fuel and air after leaving the exits of the gas torch is ignited, and then the combustion flame is used for preheating the steel plate. The hole diameter of the gas torch outlet and the distance from the gas torch outlet to the steel plate are denoted as d and Y, respectively. The plate has a width of 0.8 m, length of 1.5 m, and thickness of 0.02 m.

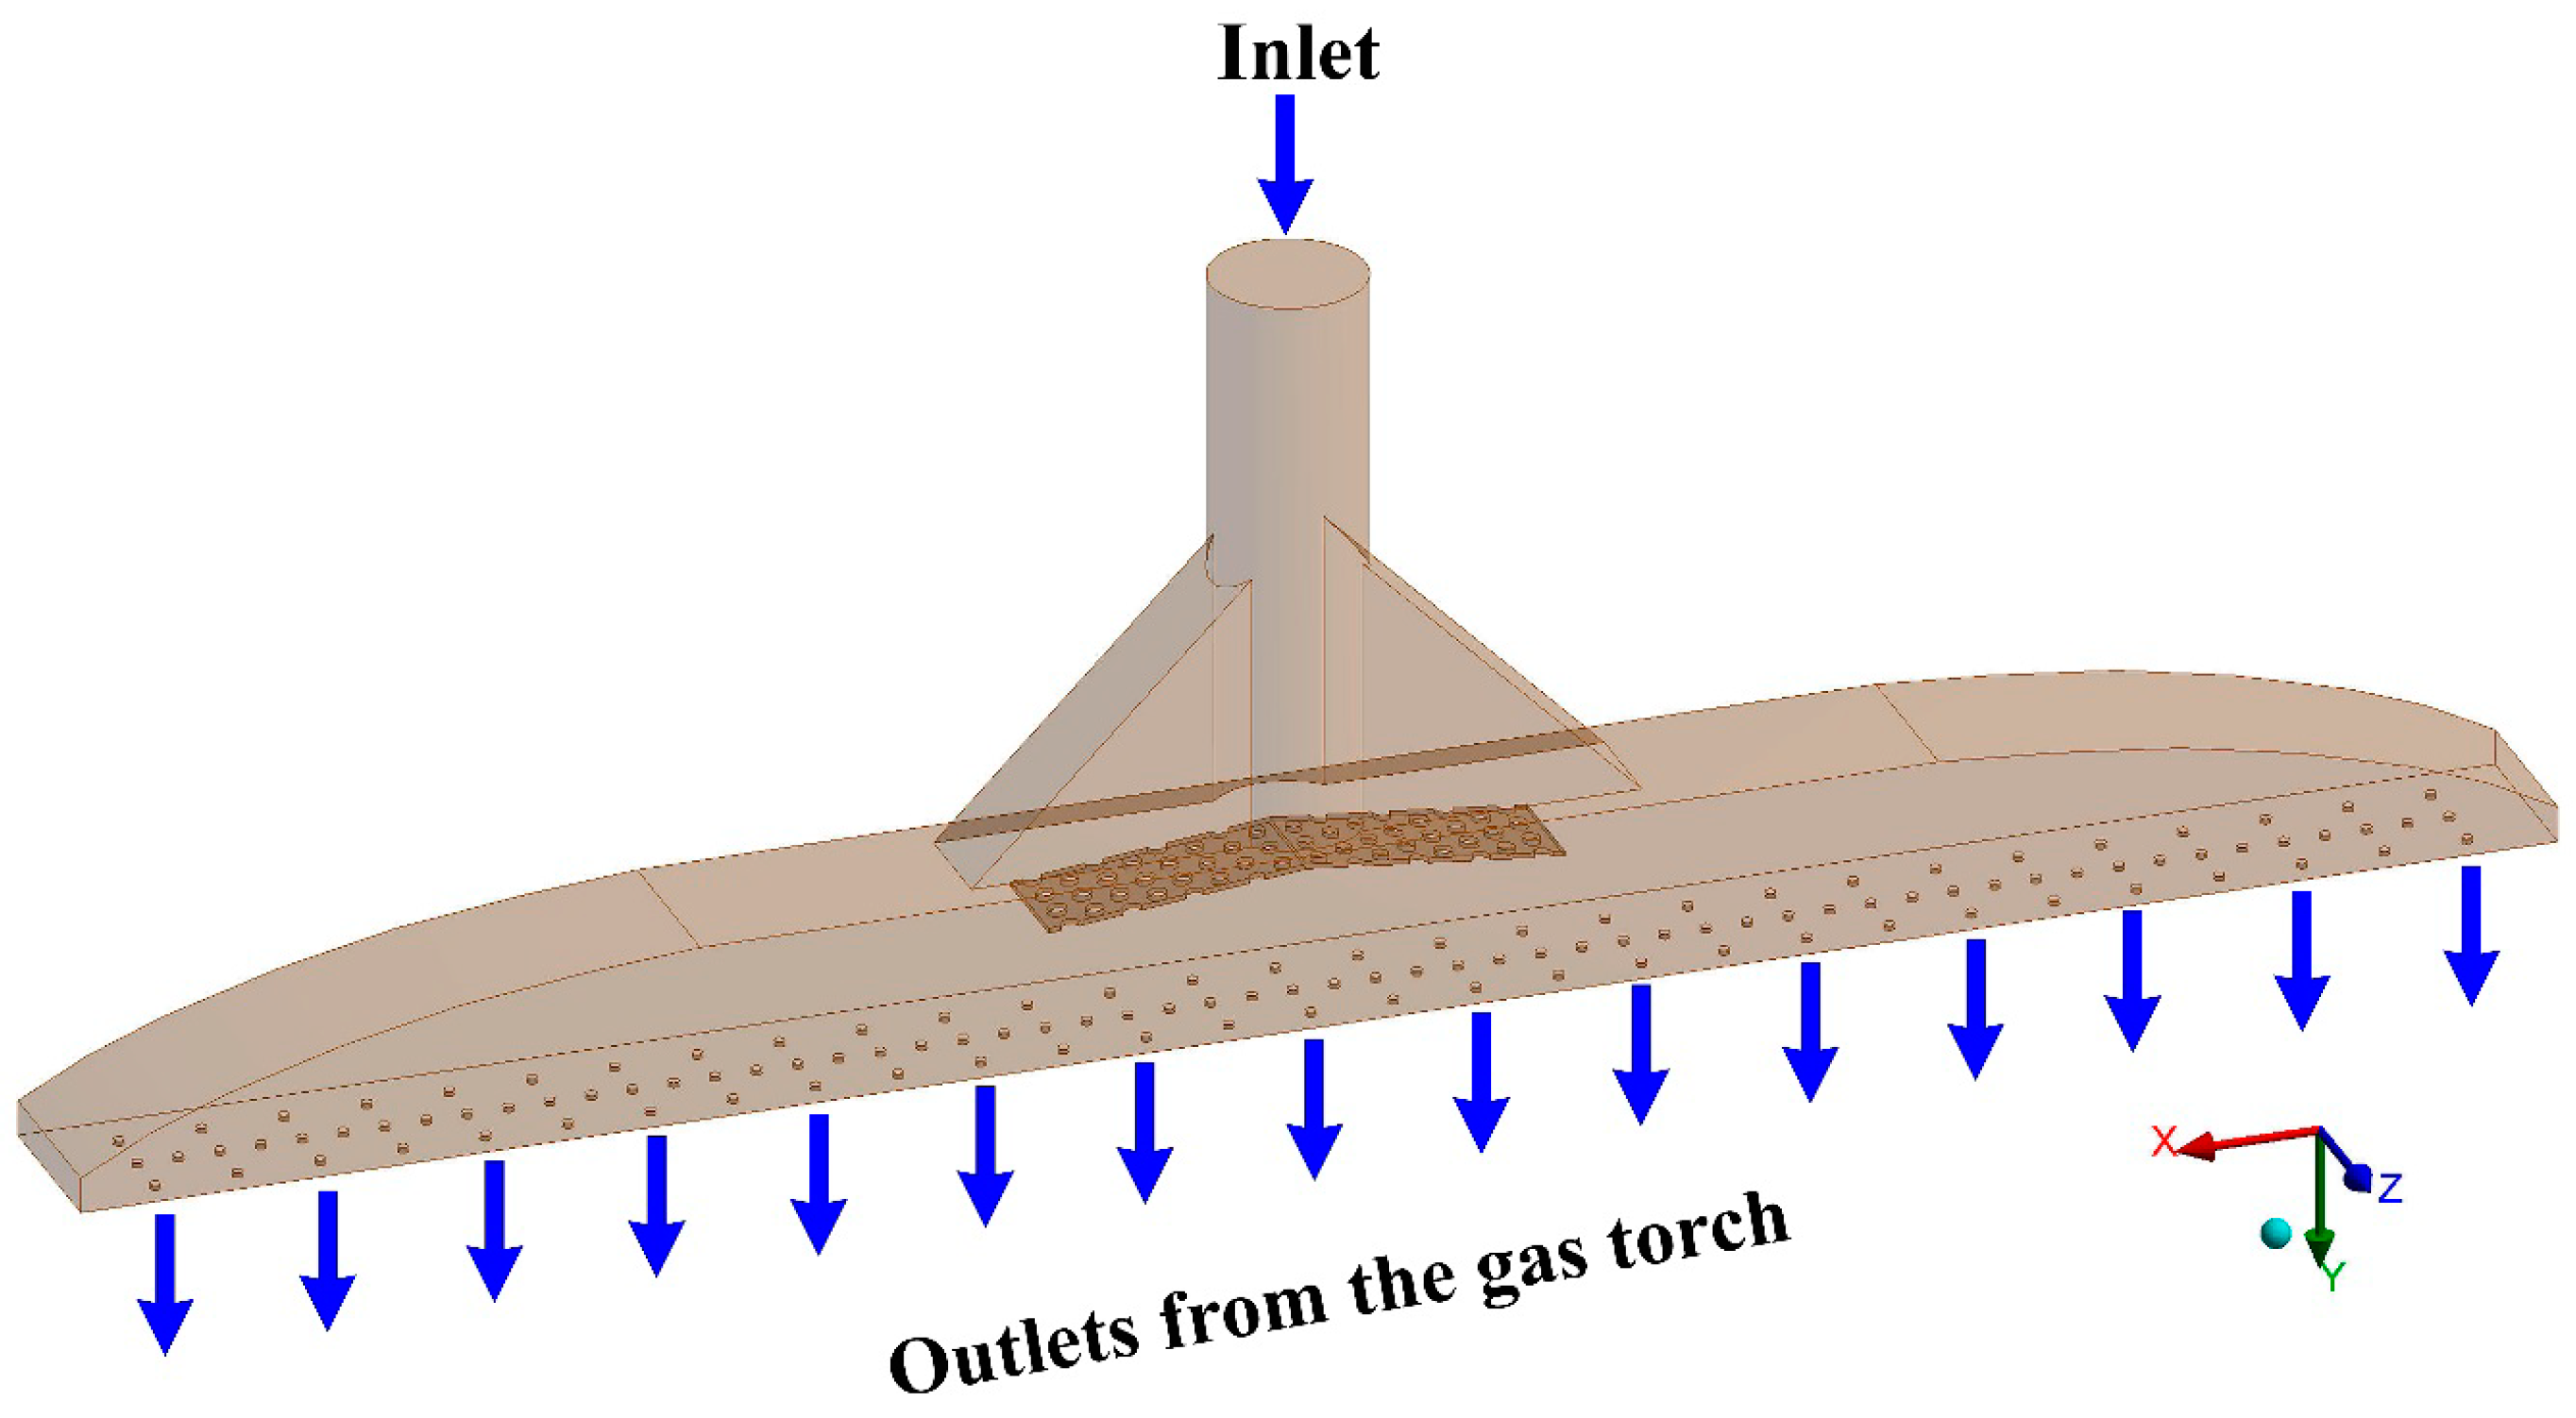
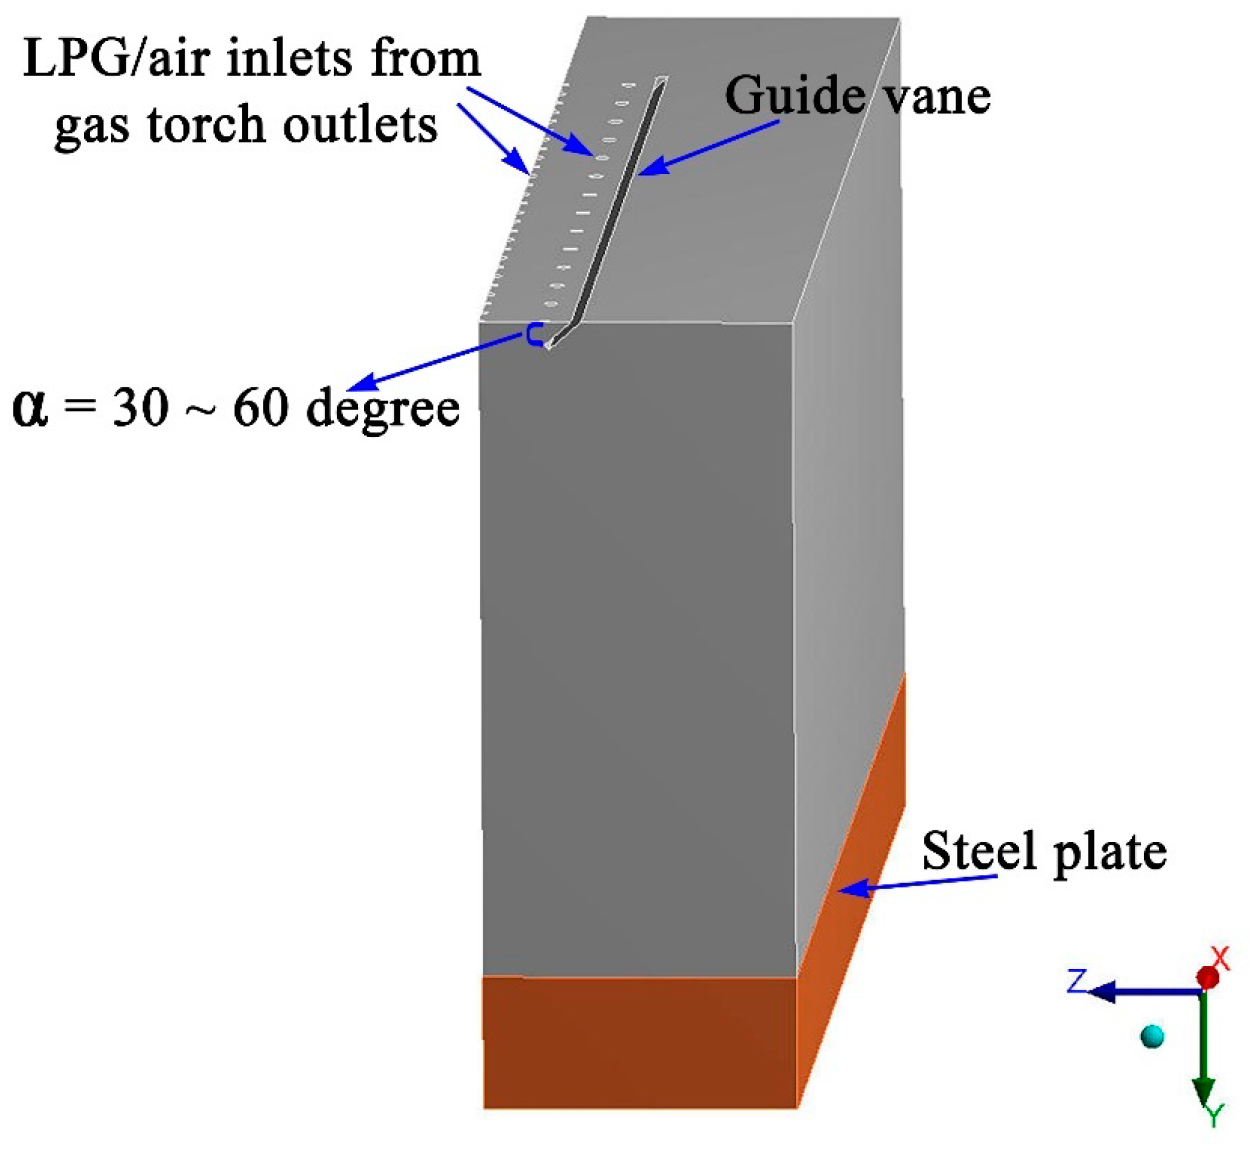
2.2. Three-Dimensional Gas Torch Model

A schematic diagram of the gas torch is shown in Figure 2. The gas torch is made of stainless steel and consists of one inlet and multiple outlets. The cylindrical inlet tube has a diameter of 35 mm and is connected to a rectangular block with 115 exit holes on the outlet surface. Each exit hole diameter is 2 mm. The LPG/air mixture enters the cylindrical tube and leaves the rectangular block through the holes. The mixture is then ignited, and the flame generated at the outlets preheats the steel.

2.3. Numerical Simulation

2.3.1. Mathematical Model

The governing equations include the continuity, momentum, energy, and species conservation equations, which were solved by ANSYS FLUENT 18.2 [37]. Multiple simultaneous chemical reactions can be modeled with reactions occurring in the bulk phase (volumetric reactions). To solve these conservation equations for chemical species, ANSYS FLUENT predicts the local mass fraction of each species, Yi, through the solution of a convection and diffusion equation for the ith species.
Continuity equation:
ρ t + . ( ρ u ) = 0
Momentum equation:
( ρ u ) t + . ( ρ u u ) = p + . ( μ + μ t ) [ ( u + u T ) 2 3 . u I ]
Energy equation:
t ( ρ E ) + . ( u ( ρ E + p ) ) = . ( k T j h j J j ) + S h
Equation (3) shows the energy transfer in a control volume. The first term on the left-hand side represents the energy change in transient state. The second term on the left-hand side represents the energy transfer due to convection. The two terms on the right-hand side represent the net energy transfer around the control surface due to conduction heat transfer and species diffusion. The last term is a source term that includes chemical reaction, radiation, and so on.
For a multi-component mixing flow, the transport of enthalpy due to species diffusion can have a significant effect on the enthalpy field and should not be neglected.
. [ j = 1 n h j J j ]
The turbulence kinetic energy k and the rate of its dissipation ε are obtained from the following transport equations:
k t + x i ( ρ k u i ) = x j [ ( μ + μ t σ k ) k x j ] + G k ρ ε
ε t + x i ( ρ ε u i ) = x j [ ( μ + μ t σ ε ) ε x j ] + C 1 ε ε k G k C 2 ε ρ ε 2 k
The turbulent viscosity is modeled as
μ t = ρ C μ k 2 ε
The production of the turbulence kinetic energy is defined as
G k = ρ u i u j ¯ u j x i
The model constants C1ε, C2ε, Cµ, σk, and σε have default values of C1ε = 1.44, C2ε = 1.92, Cµ = 0.09, σk = 1.0, and σε = 1.3.
The species conservation equation is
t ( ρ Y i ) + . ( ρ u Y i ) = . J i + R i
where Ri is the net rate of production of each chemical species. In turbulent flows, the mass diffusion is computed as follows:
J i = ( ρ D i , m + μ t S c t ) Y i D T , i T T
where Sct is the turbulent Schmidt number, and the default value is 0.7. Turbulent diffusion generally overwhelms laminar diffusion, and it is generally not necessary to specify the detailed laminar diffusion properties in turbulent flows. The turbulent–chemistry interaction model combines turbulent flow and complex chemical kinetics. Turbulence enhances the mixing of the reactants. The chemical reaction involves the temperature rise, changes the density, and affects the flow itself. Therefore, the coupling between turbulence and chemical reactions plays a crucial role in turbulent reactive flows.
ANSYS FLUENT provides a turbulence–chemistry interaction model called the eddy-dissipation model (EDM), which is based on the work of Magnussen and Hjertager. The net rate Ri,r of the production of species i due to reaction r is given by the smaller of the results of the two equations below:
R i , r = v i , r M w , i A ρ ε k Y R v R , r M w , R
R i , r = v i , r M w , i A B ρ ε k P Y P j N v j , r M w , j
where:
  • v′i,r is the stoichiometric coefficients for reactant i in reaction r
  • v″j,r is the stoichiometric coefficients for product i in reaction r
  • Mw is the molecular weight (kg/kmol)
  • k is the turbulence kinetic energy rate (J/kg)
  • ε is the turbulent dissipation rate (m2/s3)
  • YP is the mass fraction of product species, P
  • YR is the mass fraction of a particular reactant, R
  • A is an empirical constant equal to 4.0
  • B is an empirical constant equal to 0.5
The reaction rates were assumed to be controlled by the turbulence, so the Arrhenius chemical kinetic calculations can be neglected.

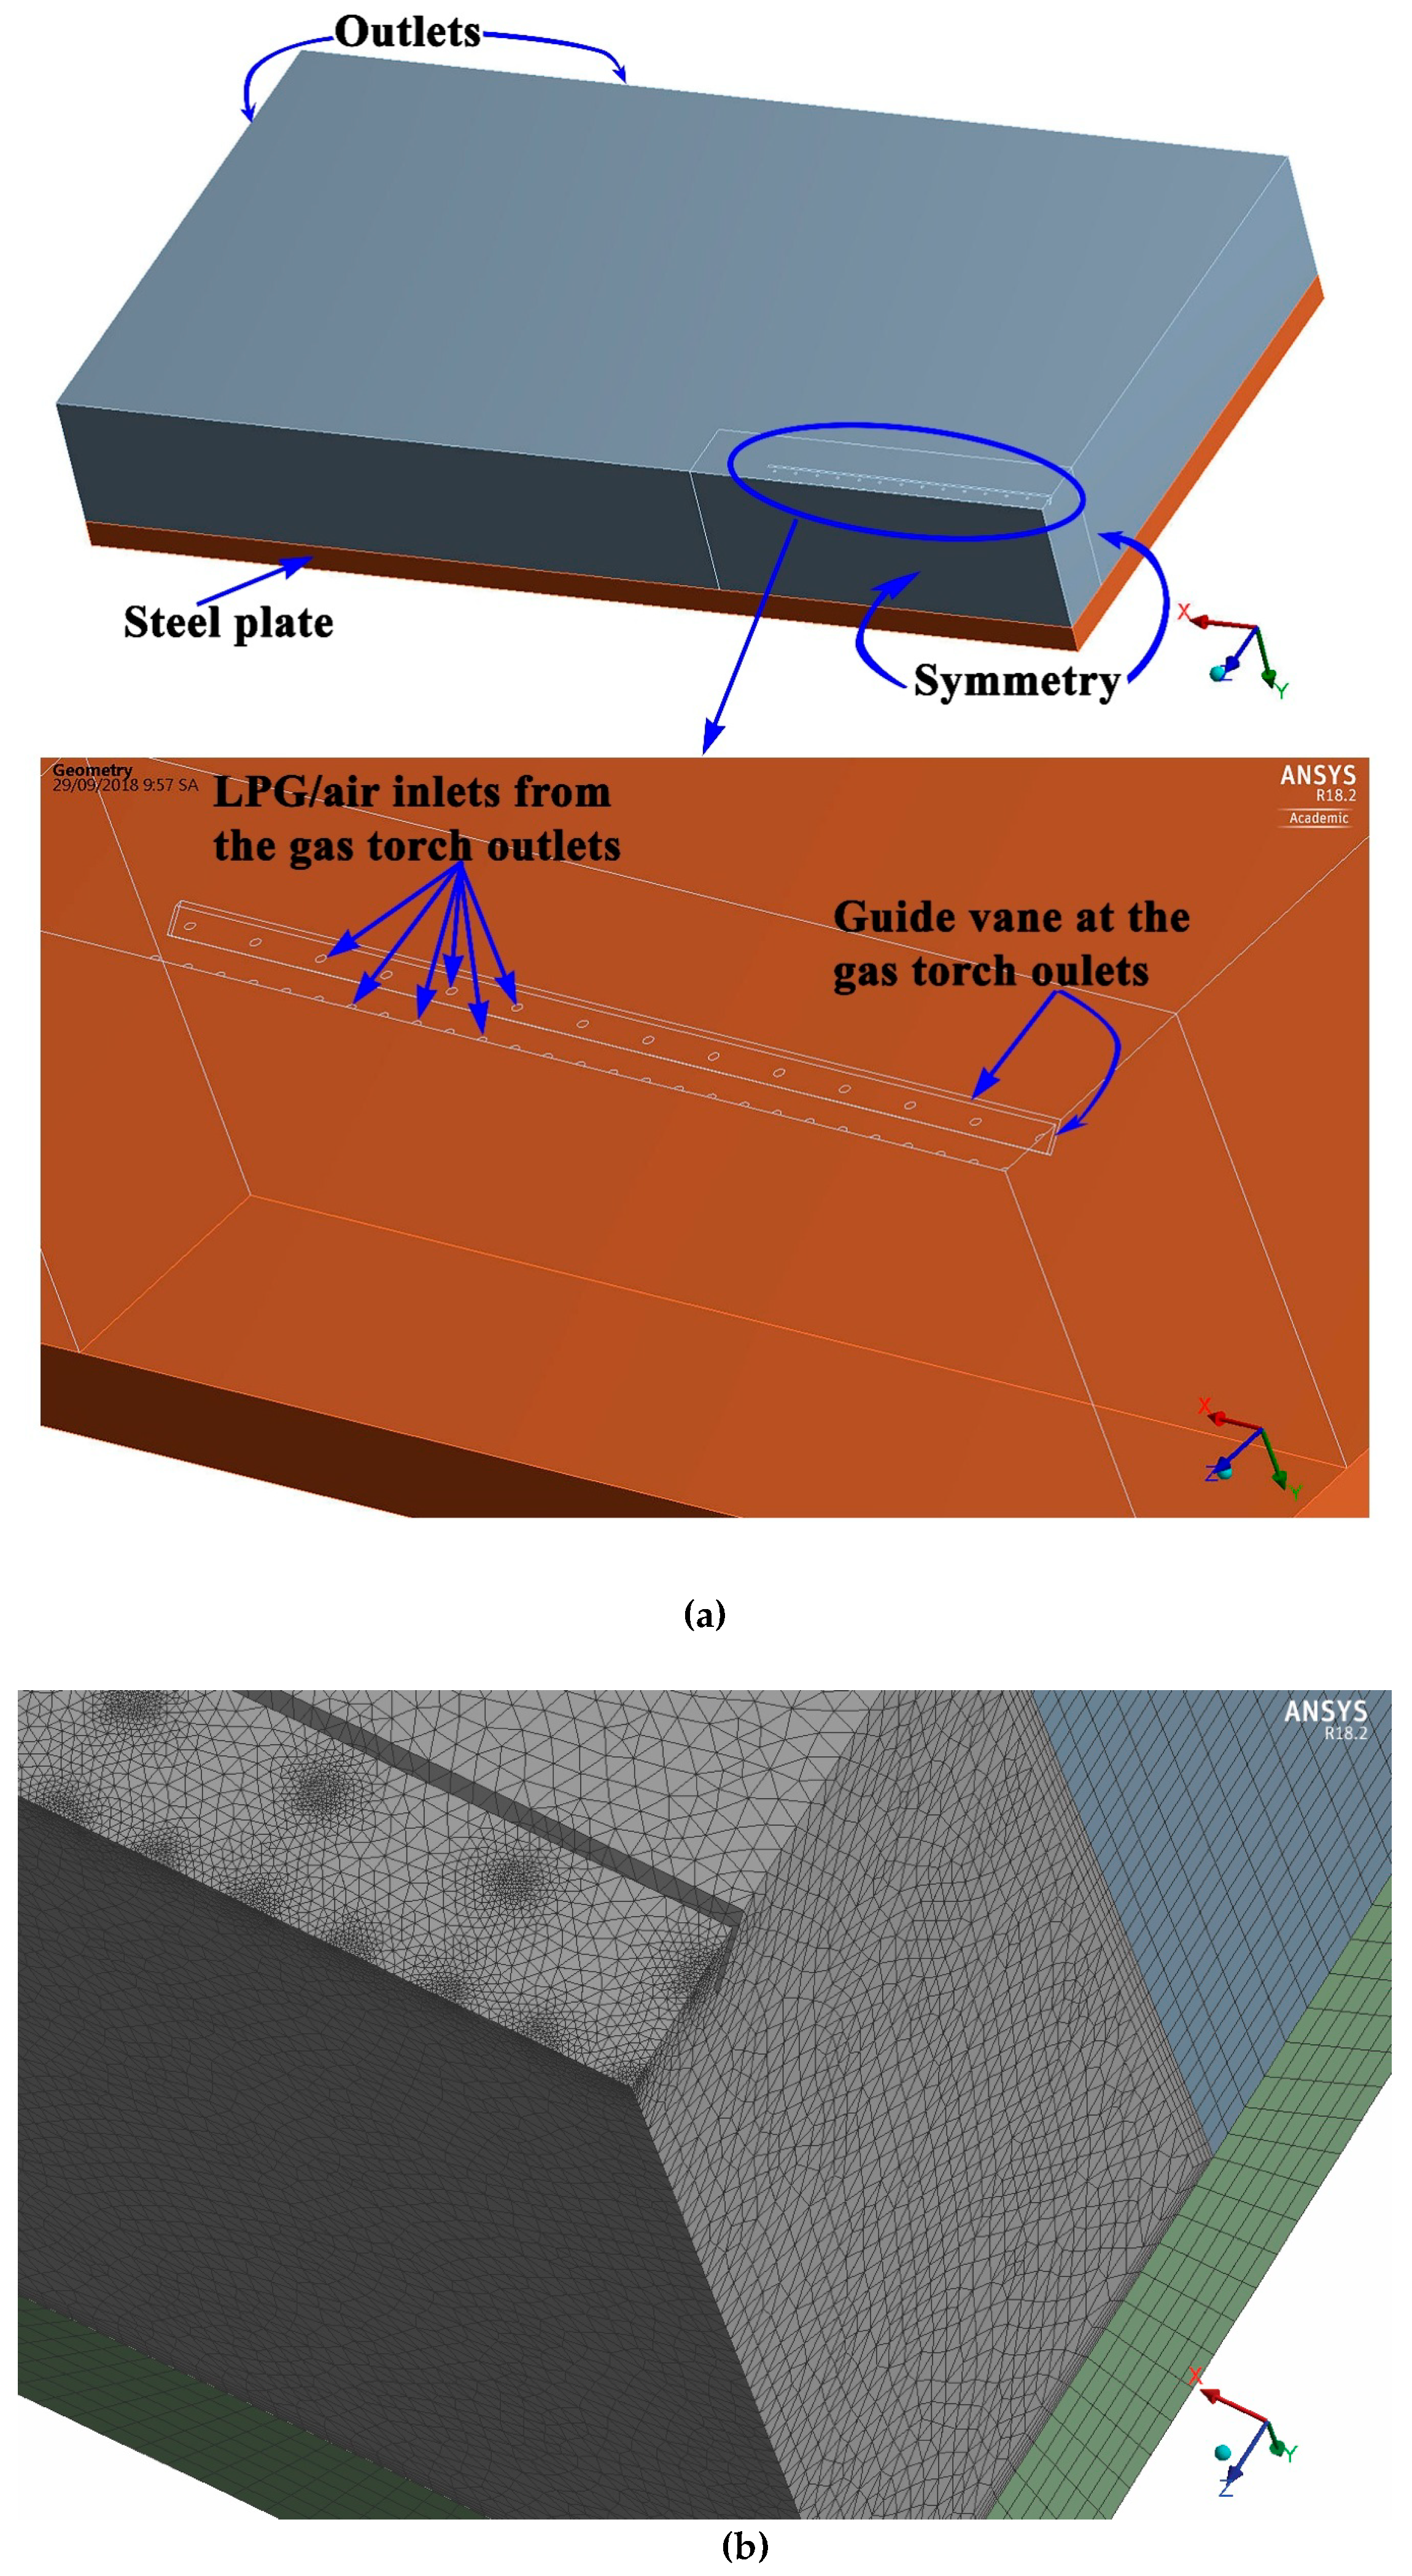
2.3.2. Boundary Conditions and Numerical Simulation

One quarter of the computational domain from the gas torch outlet to the steel plate is shown in Figure 3a. The boundary conditions and numerical simulation method are shown in Figure 3 and Table 1. Due to the symmetry of the full model, the quarter model was used for the simulation to reduce the computation time, as shown in Figure 3a. Symmetric boundary conditions were selected at the two inner surfaces for both the fluid and steel domains. The two outer faces were set to the pressure outlet boundary conditions. The velocity boundary conditions of the jet holes were used for the LPG/air inlet. The other top surfaces were treated as ambient air inlets except at the LPG/air inlet. No-slip conditions were selected for the wall boundary conditions imposed on the impinging jet.
Transient and steady-state numerical simulations were performed using ANSYS FLUENT based on finite volume discretization. Double precision was used to improve the accuracy of the results. For more accuracy, the second-order upwind scheme was selected for the discretization of non-linear equations such as the mass, momentum, energy, and species transport equations. The SIMPLE algorithm was adopted for coupling the pressure and velocity. A convergence criterion of 10−4 was set for the momentum, continuity, turbulence, and species equations, and a criterion of 10−6 was used for the energy equation.
The high flame temperature during the combustion process was associated with radiation heat transfer to the environment, which is considered significant [38,39]. The discrete ordinates (DO) radiation model was used to examine the effect of radiation. The DO model covers the entire range of optical thickness and can solve problems ranging from surface-to-surface radiation to the radiation in combustion problems. The boundary conditions for the DO radiation model are selected by default in ANSYS FLUENT 18.2 [37]. The absorption coefficient is modeled using the weighted sum of gray gases model (WSGGM). The DO equation has the following form:
· ( I ( r , s ) s ) + ( a + σ s ) I ( r , s ) = a n 2 σ T 4 π + σ s 4 π 0 4 π I ( r , s ) ϕ ( s , s ) d Ω
where:
  • r is the position vector
  • s is the direction vector
  • s is the scattering direction vector
  • a is the absorption coefficient
  • n is the refractive index
  • σ s is the scattering coefficient
  • σ is the Stefan–Boltzmann constant (5.669 × 10⁻⁸ W.m−2.K−4)
  • I is the radiation intensity
  • T is the local temperature
  • ϕ is the phase function
  • Ω is the solid angle
Equation (13) shows that the net radiation intensity around a control volume (the first term on the left-hand side) is equal to the sum of the extinction (the second term on the left-hand side), emission (the first term on the right-hand side), and the scattering term (the second term on the right-hand side).

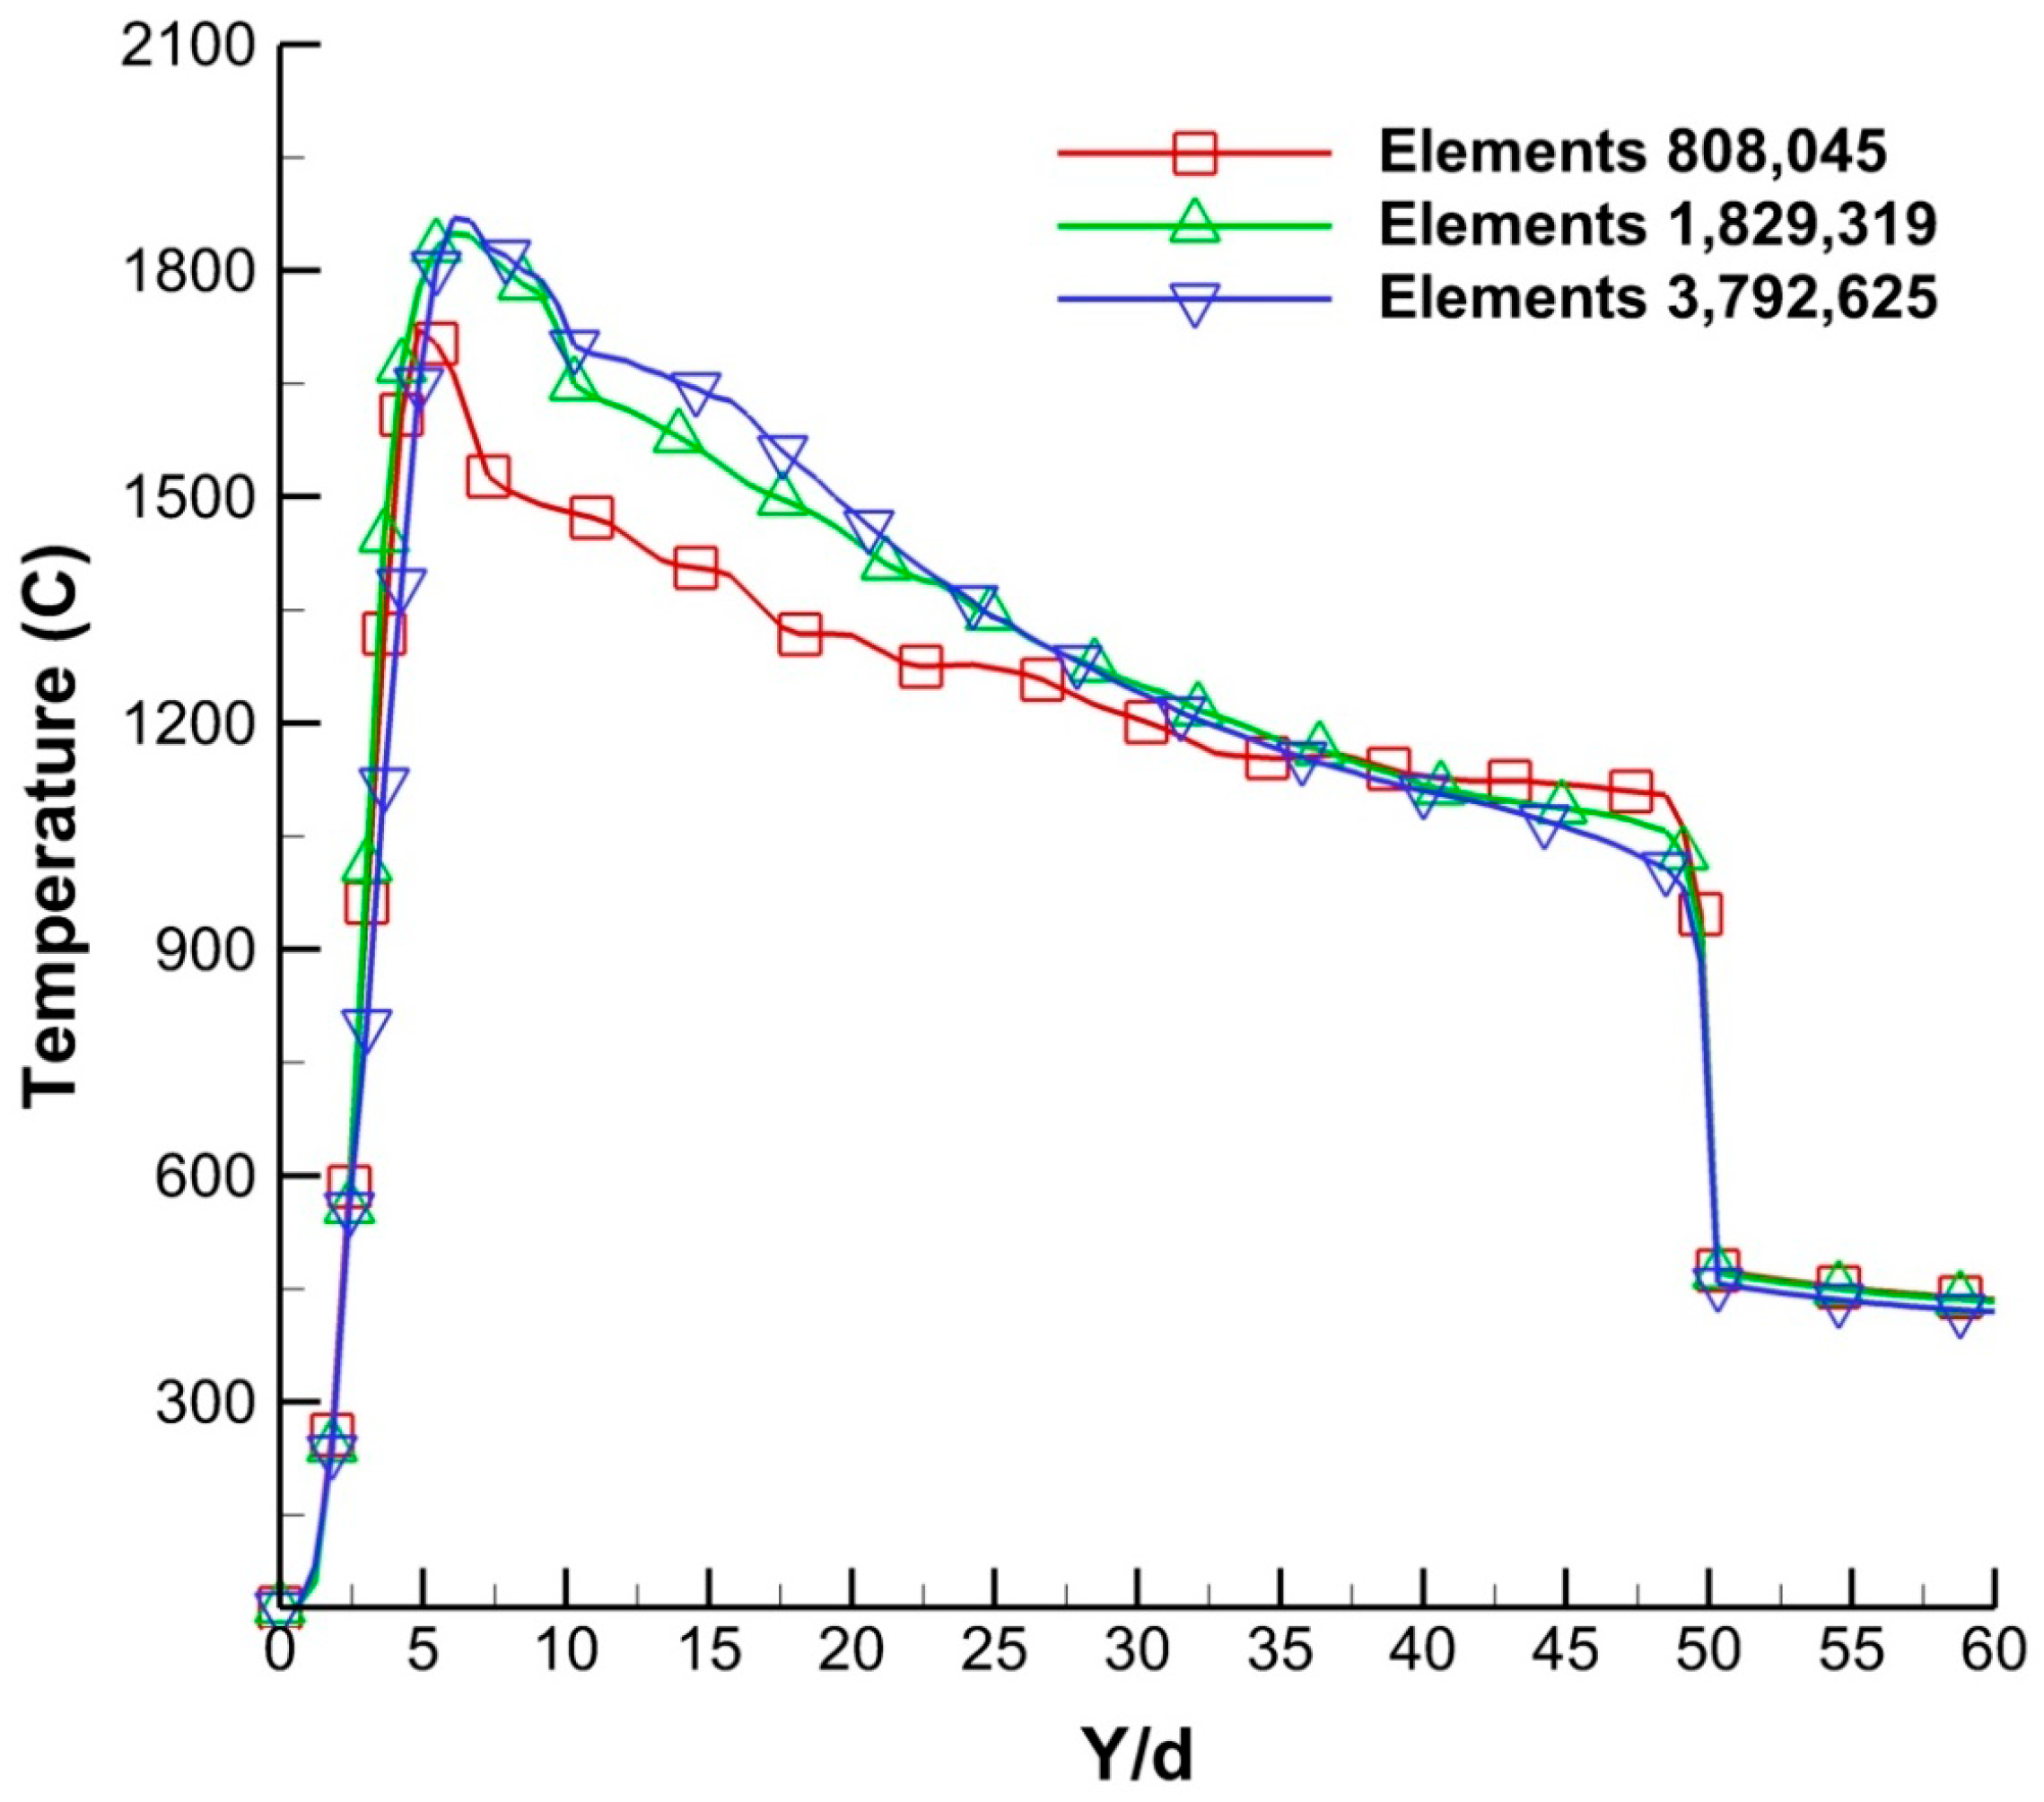
2.3.3. Grid Independence Check

The grid independence of the solution was checked for three numbers of elements: 808,045, 1,829,319, and 3,792,625. The inlet temperature of the fuel/air mixture was 27 °C (300 K). A gauge pressure outlet of 0 Pa was set as the ambient air pressure. The grid independence was checked for using Φ = 1, Re = 3483, and Y/d = 50. A convergence criterion of 10−4 was set for the momentum, continuity, turbulence, and species equations, and a criterion of 10−6 was used for the energy equation.
The temperature distribution is plotted as a function of the y-directional distance between the gas torch and the steel plate in Figure 4. The medium and largest members of elements showed similar trends. In contrast, the temperature distribution with the fewest elements presented a larger difference. The flow temperature deviation between the medium and largest amounts of elements was less than 3%. Therefore, the medium number of 1,829,319 was selected to save calculation time for the simulation.

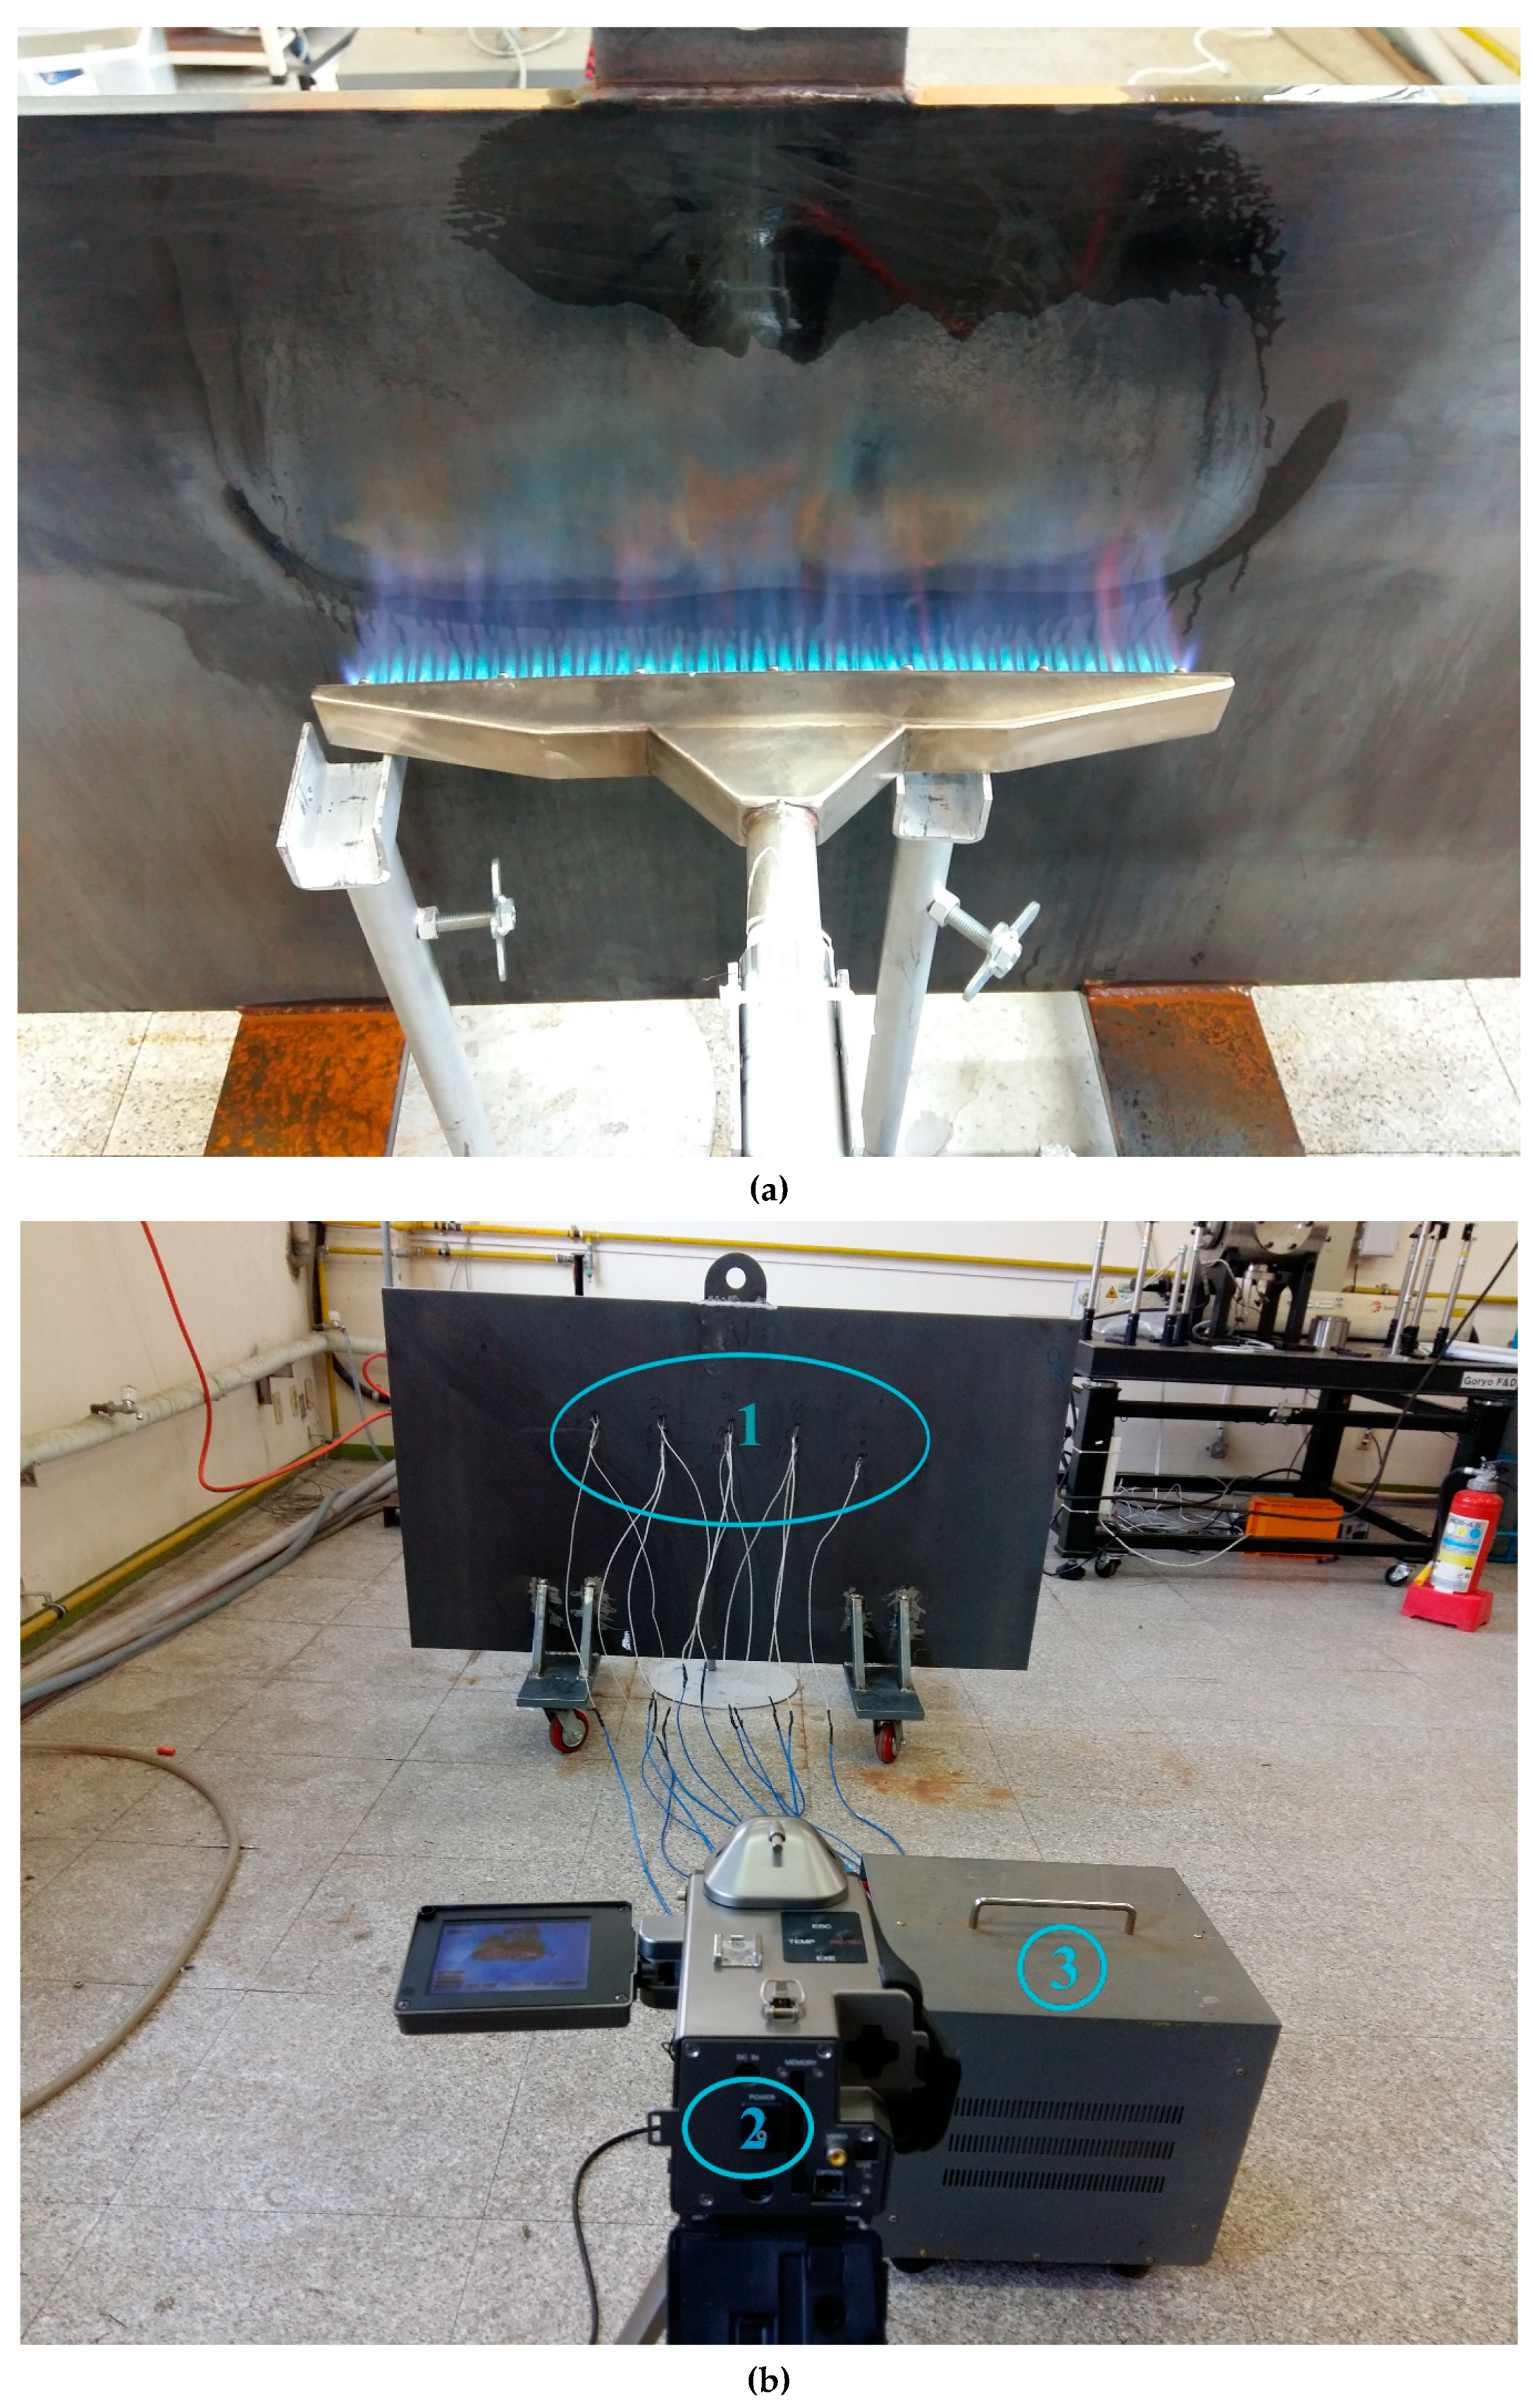
3. Experimental Validation

An experiment was carried out to validate the numerical simulation results. The designed experimental apparatus is shown in Figure 5. The operating variables of the LPG/air mixture for the experimental process included an equivalence ratio (Φ) of 1.0, Reynolds number (Re) of 3483, and H/d of 50. Figure 5a shows that the LPG/air mixture was ignited to start the preheating process after exiting the outlet of the gas torch. The temperature distribution of the steel plate was measured by a TVS-200EX infrared camera, as shown in Figure 5b. The camera image of the temperature distribution can cover a wide range of the heating region of the steel plate, but temperatures were also measured by thermocouples and used as a reference. The TVS-200EX infrared camera was selected for its advantages of a wide measurement range and good accuracy that are suitable for the present study.

4. Results and Discussion

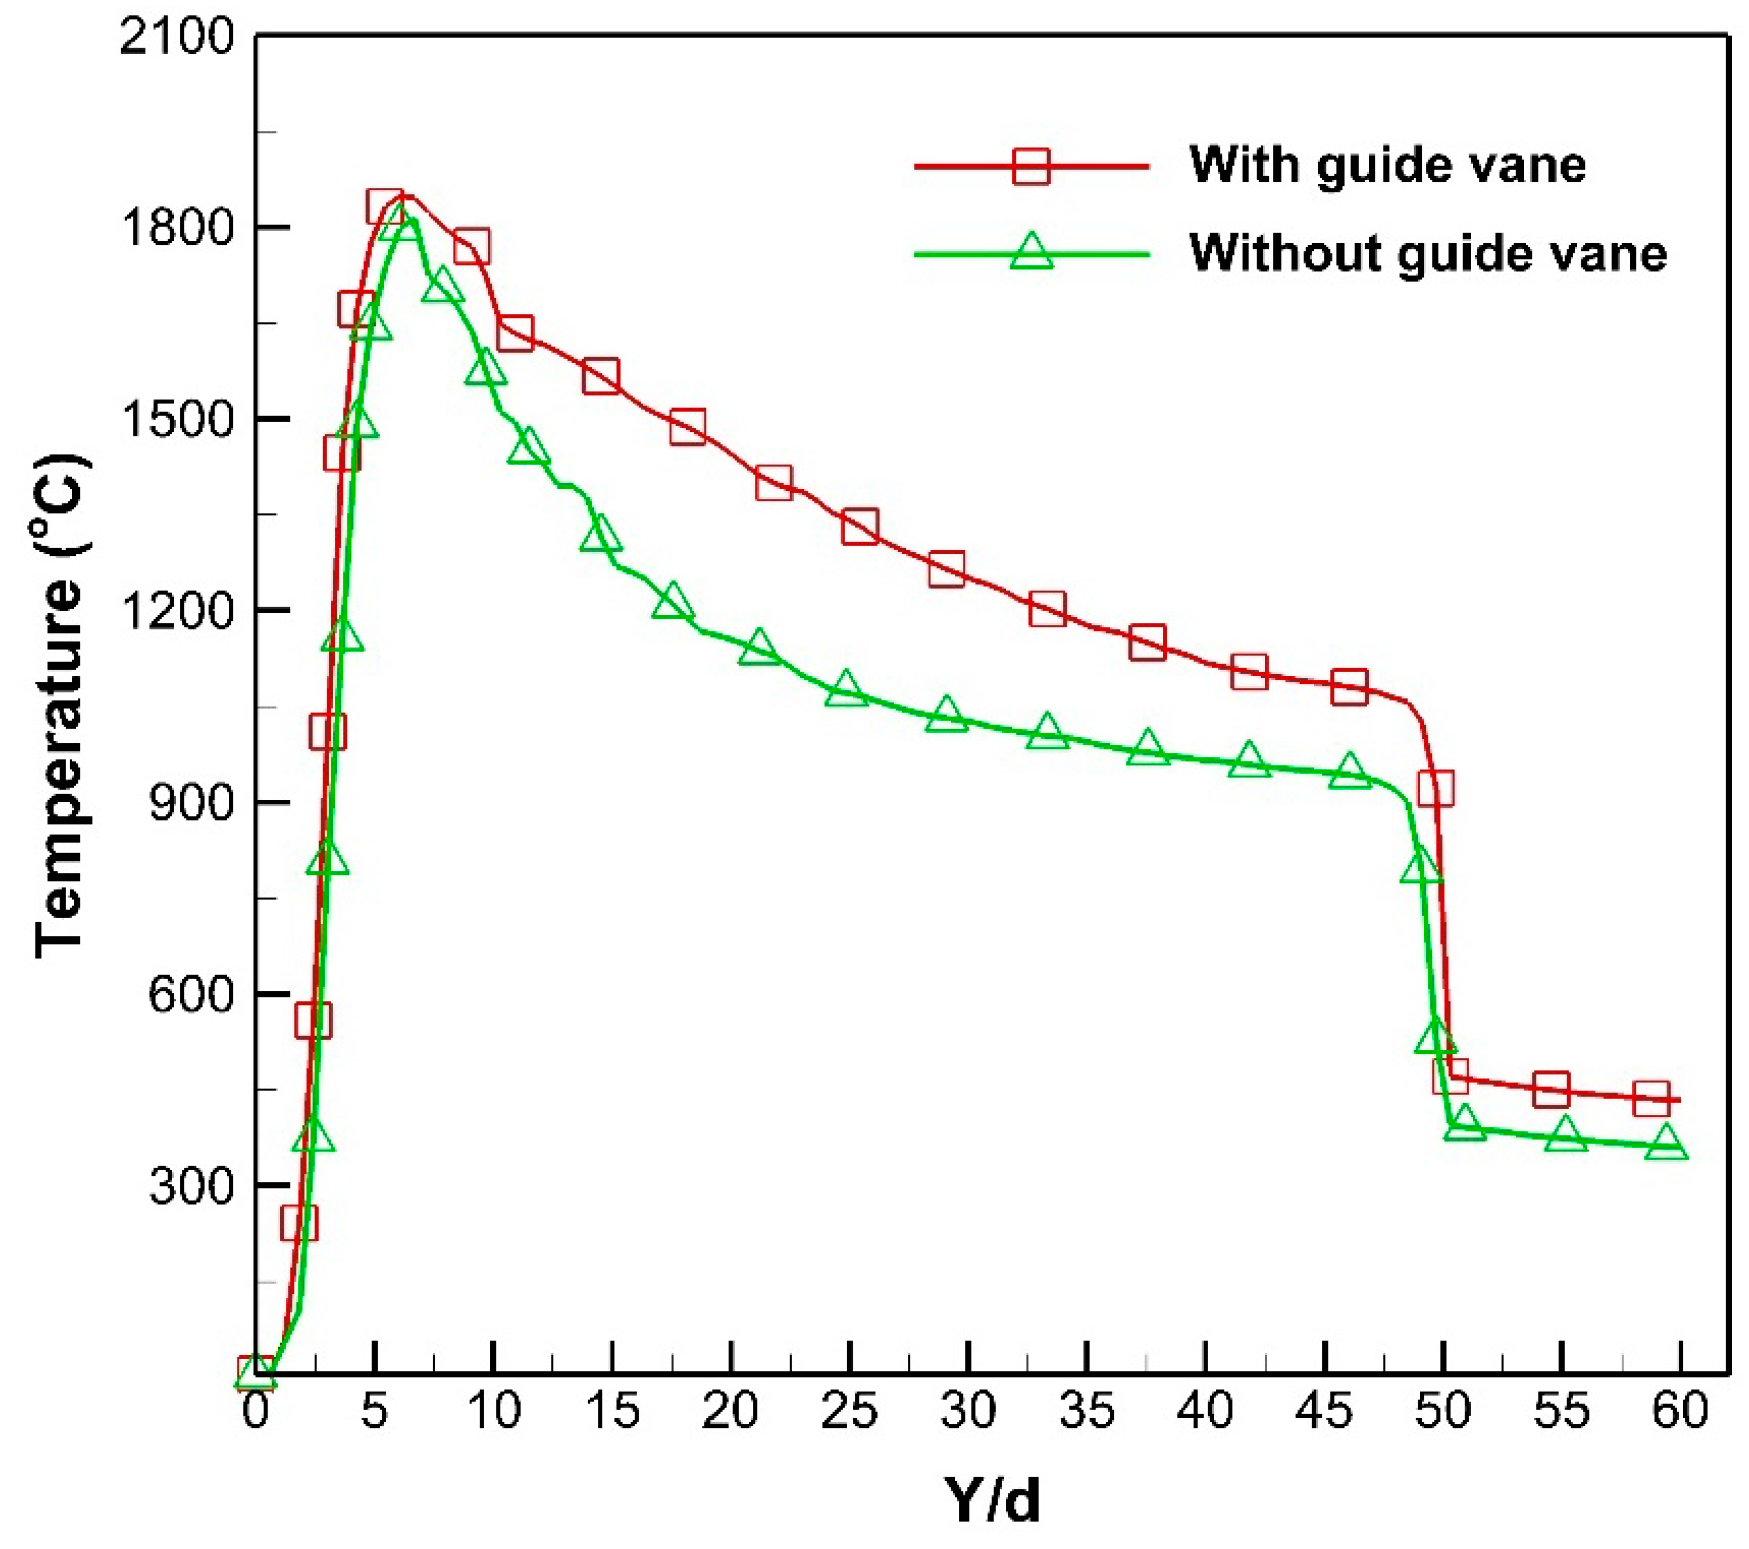
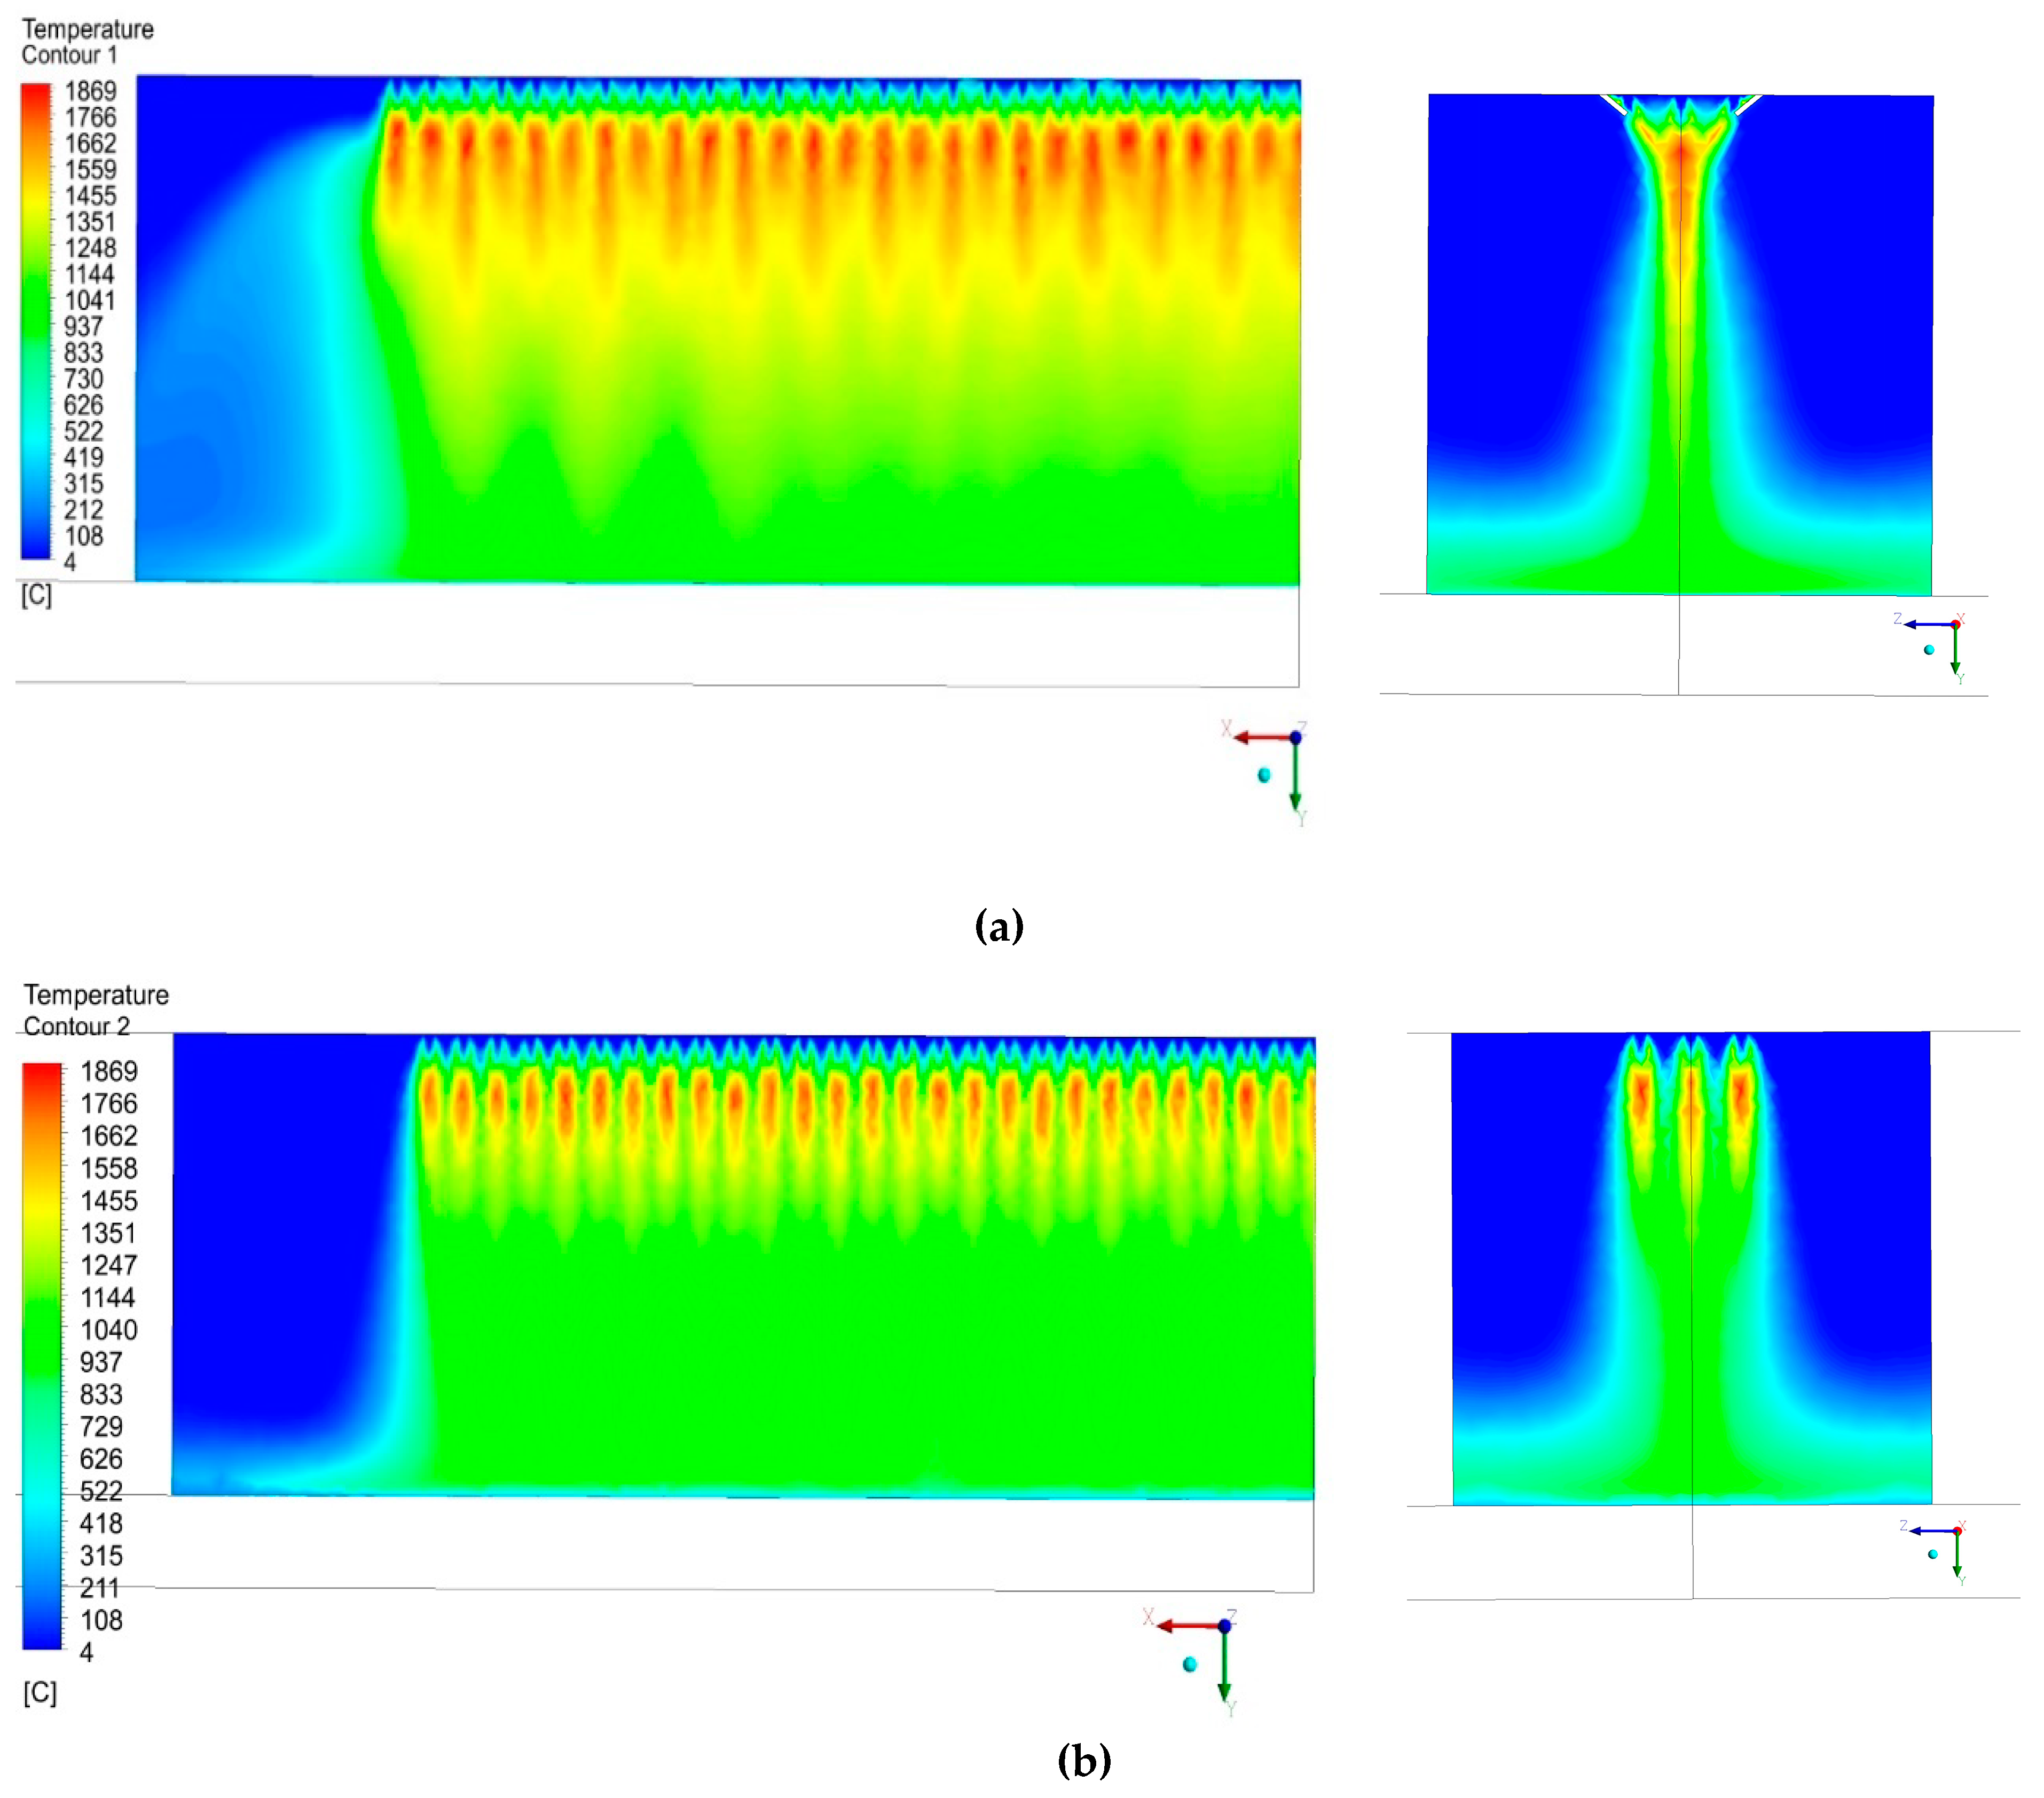
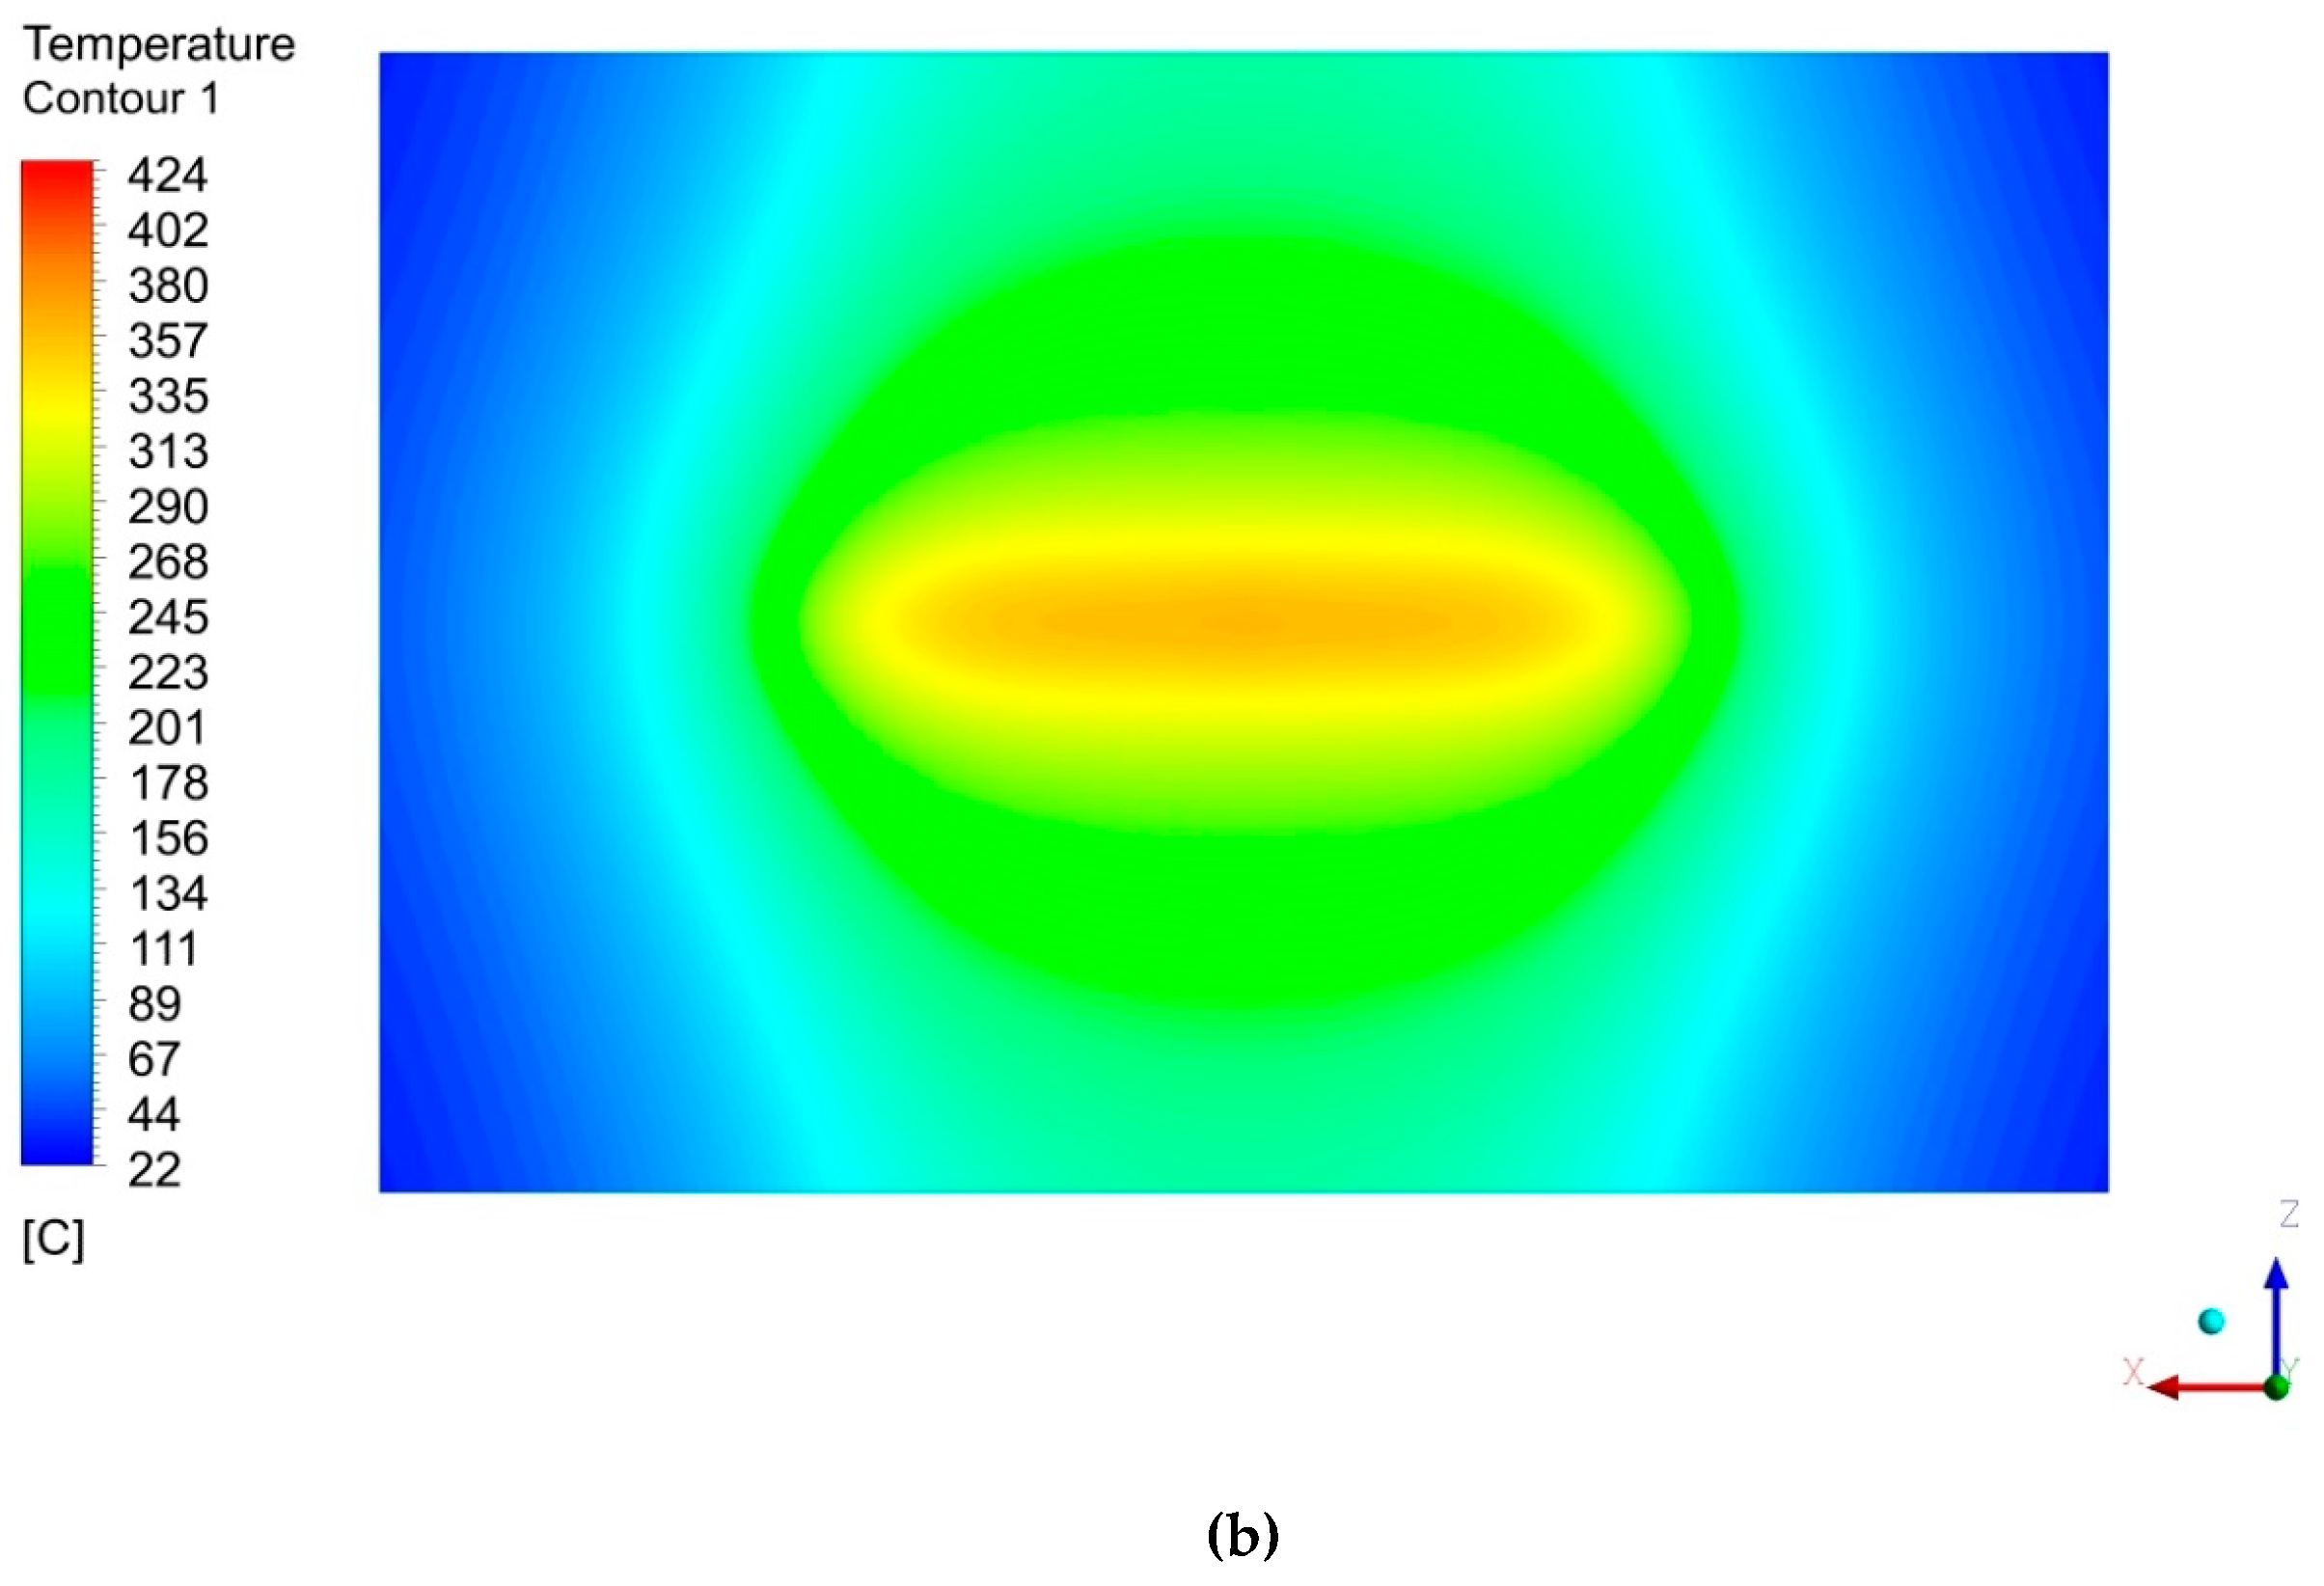
4.1. Comparison of Flame Structure and Steel Plate Temperature Distribution of the Models with and Without Guide Vane

Figure 6 shows a comparison of the temperature distribution of the two models with and without the guide vanes for the region from the gas torch outlet to the steel plate. The maximum temperatures for the two cases were approximately the same when the reactant mixture is ignited. But the decrease in the gas flame temperature without the guide vanes was larger (Y/d = 5–50) than that with the guide vanes. Furthermore, the temperature with the guide vanes inside the steel plate (Y/d = 50–60) was higher than that without the guide vanes, as shown in Figure 6. This is due to the guide vanes reducing the heat loss more because the two sides of the flame jets (see Figure 7a (right)) protect against radiation and convection heat loss.
The steel preheating process was conducted with an LPG/air mixture for combustion, and the temperature contours of the center view and side view section are presented in Figure 7. Due to the high speed of the outlet jet, the ambient air is entrained in the flame zone and participates in the combustion process. The primary jet line at the center line of the gas torch is associated with the main combustion process. On the side view, due to the guide vanes at the outlet, the two secondary jet lines located at the two outer sides are concentrated and enhance the plate temperature when the combustion happens. However, for the other model without guide vanes, the flame from the jet holes directly impinges on the steel plate without being focused, as shown in Figure 7b (right).
The temperature contours at the steel plate bottom for two models (with and without guide vane) are shown in Figure 8. Due to the focused flame, the highest temperature at the bottom of the steel plate was 424 °C for the model with guide vanes and 359 °C for the model without guide vanes. The temperature difference between the two models was 65 °C. Therefore, by using the guide vanes to focus the flame, the temperature of the steel plate was significantly enhanced.
Figure 9 shows the simulation results of the species mole fraction and temperature variations of the stoichiometric LPG/air mixture with respect to the main jet flow direction. Before combustion, in the unburned mixture at 27 °C (300 K), the mole fractions of C3H8, C4H10, and O2 were approximately 0.01, 0.02, and 0.2, respectively. After combustion, the mole fraction of the reactants decreased quickly. CO2 and H2O were generated as products, and their mole fractions increased quickly. The flame temperature increased promptly for a short axial distance (Y/d = 6) when the combustion happened.

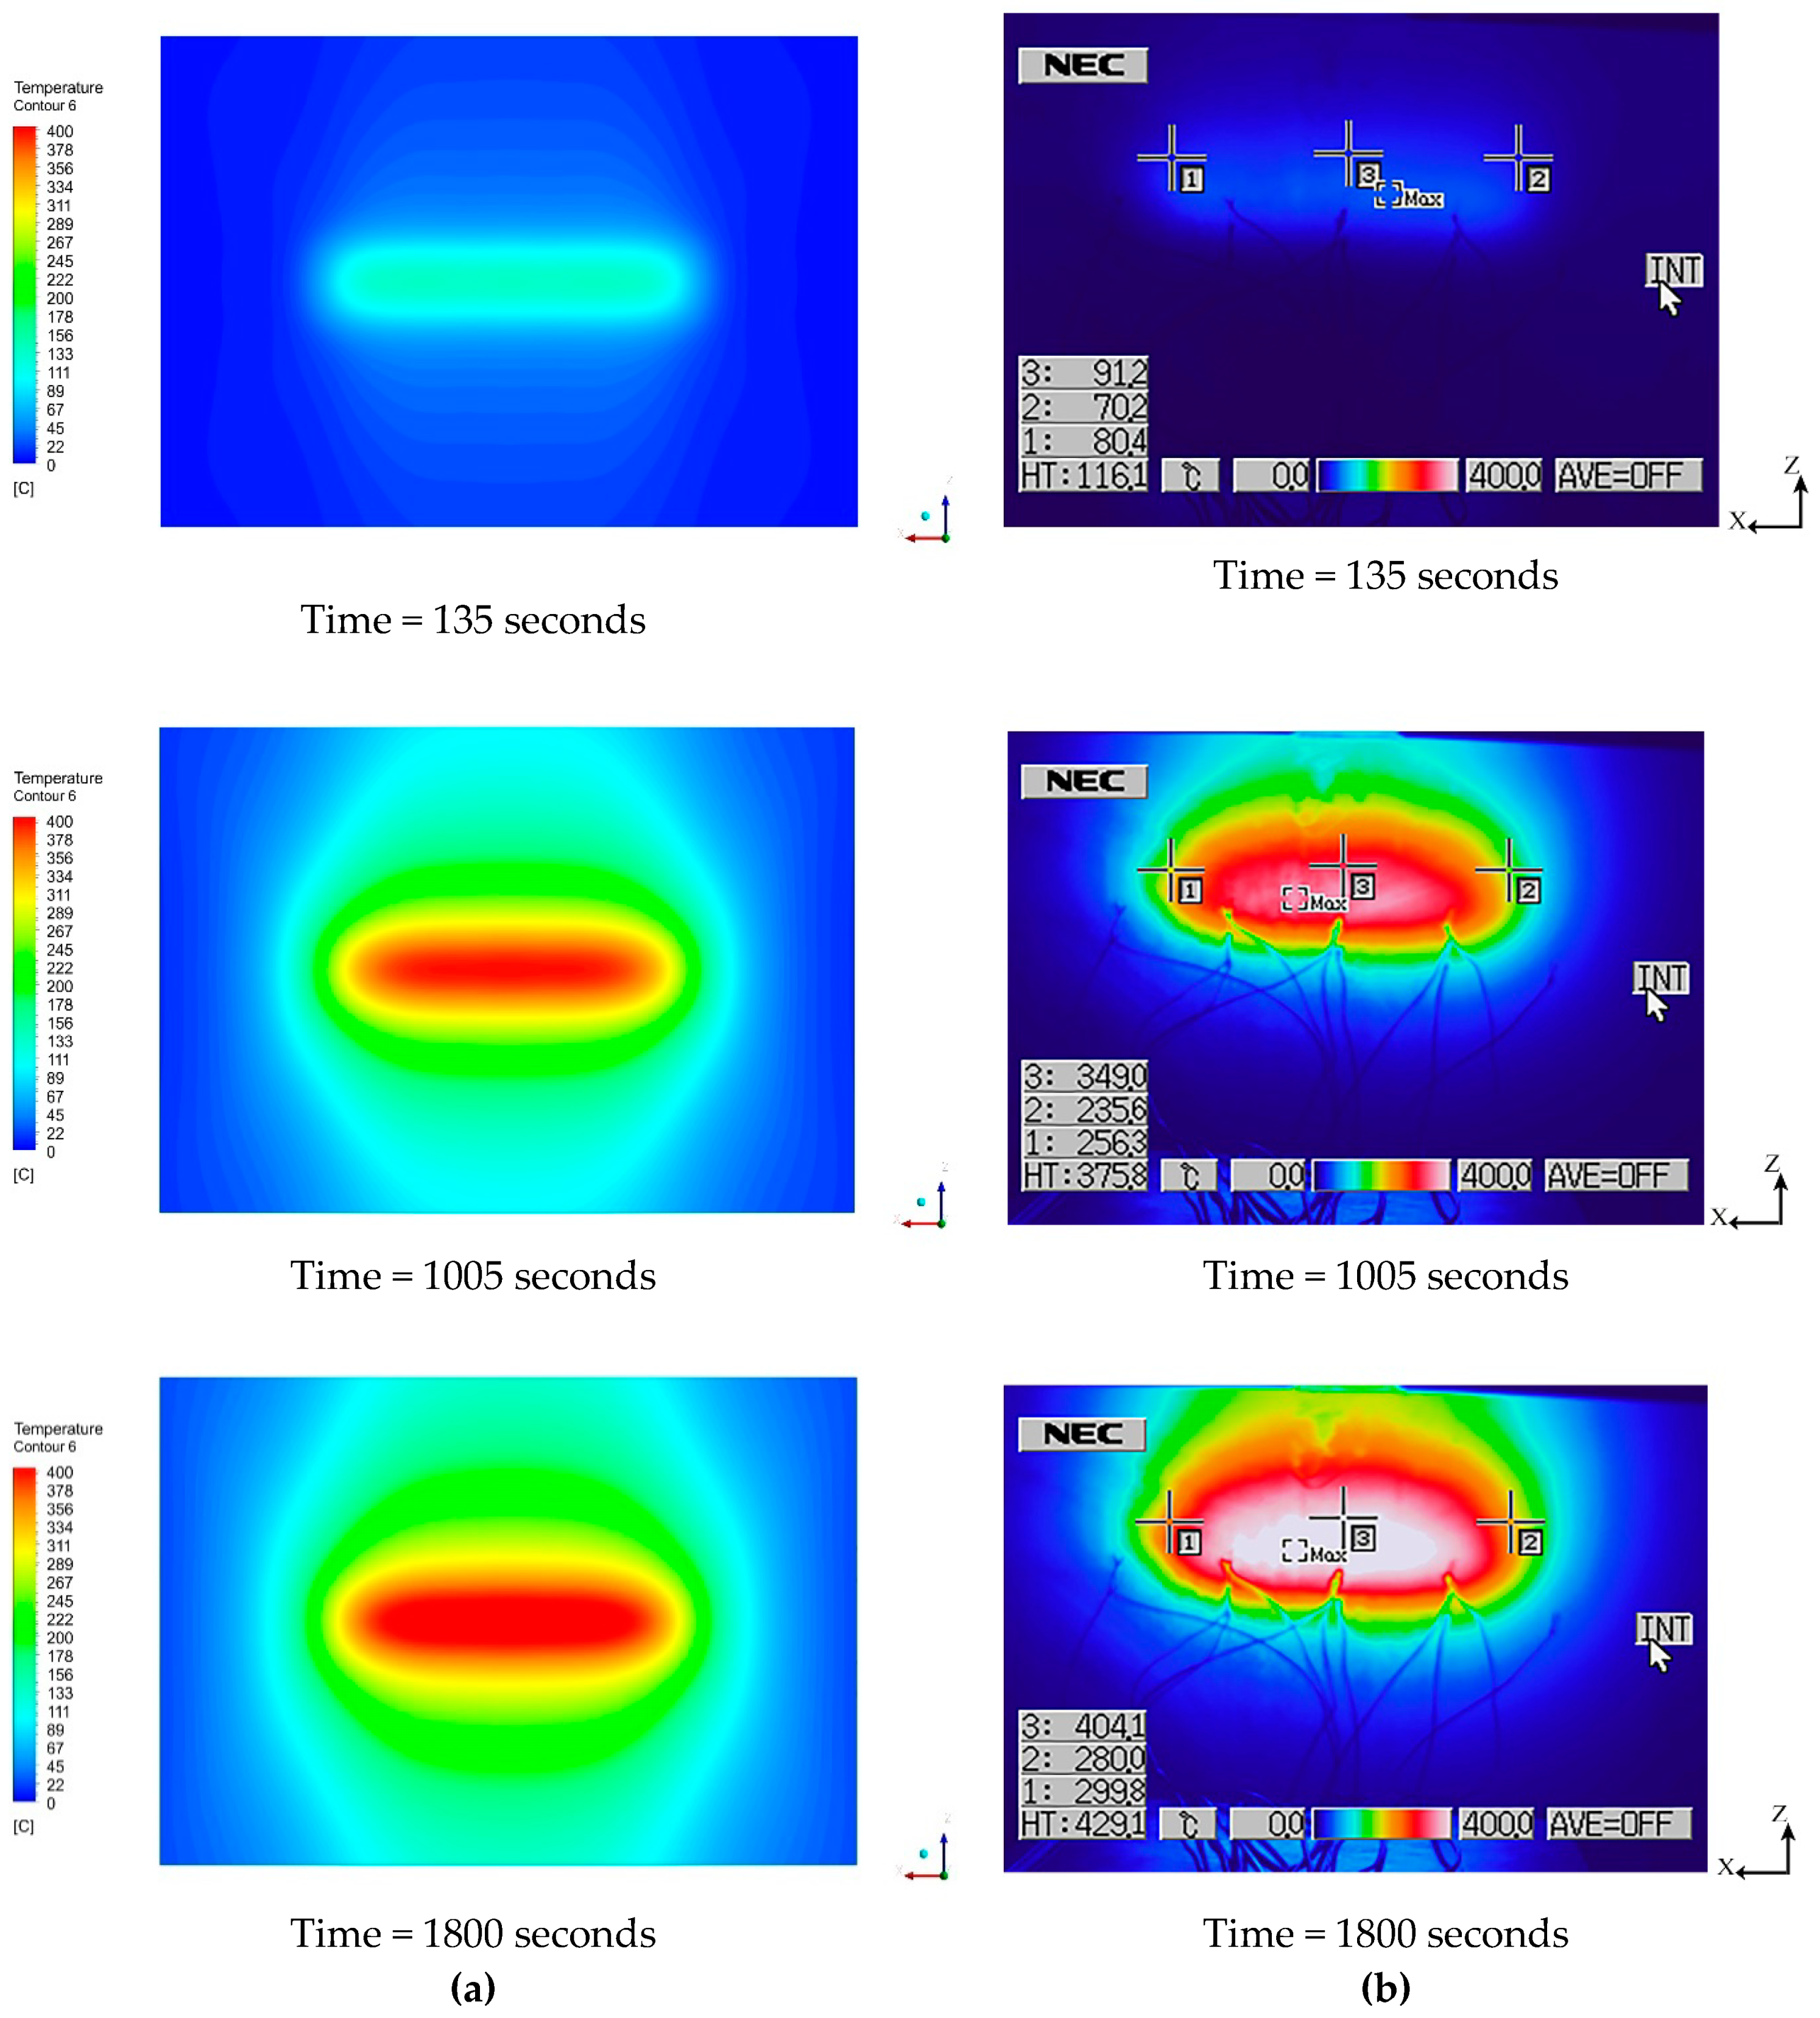
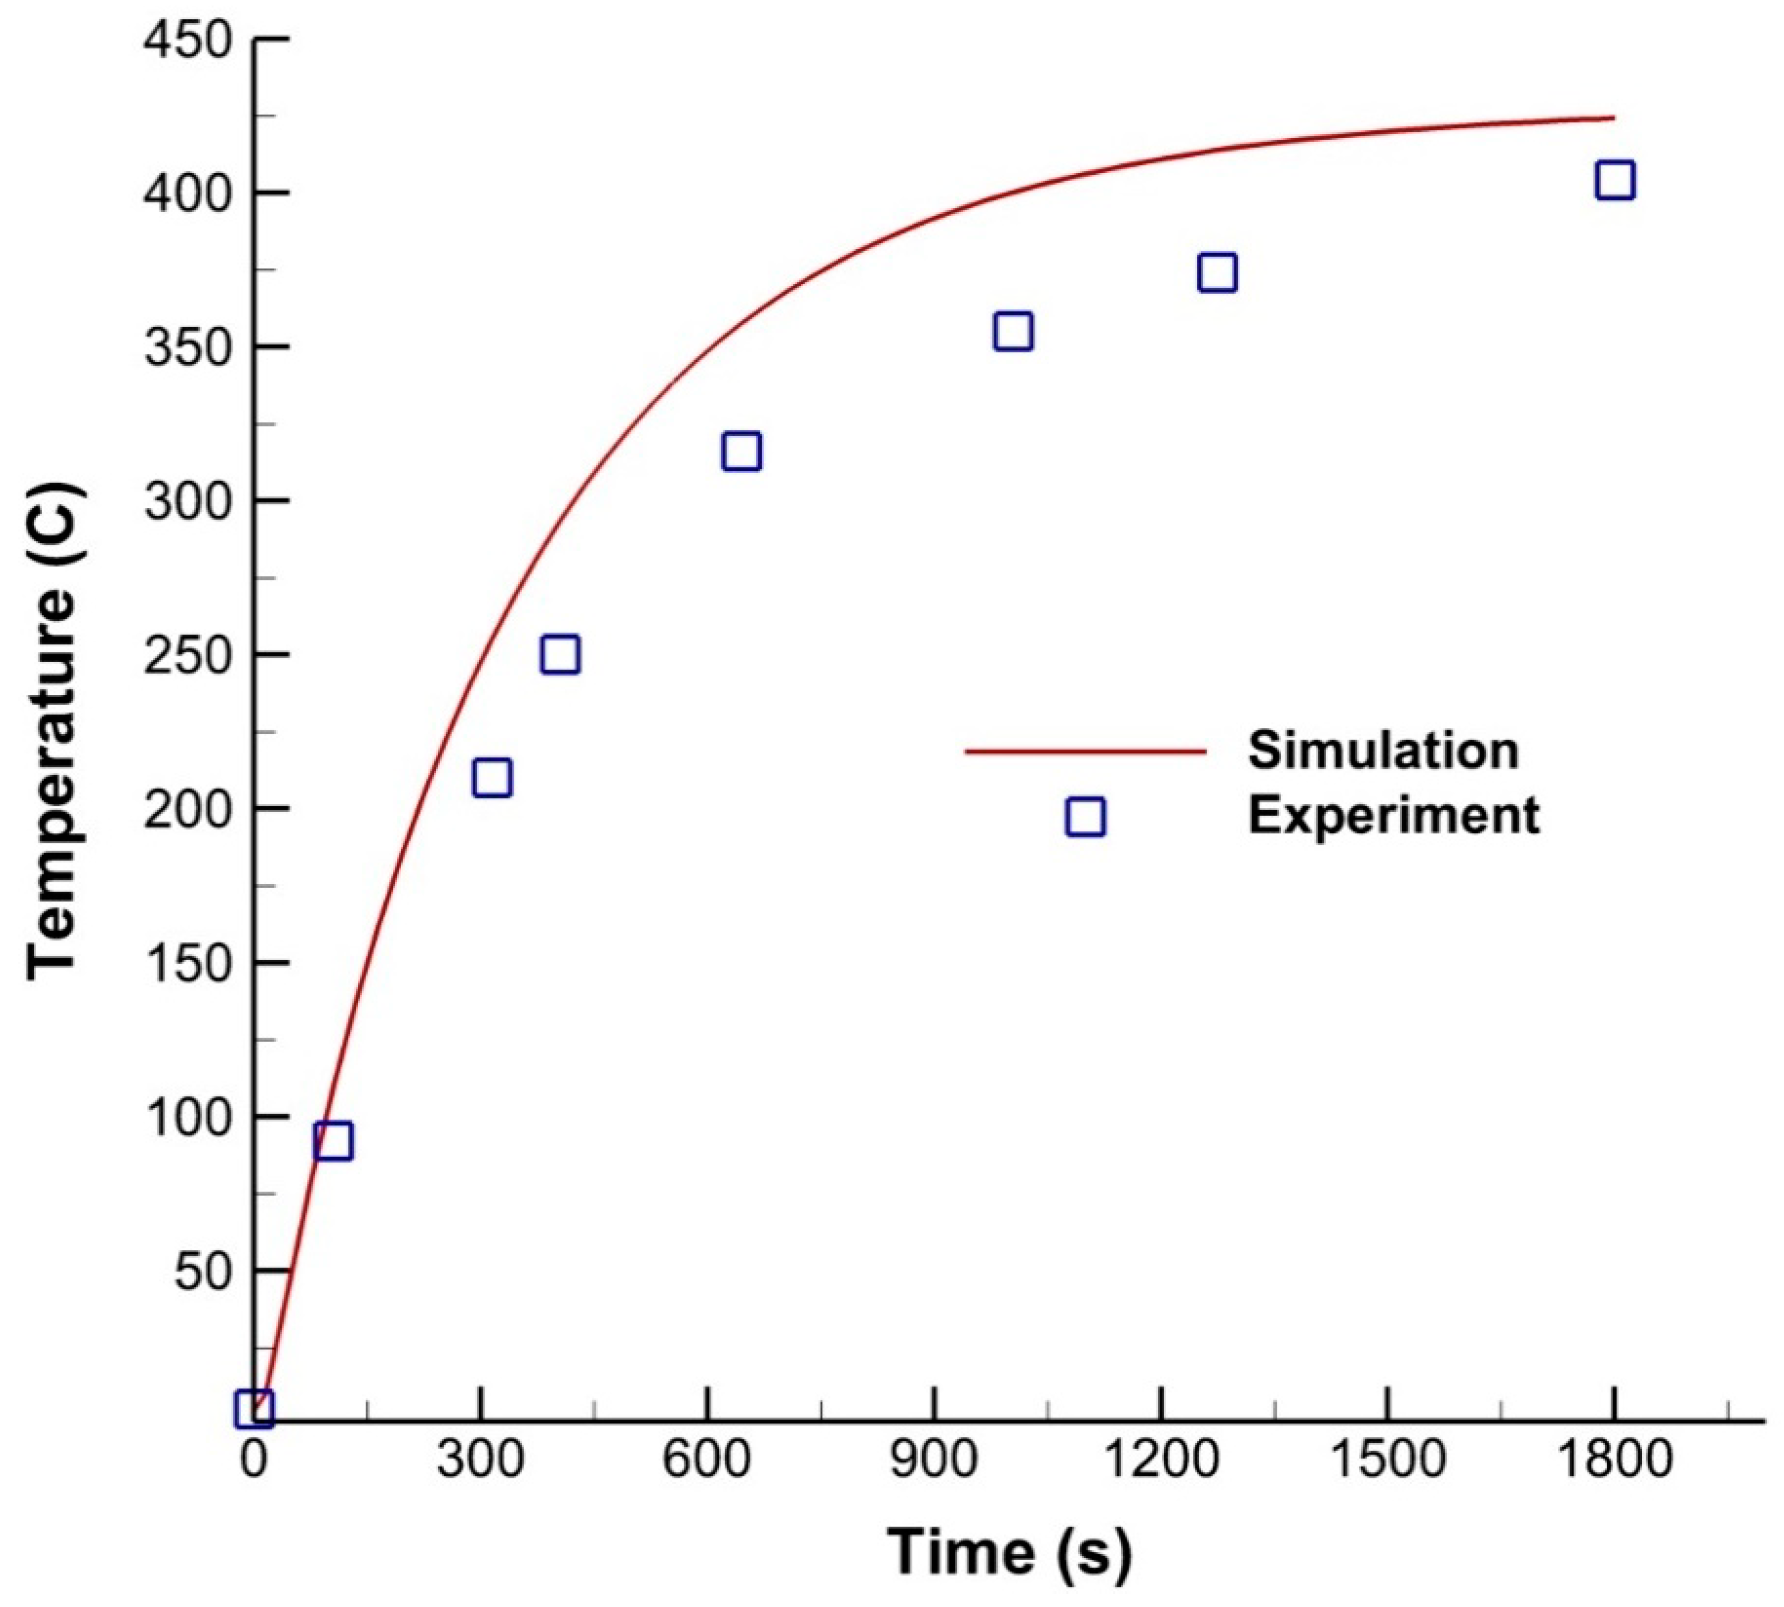
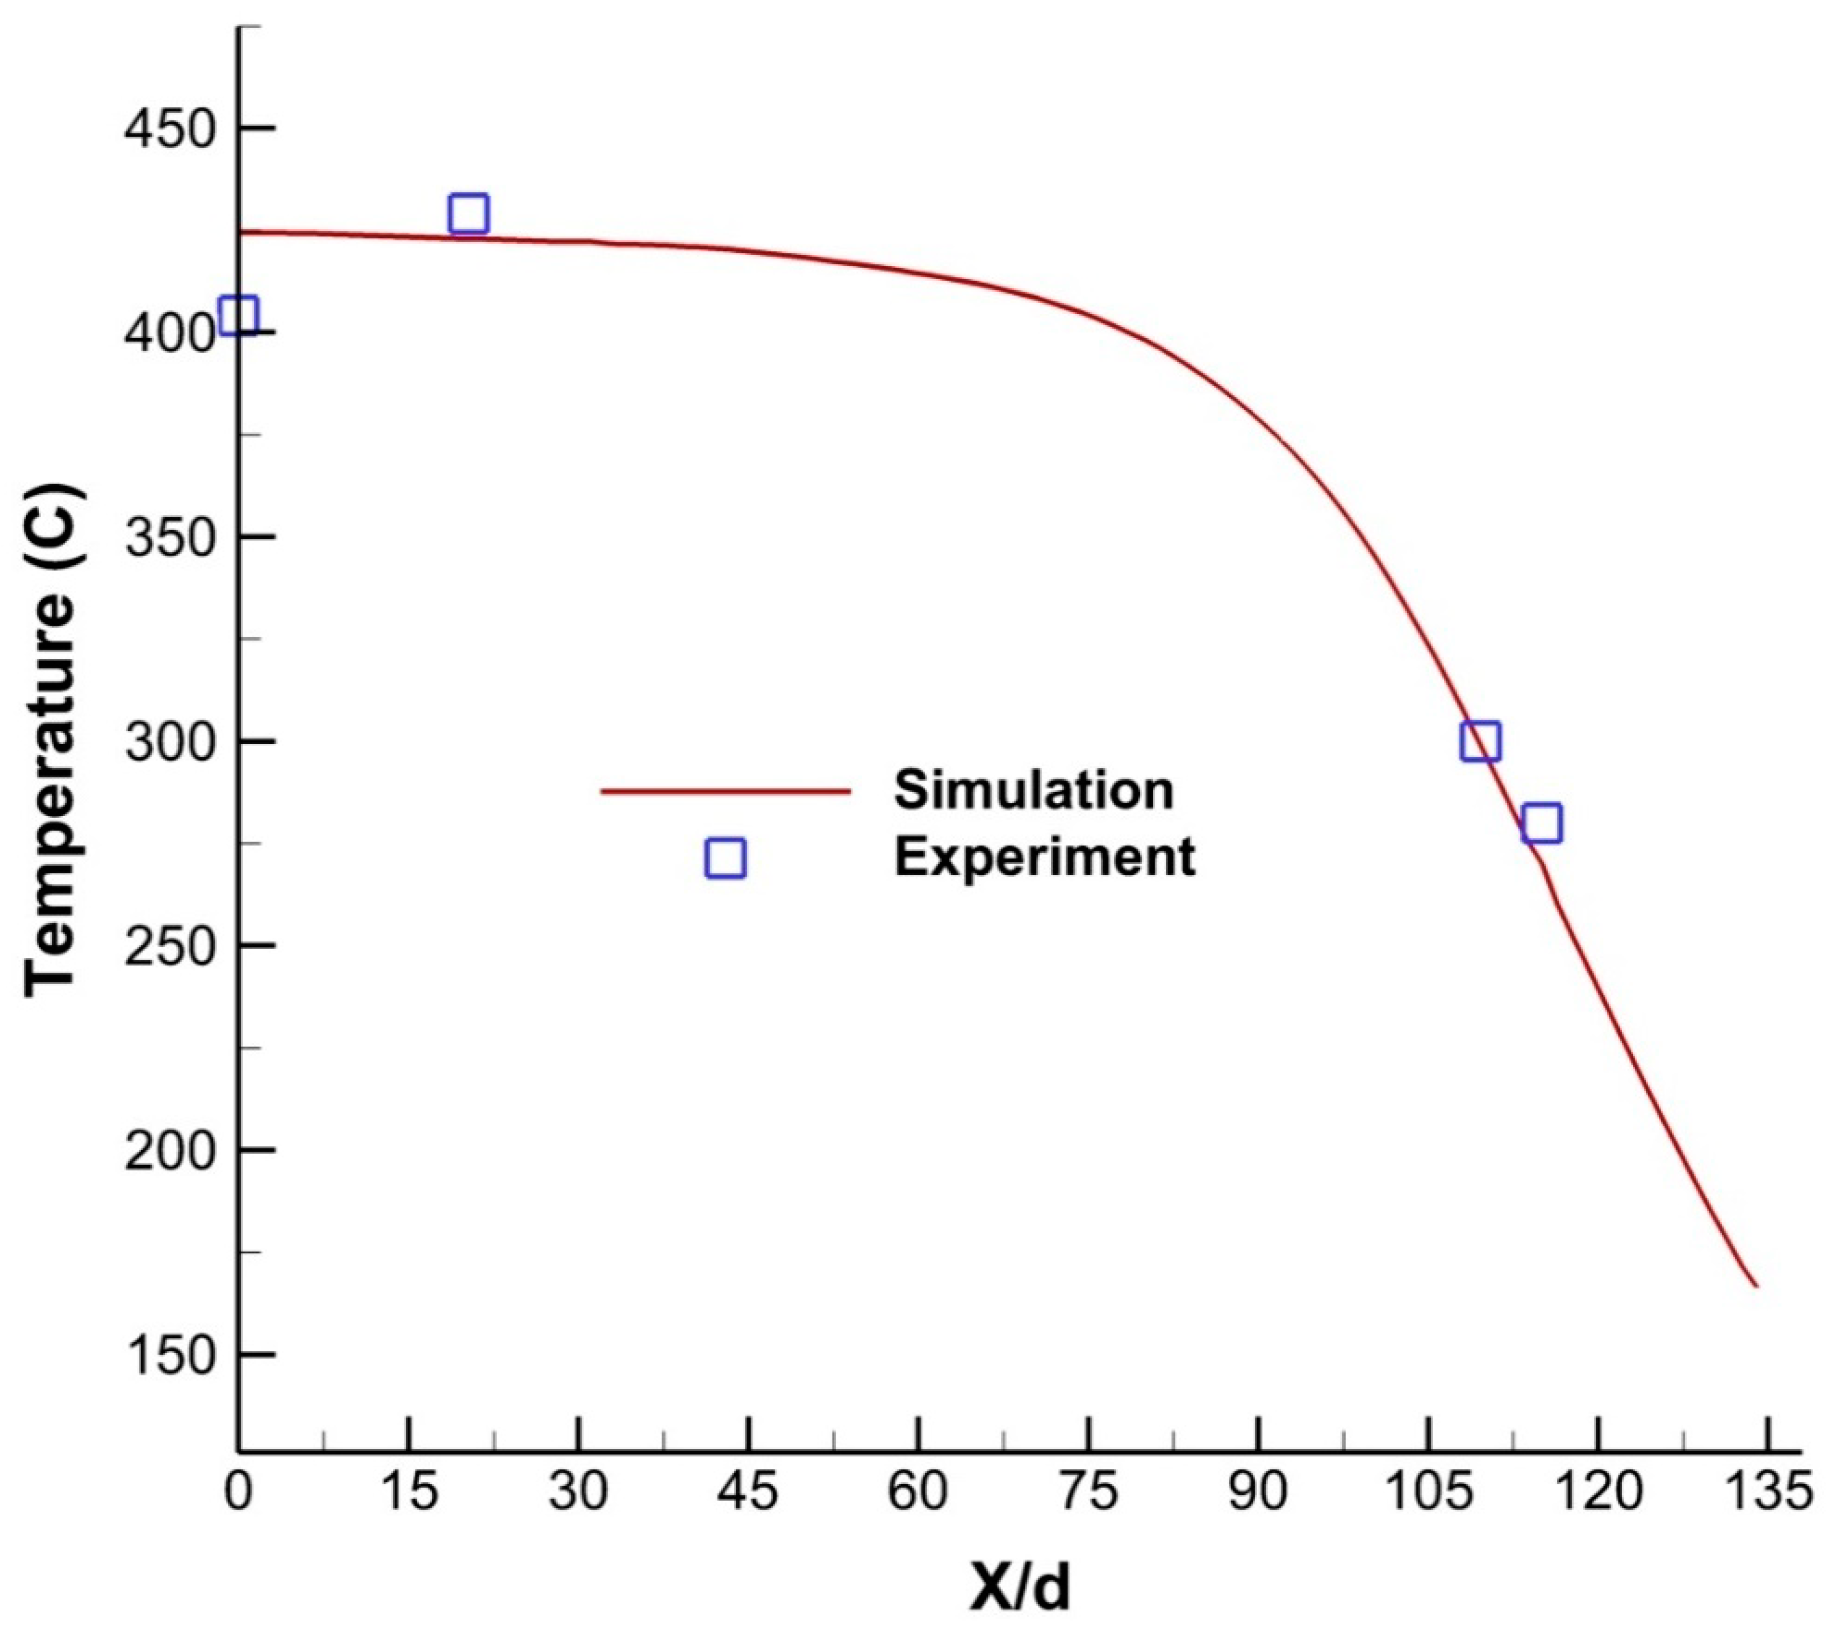
4.2. Transient Simulation and Experiment Results During Steel Preheating

The gas torch with the guide vanes at the outlet showed higher performance than the torch without guide vanes in the previous sections. Thus, the torch with the guide vanes was selected to conduct a simulation from the transient state to the steady state during the steel preheating process. Both an experiment and transient simulation were performed with a guide vane angle of 35 degrees, and the results were compared for validation.
The time step was based on the Courant-Friedrichs-Levy (CFL) [40] number:
C F L = U × d t d x < 1
where U is the inlet velocity of 25 m/s, dt is the time step, and dx is the minimum grid size of 1.2535 × 10⁻⁴ m. According to equation (14), the initial time step in the transient simulation was calculated as 5 × 10⁻⁶ seconds. Then, since the convergence criterion for the momentum, continuity, turbulence, species equations, and energy equation approached, the time-step size was gradually increased. Figure 10 shows the transient temperature contours at the back side of the steel plate from the numerical and experimental results. At 135 seconds, a high temperature was observed at the center area of the back side of the steel plate. This occurred because the flame impinges on the central part of the steel plate, while the other regions are almost invariant. The steel heating process continued until 1005 seconds and then approached steady state at 1800 seconds.
At 1005 seconds, there was clearly a high temperature distribution in the center area. The numerical simulations are in good agreement with the experimental results. When approaching steady state at 1800 seconds, the temperature at the center area from the numerical result was around 424 °C, while the range of the experimental results was 404–429 °C. Consequently, the deviation of the regional temperature at the center between the numerical simulation and the experimental results are in the range of 1.1% to 4.9%.
Figure 11 shows the temperature at the center point of the back side of the steel plate as a function of time. The temperature increases from the initial temperature and approaches the steady-state temperature of 424 °C at 1800 seconds. The numerical simulation results are in good agreement with the experimental results. The disagreement between experiments and simulation in Figure 11 may have been caused by the unstable convection heat transfer effect due to wind velocity and buoyancy flow around the steel plate during the experimental process. At steady state, the back-side temperature deviation of the steel plate between the numerical simulation and experimental results was approximately 4.9%.
Figure 12 presents the temperature distribution on the back side of the steel plate as a function of the longitudinal distance X/d. The central region had a higher temperature (greater than 400 °C). The steel plate temperature decreased from the central region to the end. The experimental results are in good agreement with the numerical simulation results from the center to the edge of the gas torch after the steel preheating process reaches steady state.

4.3. Effect of Operational Variables

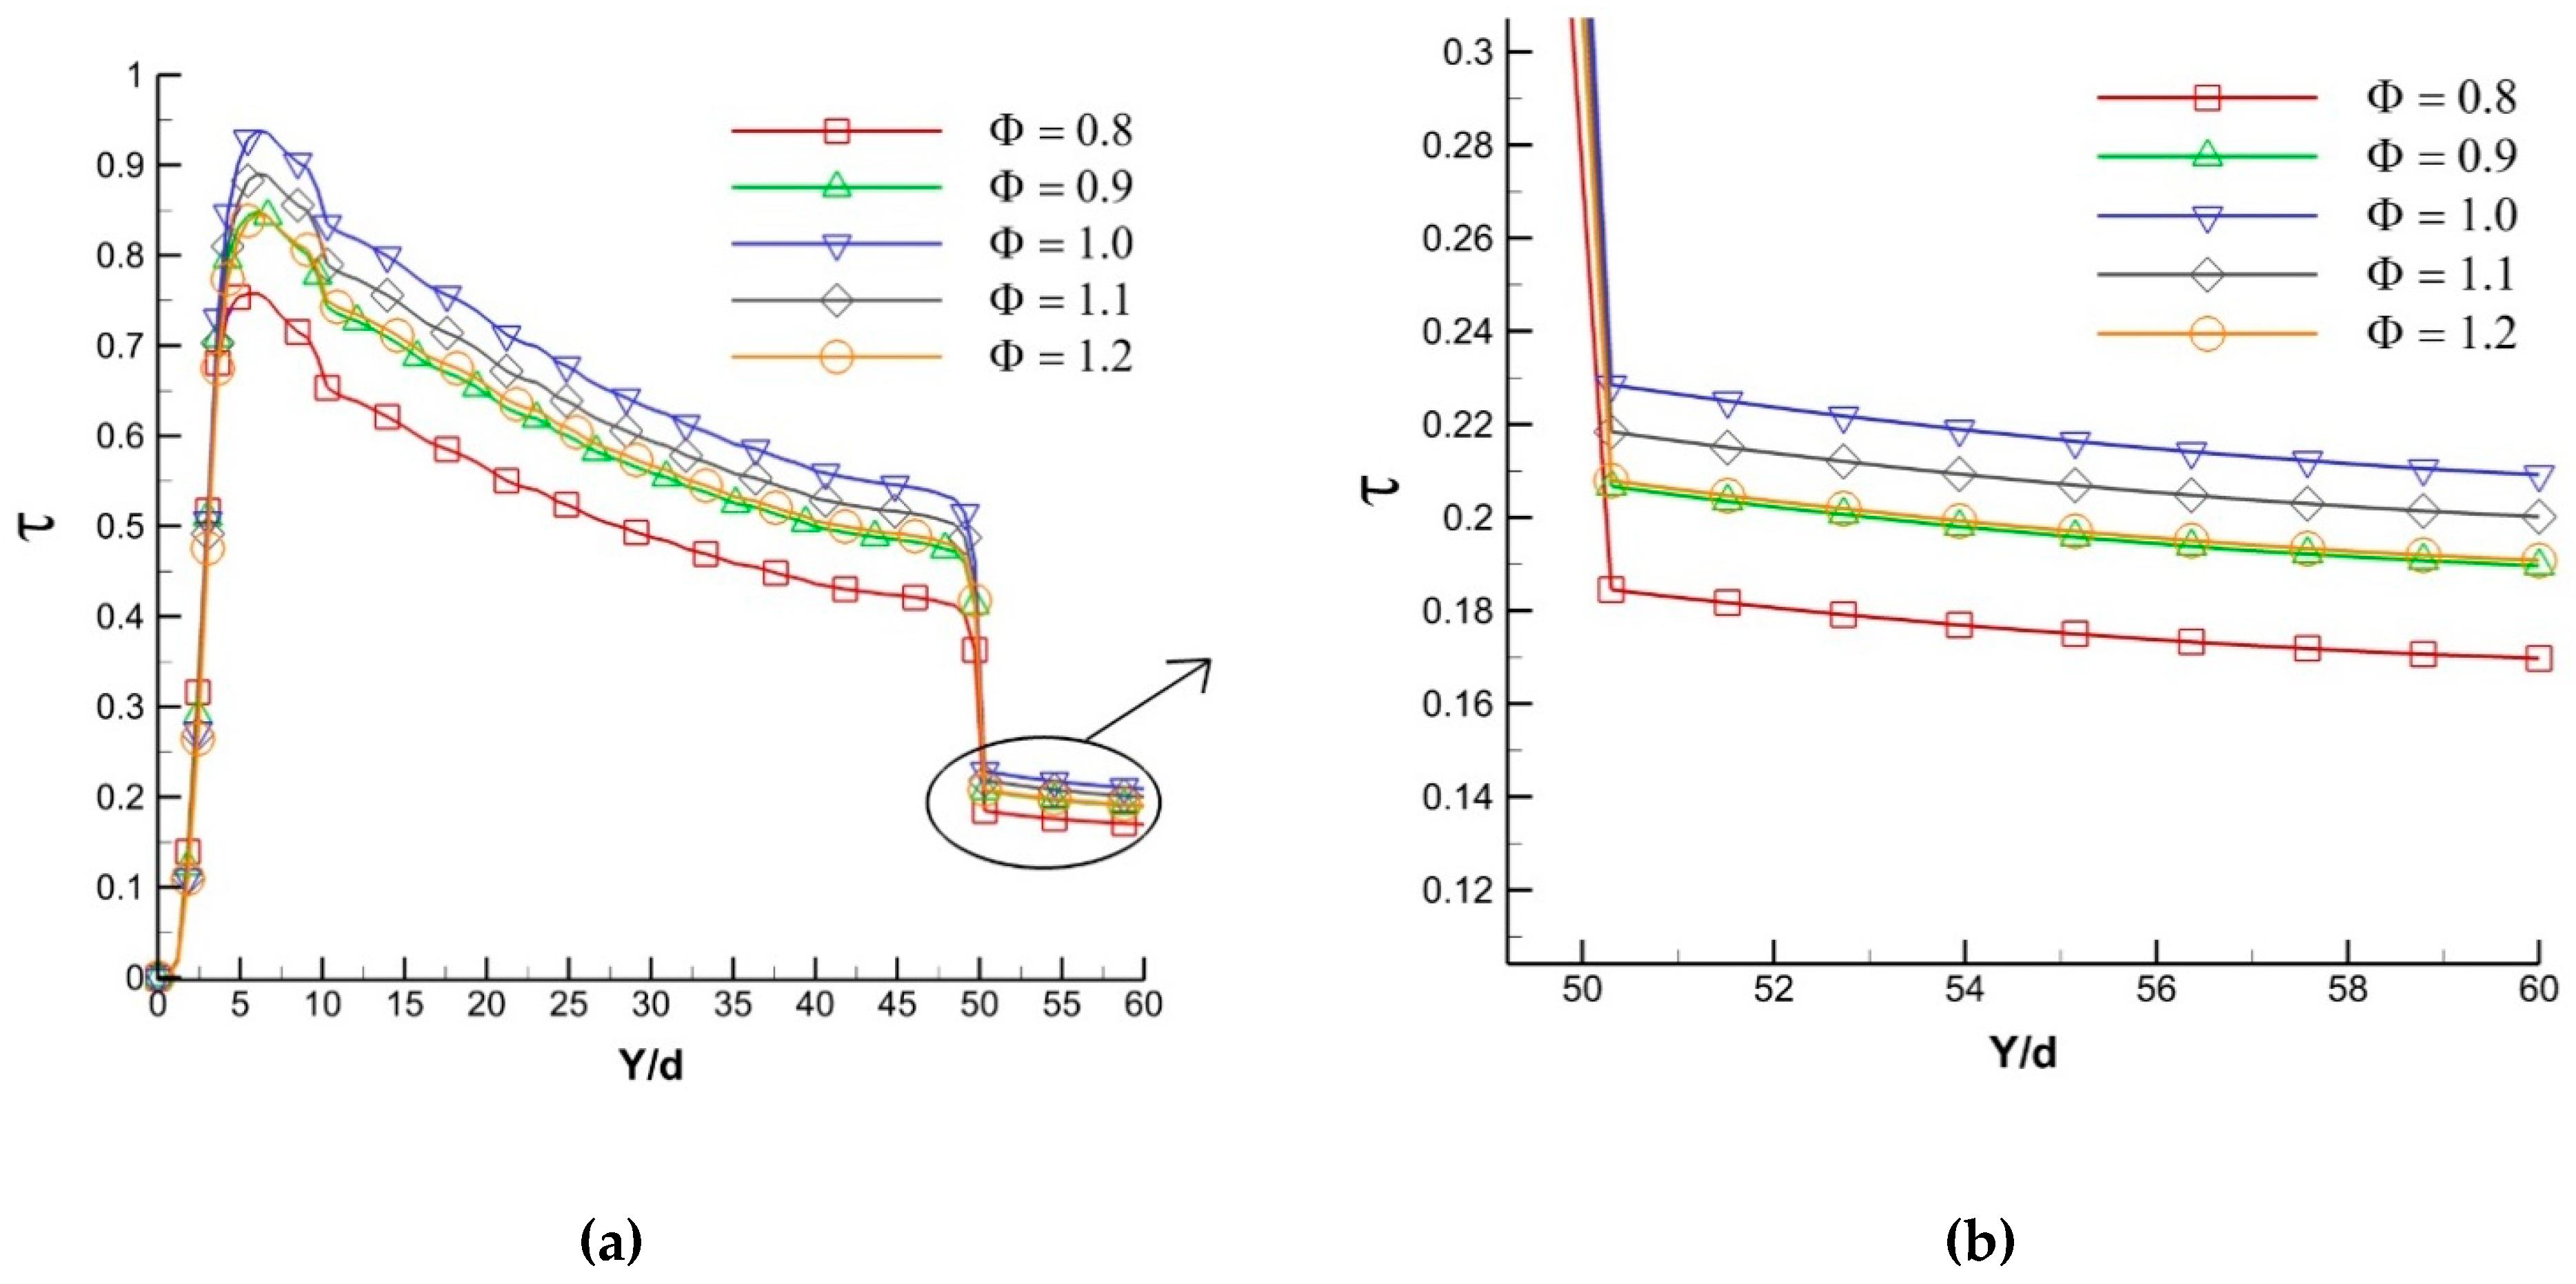
4.3.1. Effect of Equivalence Ratio (Φ)

The non-dimensional temperature parameter was defined to investigate the combustion gas temperature behavior at steady state for varying equivalent ratio and Reynolds number by numerical simulation method:
τ = T T u n b T a d T u n b
where T is the combustion gas temperature, which varies from the gas torch outlet to the steel plate, Tad is the adiabatic temperature of the fuel, and Tunb is the unburned temperature from the gas torch outlet, which was selected as 27 °C (300 K). If τ is equal to 1, it means that the combustion gas temperature approaches the adiabatic temperature.
Figure 13a shows the non-dimensional temperature distributions of the impinging flame jet as a function of Y/d at various equivalence ratios (from fuel lean to fuel rich). All the mixture temperature distributions for different equivalence ratios showed similar trends. The mixture left the torch with low temperature and was then ignited. The temperature increased rapidly for a short distance (Y/d = 5) near the torch. After that, the temperature decreased significantly because heat was released to the ambient air, and finally, the flame impinged on the steel plate (Y/d = 50). The highest temperature was achieved with a stoichiometric reaction. The other cases showed lower temperatures at equivalence ratios of 1.1, 0.9, 1.2, and finally 0.8, at which the lowest temperature distribution occurred. The heat was transferred from the flame side to the back side of the steel plate, as shown in Figure 13b.
Under these conditions, the line for the stoichiometric reaction also presented the highest temperature. As a result of the heat conduction inside the steel plate, the temperature trend is linear from the front side to the back side of the plate. The temperature difference between the front and back sides is not very large due to the high thermal conductivity of the plate.

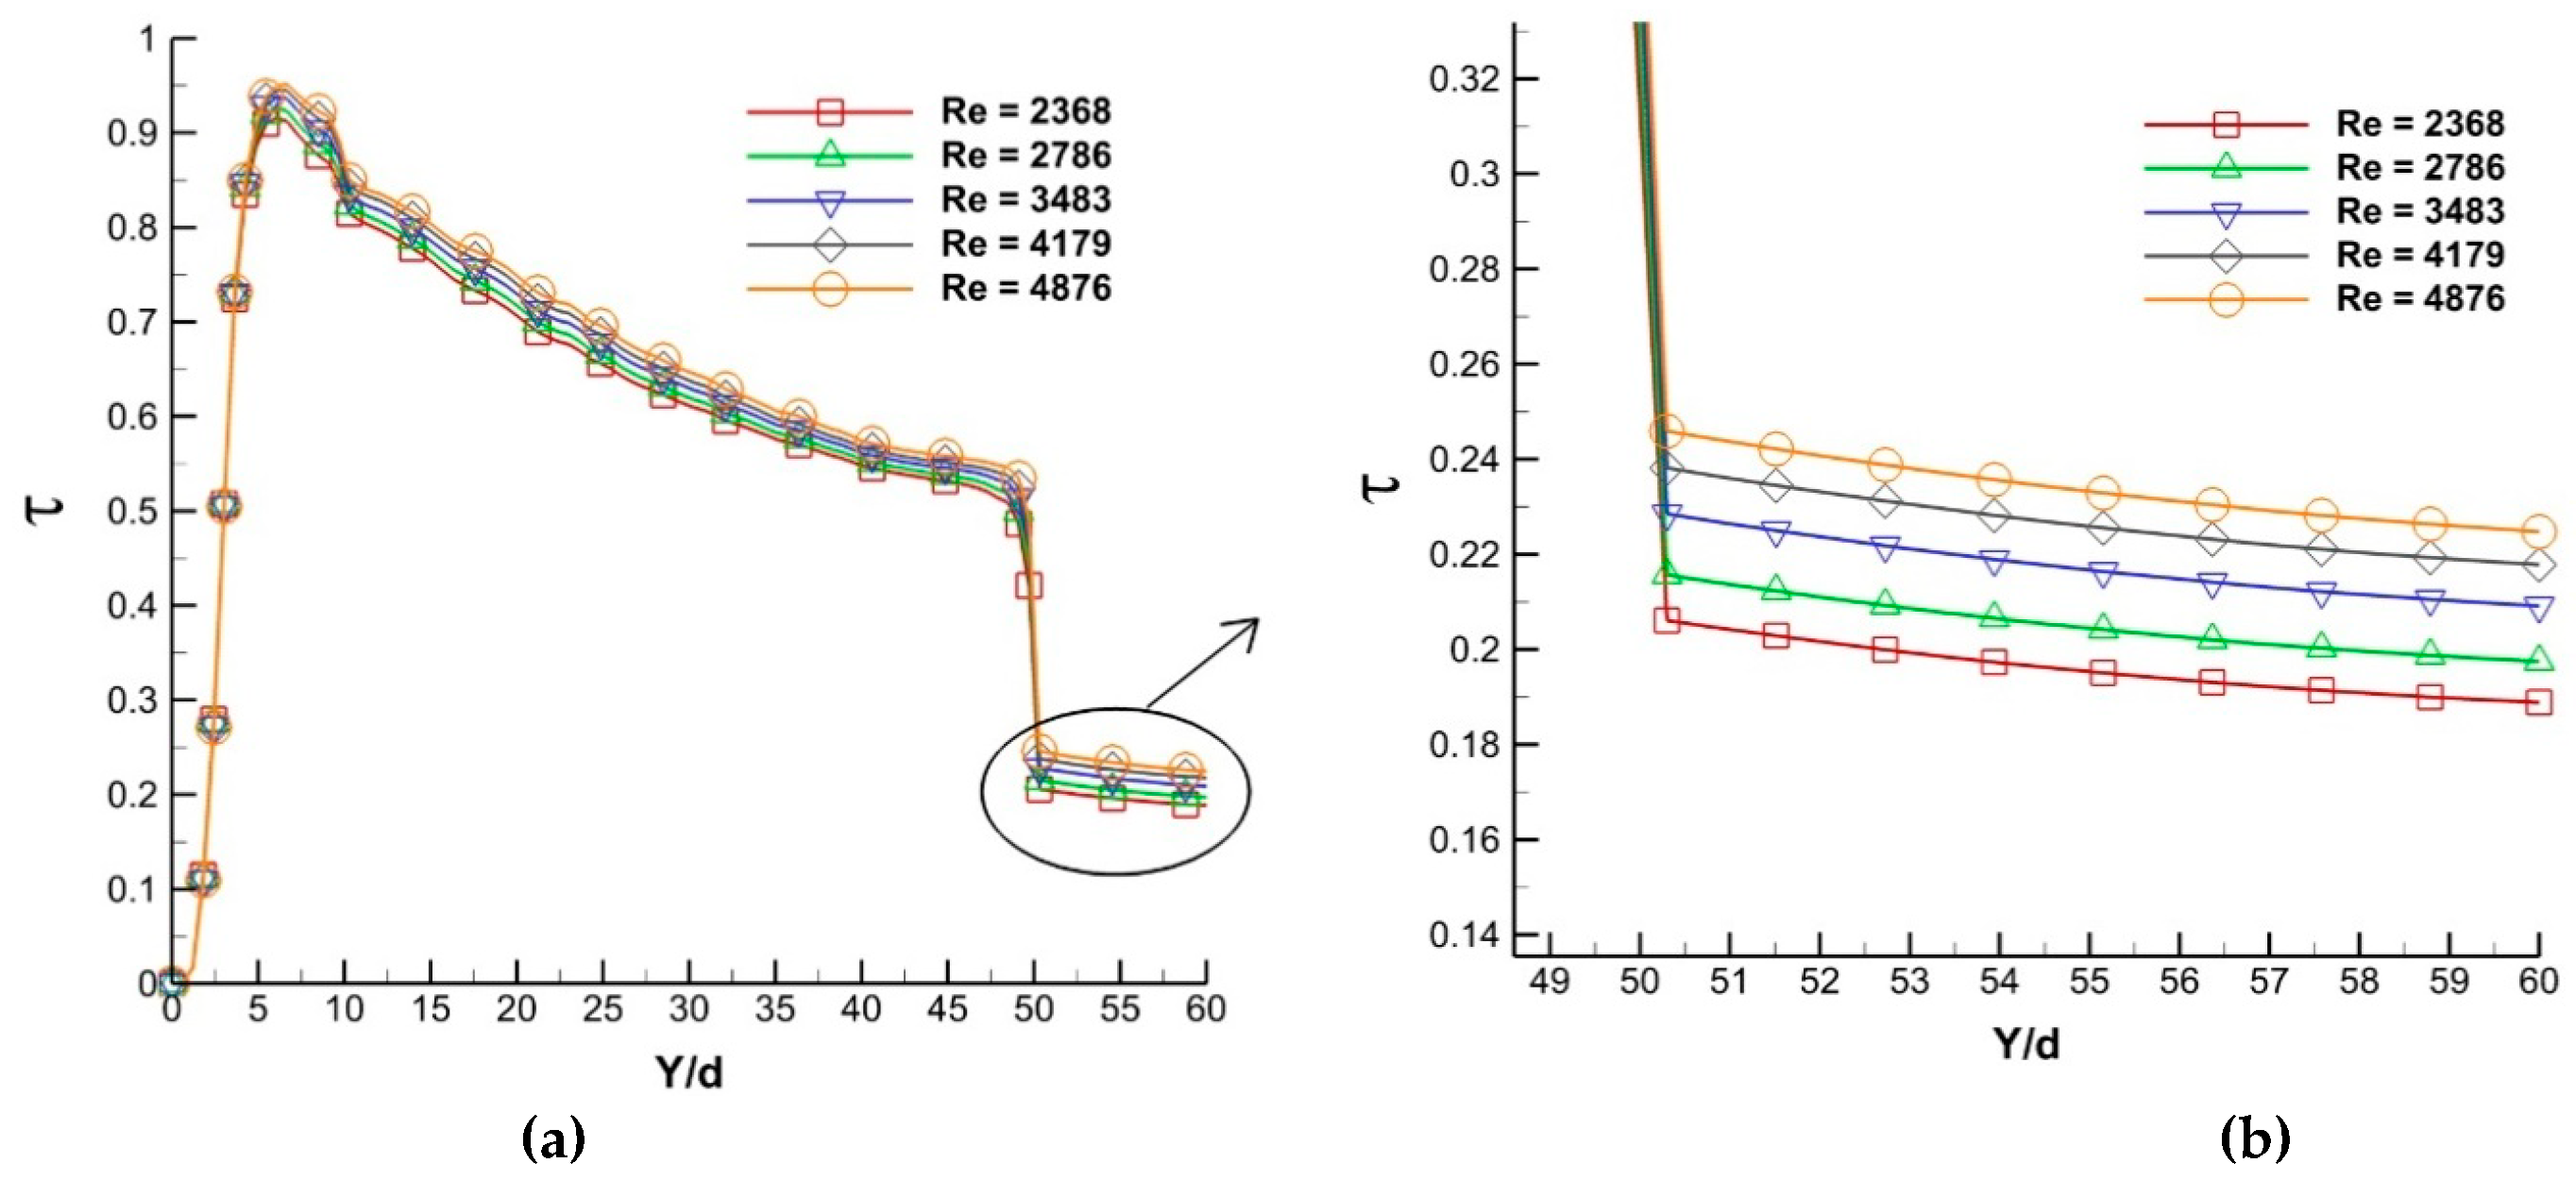
4.3.2. Effect of Reynolds Number (Re)

The effect of the Reynolds number on the temperature distribution was investigated from Re = 2368 to Re = 4876 at an equivalence ratio of 1.0 and H/d = 50, as shown in Figure 14a. The temperature of the flame side and back side of the steel plate was enhanced when Re increased from 2368 to 4876. Increasing Re means increasing the flow rate of the mixture and hence increasing the heat transfer rate to the steel plate. As a result, the combustion was improved by the high level of turbulence and the high heat release rate due to the increased mixing of the fuel and air. Therefore, there was an increase in the plate temperature on the flame side and back side. The plate temperature increases as the Reynolds number increases.

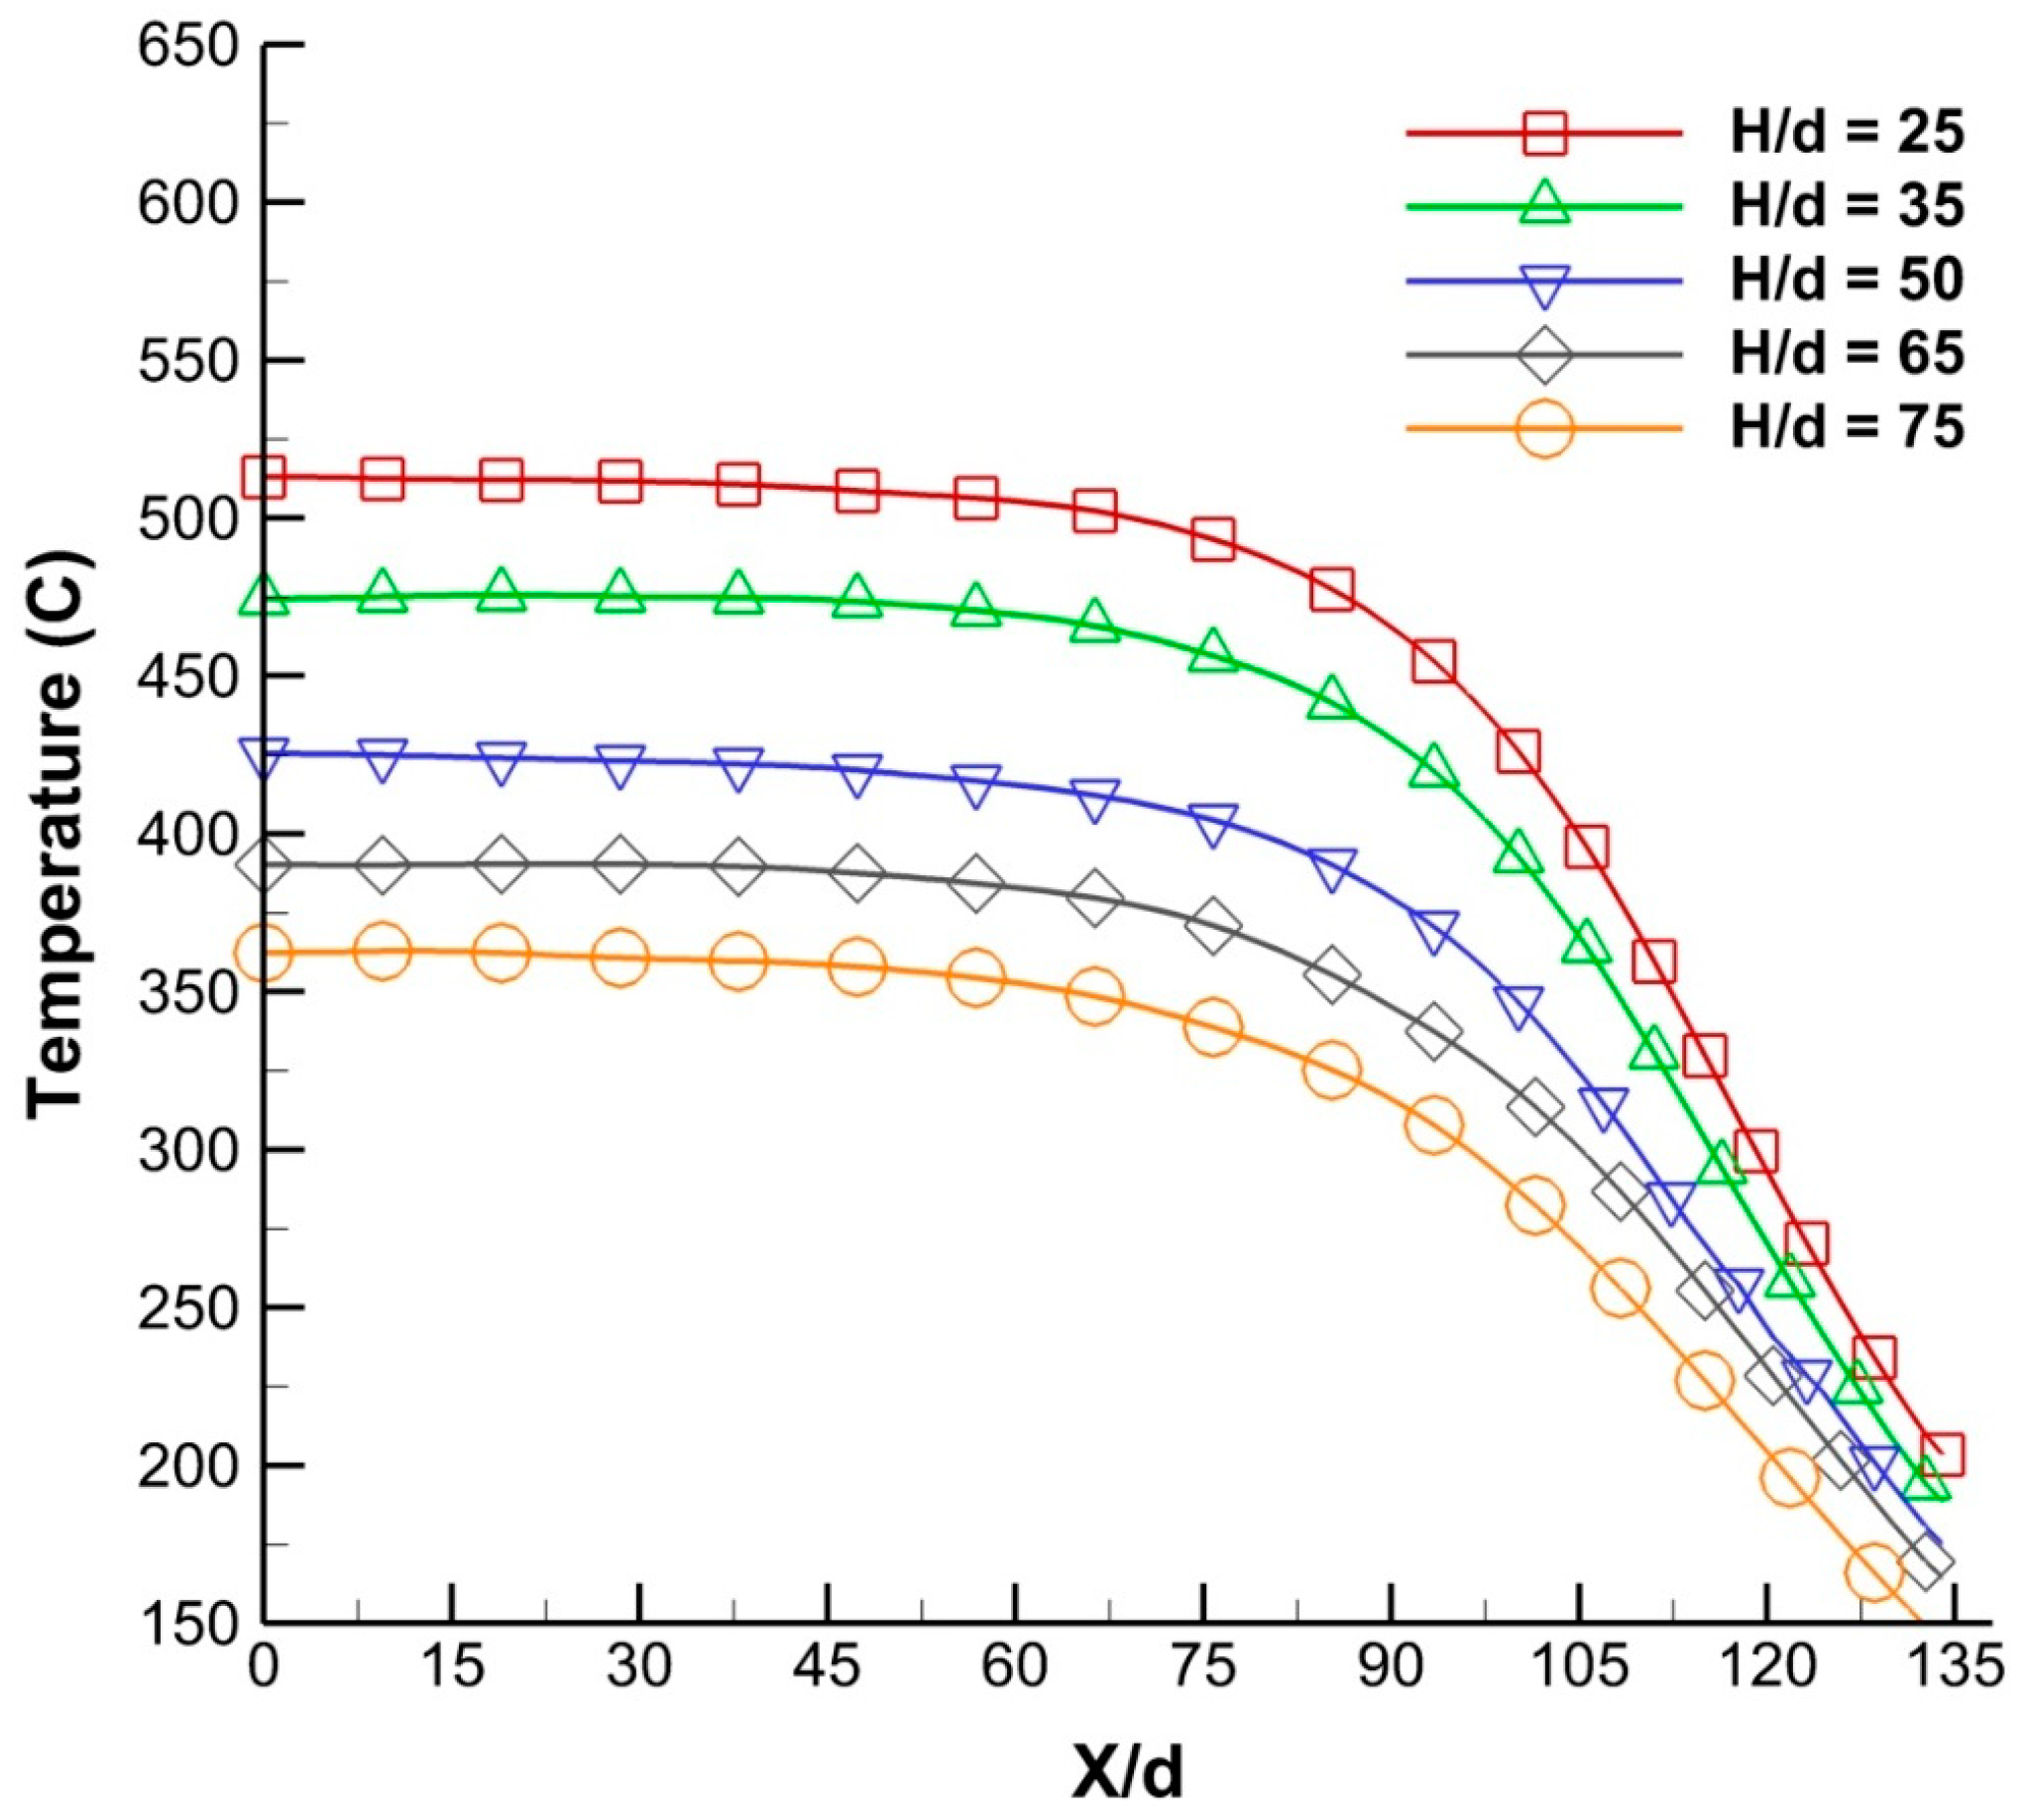
4.3.3. Effect of the Distance between the Torch Outlet and the Steel Plate (H/d)

Figure 15 shows the temperature distributions on the back side of the steel plate along the x-direction from the center to the edge for various distances from the torch outlet to the steel plate (H/d). The range of H/d was 25 to 75, the reaction was stoichiometric (Φ = 1), and the Reynolds number was 3483. The steel plate temperature did not change much from the center to X/d = 75, but decreased much more from X/d = 75 to the end due to the cooling effect from the ambient air. From H/d = 25 to 75, increasing the distance between the torch outlet and the steel plate resulted in a greater decrease in the temperature distribution on the back side of the plate. This was due to the temperature of the combustion gas decreasing as the distance from the gas torch increased.

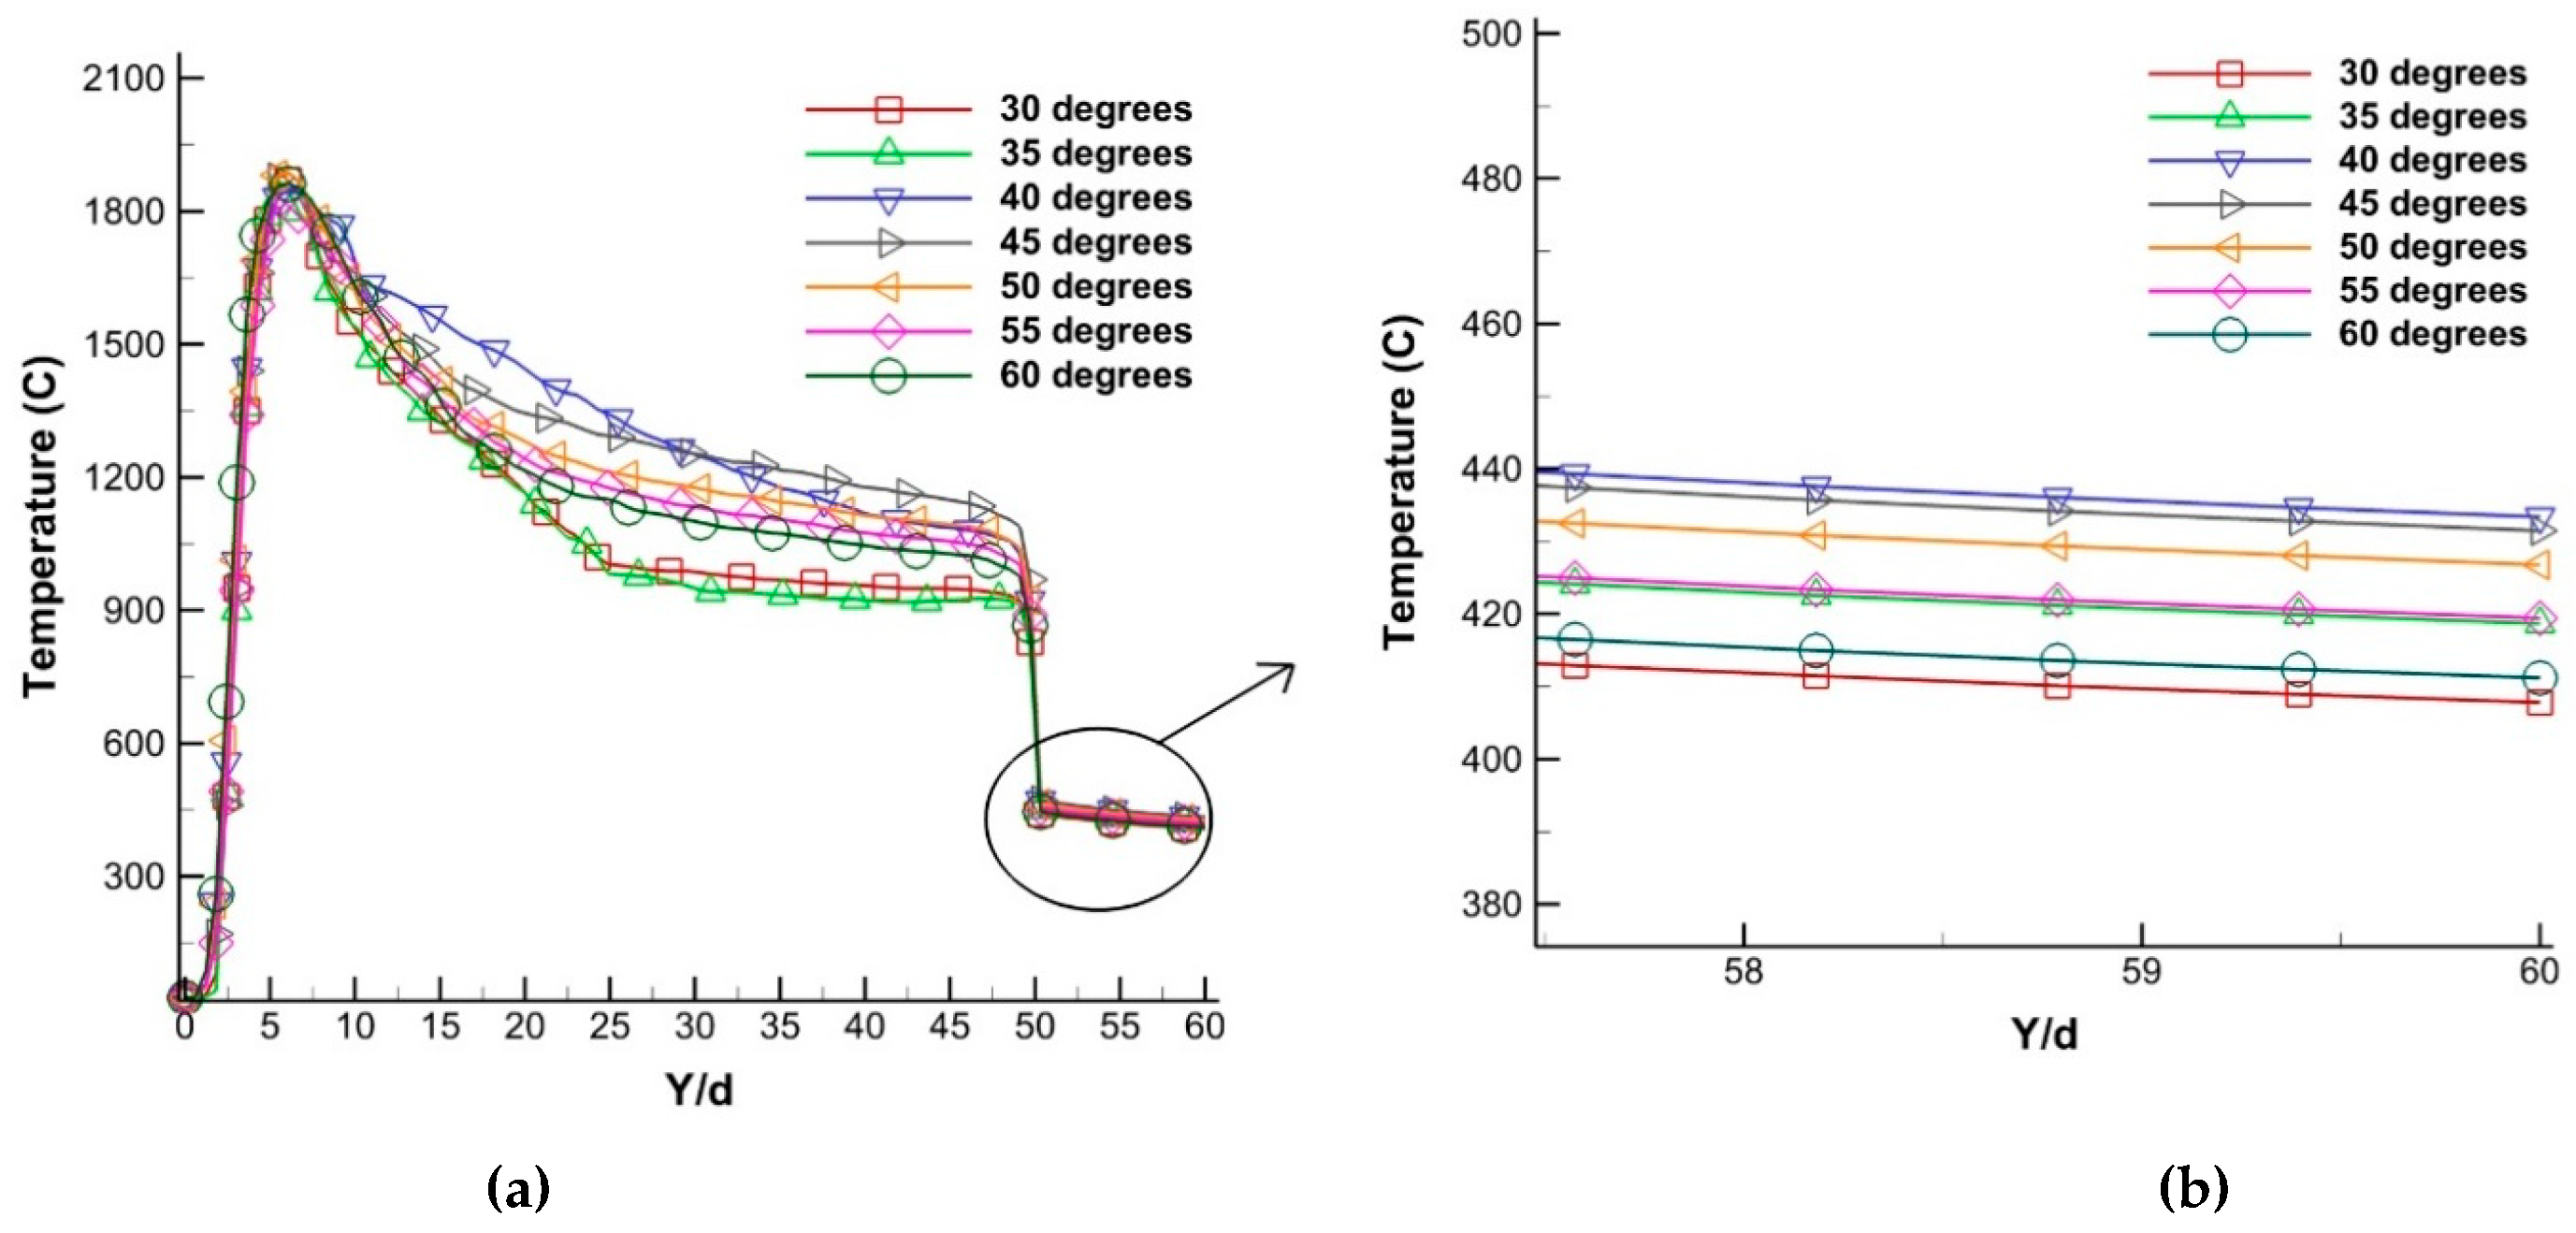
4.4. Optimizing the Guide Vane Angle on the Gas Torch Outlet Surface

The guide vane angle at the gas torch outlet is also important to achieve a desired temperature. A guide vane with a certain horizontal angle is shown in Figure 16. The effect of varying the guide vane angle from 30 to 60 degrees on the preheating performance was examined. The Reynolds number (Re), equivalence ratio (ф), and ratio of the distance from the torch outlet to the steel plate to the nozzle diameter (H/d) were fixed at 3483, 1.0, and 50, respectively.
The temperature distribution is plotted as a function of Y/d for various guide vane angles in Figure 17a. For the initial combustion, the flame temperature distributions for all angles were similar. After approaching the highest temperature at Y/d = 5, the flame temperature decreased due to ambient air cooling, and then the flame impinged on the steel plate. The temperatures for all the angles inside the steel plate are presented in Figure 17b. The case with the guide vane angle of 40 degrees shows the highest temperature of the back side of the steel plate. With the optimized guide vane angle of 40 degrees, the maximum temperature increment of the steel plate was 25 °C compared with the results at other angles. Therefore, the optimal angle is considered to be approximately 40 degrees.

5. Conclusions

Numerical simulations and experiments were performed to investigate the temperature distribution on the back side of a steel plate during a preheating process. The temperature was improved for the model with the guide vanes by 65 °C.
The transient numerical simulation and experimental results were in good agreement. At steady state, the back-side temperature deviation of the steel plate between the numerical simulation and experimental results was approximately 4.9%. The influences of the equivalence ratio (Φ), Reynolds number (Re), and downstream distance from the torch outlet plate toward the steel plate (Y/d) were investigated. For the equivalence ratio, the highest temperature was found at the stoichiometric value. Higher Reynolds number resulted in higher temperature distribution on the back side of the plate. The steel plate temperature decreased monotonically as the distance between the torch outlet and the steel plate increased. To improve the gas torch performance, the guide vane angle at the outlet of the gas torch had to be optimized. An angle of 40 degrees resulted in the highest temperature distribution. At this angle, the temperature of the steel plate showed a maximum increment of 25 °C compared with other angles.
The temperature of the steel plate to be preheated can be determined effectively by attaching guide vanes to the outlet of the gas torch at an appropriate angle and by adjusting the appropriate fuel-air mixing ratio (Φ), the torch outlet pressure or speed (Re), and the distance between the torch outlet and the steel plate (H/d). In addition, guide vanes at appropriate angles may lead to energy savings by attaining higher temperature of the steel plate and high preheating performance with a uniform temperature distribution.

Author Contributions

Conceptualization, G.S.L. and H.V.N.; methodology, G.S.L., H.V.N., T.T.N. and T.Z.;software, T.T.N. and H.V.N.; validation, G.S.L., T.T.N., J.G. and T.Z.; formal analysis, T.T.N., H.V.N. and G.S.L.; investigation, T.T.N., H.V.N., T.Z. and J.G.; resources, G.S.L.; data curation, G.S.L., H.V.N., T.T.N. and T.Z.; writing—original draft preparation, T.T.N.; writing—review and editing, G.S.L.; visualization, T.T.N., J.G. and T.Z.; supervision, G.S.L.; project administration, G.S.L. and J.G.; funding acquisition, G.S.L.

Funding

This research was funded by the Ministry of Trade, Industry, and Energy (MOTIE) [grant number: R0006185] and by the Korea Small and Medium Business Administration [grant number: C0275689].

Acknowledgments

This work was supported by Fostering Local Specialization Industry Crisis Type (Shipbuilding Equipment) Technology Development Business funded by the Ministry of Trade, Industry (MOTIE) [Project Name: R0006185] and also supported by Business for Cooperative R&D between Industry, Academy, and Research Institutes [Project Name: C0275689], which is funded by the Korea Small and Medium Business Administration.

Conflicts of Interest

The authors declare no conflict of interest.

Nomenclature

AEmpirical constant equal to 4.0
BEmpirical constant equal to 0.5
dJet hole diameter (mm)
ETotal energy (J)
Di,mMass diffusion coefficient for species i
DT,iThermal diffusion coefficient
hiEnthalpy of species i
HDistance between the torch outlet and the steel plate (m)
IUnit tensor
JiDiffusion flux of species i
kTurbulent kinetic energy per unit mass (J/kg)
Mw,iMolecular weight of species i
pPressure (Pa)
RiNet rate of production of species i
ReReynolds number
SiThe rate of creation
SctThe turbulent Schmidt number
TTemperature (C)
uVelocity (m/s)
uTTranspose velocity
v′i,rStoichiometric coefficient for reactant i in reaction r
v″i,rStoichiometric coefficient for product i in reaction r
YiLocal mass fraction of each species
YPMass fraction of any product species, P
YRMass fraction of a particular reactant, R
Y/dNon-dimensional length
Greek symbols
ρDensity (kg/m3)
τNon-dimensional temperature
εTurbulent dissipation rate (m2s−3)
ΦEquivalent ratio
Abbreviations
CFDComputational fluid dynamics
LPGLiquefied petroleum gas
Subscripts
adAdiabatic
iSpecies
PProducts
RReactants
unbUnburned
tTurbulent

References

  1. Li, H.B.; Zhen, H.S.; Leung, C.W.; Cheung, C.S. Nozzle effect on heat transfer and CO emission of impinging premixed flames. Int. J. Heat Mass Transf. 2011, 54, 625–635. [Google Scholar] [CrossRef]
  2. Li, H.B.; Zhen, H.S.; Leung, C.W.; Cheung, C.S. Effects of plate temperature on heat transfer and emissions of impinging flames. Int. J. Heat Mass Transf. 2010, 53, 4176–4184. [Google Scholar] [CrossRef]
  3. Zhen, H.S.; Leung, C.W.; Cheung, C.S. Heat transfer characteristics of an impinging premixed annular flame jet. Appl. Therm. Eng. 2012, 36, 386–392. [Google Scholar] [CrossRef]
  4. Chander, S.; Ray, A. Heat transfer characteristics of laminar methane air flame impinging normal to a cylindrical surface. Exp. Therm. Fluid Sci. 2007, 32, 707–721. [Google Scholar] [CrossRef]
  5. Katti, V.; Prabhu, S.V. Experimental study and theoretical analysis of local heat transfer distribution between smooth flat surface and impinging air jet from a circular straight pipe nozzle. Int. J. Heat Mass Transf. 2008, 51, 4480–4495. [Google Scholar] [CrossRef]
  6. Hindasageri, V.; Vedula, R.P.; Prabhu, S.V. Heat transfer distribution for impinging methane-air premixed flame jets. Appl. Therm. Eng. 2014, 73, 461–473. [Google Scholar] [CrossRef]
  7. Wei, D.H.; Ta, H.L. Methane flame stability in a jet impinging onto a wall. Energy Convers. Manag. 2005, 46, 727–739. [Google Scholar]
  8. Zhao, Z.; Wong, T.T.; Leung, C.W. Impinging premixed butane air circular laminar flame jet influence of impingement plate on heat transfer characteristics. Int. J. Heat Mass Transf. 2004, 47, 5021–5031. [Google Scholar] [CrossRef]
  9. Akram, M.; Kumar, S. Measurement of laminar burning velocity of liquefied petroleum gas air mixtures at elevated temperatures. Energy Fuels 2012, 26, 3267–3274. [Google Scholar] [CrossRef]
  10. Akram, M.; Kumar, S.; Saxena, P. Experimental and computational determination of laminar burning velocity of liquefied petroleum gas-air mixtures at elevated temperatures. J. Eng. Gas Turb. Power 2013, 135, 091501. [Google Scholar] [CrossRef]
  11. Remie, M.J.; Cremers, M.G.G.; Schreel, K.R.A.M.; Goey, L.P.H. Analysis of the heat transfer of an impinging laminar flame jet. Int. J. Heat Mass Transf. 2007, 50, 2816–2827. [Google Scholar] [CrossRef]
  12. Sahu, S.; Dewangan, M. Analysis of heat transfer characteristics of flame impinging to a plane surface perpendicular to flame jet axis. Int. J. Eng. Res. Technol. 2013, 2, 578–593. [Google Scholar]
  13. Tajik, A.R.; Kuntikana, P.; Prabhu, S.V.; Hindasageri, V. Effect of preheated mixture on heat transfer characteristics of impinging methane–air premixed flame jet. Int. J. Heat Mass Transf. 2015, 86, 550–562. [Google Scholar] [CrossRef]
  14. Liu, Y.F.; Xiang, Q.; Li, Z.; Yao, S.Z.; Liang, X.Y.; Wang, F. Experiment and simulation investigation on the characteristics of diesel spray impingement based on droplet impact phenomenon. Appl. Sci. 2018, 8, 384. [Google Scholar] [CrossRef]
  15. Zhen, H.S.; Cheung, C.S.; Leung, C.W.; Choy, Y.S. Effects of hydrogen concentration on the emission and heat transfer of a premixed LPG-hydrogen flame. Int. J. Hyd. Energy 2012, 37, 6097–6105. [Google Scholar] [CrossRef]
  16. Zhen, H.S.; Cheung, C.S.; Leung, C.W.; Choy, Y.S. A comparison of the emission and impingement heat transfer of LPG-H2 and CH4-H2 premixed flames. Int. J. Hyd. Energy 2012, 37, 10947–10955. [Google Scholar] [CrossRef]
  17. Mohr, J.W.; Yagoobi, J.S.; Page, R.H. Combustion measurements from an impinging radial jet reattachment flame. Comb. Flame 1996, 106, 69–80. [Google Scholar] [CrossRef]
  18. Singh, G.; Chander, S.; Ray, A. Heat transfer characteristics of natural gas/air swirling flame impinging on a flat surface. Exp. Therm. Fluid Sci. 2012, 41, 165–176. [Google Scholar] [CrossRef]
  19. Singh, S.; Chander, S. Heat transfer characteristics of dual flame with outer swirling and inner non-swirling flame impinging on a flat surface. Int. J. Heat Mass Transf. 2014, 77, 995–1007. [Google Scholar] [CrossRef]
  20. Singh, S.; Chander, S. Heat transfer characteristics of dual swirling flame impinging on the flat surface. Exp. Therm. Fluid Sci. 2015, 89, 1–12. [Google Scholar] [CrossRef]
  21. Huang, X.Q.; Leung, C.W.; Chan, C.K.; Probert, S.D. Thermal characteristics of a premixed impinging circular laminar-flame jet with induced swirl. Appl. Energy 2006, 83, 401–411. [Google Scholar] [CrossRef]
  22. Zhao, Z.; Yuen, D.W.; Leung, C.W.; Wong, T.T. Thermal performance of a premixed impinging circular flame jet array with induced-swirl. Appl. Therm. Eng. 2009, 29, 159–166. [Google Scholar] [CrossRef]
  23. Luo, D.D.; Zhen, H.S.; Leung, C.W.; Cheung, C.S. Premixed flame impingement heat transfer with induced swirl. Int. J. Heat Mass Transf. 2010, 53, 4333–4336. [Google Scholar] [CrossRef]
  24. Agrawal, G.K.; Chakraborty, S.; Som, S.K. Heat transfer characteristics of premixed flame impinging upwards to plane surfaces inclined with the flame jet axis. Int. J. Heat Mass Transf. 2010, 53, 1899–1907. [Google Scholar] [CrossRef]
  25. Kwok, L.C.; Leung, C.W.; Cheung, C.S. Heat transfer characteristics of an array of impinging. Int. J. Heat Mass Transf. 2005, 48, 1727–1738. [Google Scholar] [CrossRef]
  26. Makmool, U.; Jugjai, S.; Tia, S. Structures and performances of laminar impinging multiple premixed LPG–air flames. Fuel 2013, 112, 254–262. [Google Scholar] [CrossRef]
  27. Dong, L.L.; Leung, C.W.; Cheung, C.S. Heat transfer and wall pressure characteristics of a twin. Int. J. Heat Mass Transf. 2004, 47, 489–500. [Google Scholar] [CrossRef]
  28. Dong, L.L.; Leung, C.W.; Cheung, C.S. Heat transfer of a row of three butane/air flame jets impinging on a flat plate. Int. J. Heat Mass Transf. 2003, 46, 113–125. [Google Scholar] [CrossRef]
  29. Chander, S.; Ray, A. Heat transfer characteristics of three interacting methane air flame jets impinging on a flat surface. Int. J. Heat Mass Transf. 2007, 50, 640–653. [Google Scholar] [CrossRef]
  30. Hindasageri, V.; Kuntikana, P.; Vedula, R.P.; Prabhu, S.P. An experimental and numerical investigation of heat transfer distribution of perforated plate burner flames impinging on a flat plate. Int. J. Therm. Sci. 2015, 94, 156–169. [Google Scholar] [CrossRef]
  31. Li, J.Z.; Yuan, L.; Mongia, H.C. Simulation investigation on combustion characteristics in a four-point lean direct injection combustor with hydrogen/air. Appl. Sci. 2017, 7, 619. [Google Scholar] [CrossRef]
  32. Pantangi, V.K.; Mishra, S.C.; Muthukumar, P.; Reddy, R. Studies on porous radiant burners for LPG (liquefied petroleum gas) cooking applications. Energy 2011, 36, 6074–6080. [Google Scholar] [CrossRef]
  33. Muthukumar, P.; Shyamkumar, P.I. Development of novel porous radiant burners for LPG cooking applications. Fuel 2013, 112, 562–566. [Google Scholar] [CrossRef]
  34. Boggavarapu, P.; Ray, B.; Ravikrishna, R.V. Thermal efficiency of LPG and PNG-fired burners experimental and numerical studies. Fuel 2014, 116, 709–715. [Google Scholar] [CrossRef]
  35. Wu, J.; Seyed-Yagoobi, J. Heat transfer and combustion characteristics of an array of radial jet reattachment flames. Comb. Flame 2001, 125, 955–964. [Google Scholar] [CrossRef]
  36. Tajik, A.R.; Hindasageri, V. A numerical investigation on heat transfer and emissions characteristics of impinging Radial Jet Reattachment Combustion (RJRC) flame. Appl. Therm. Eng. 2015, 89, 534–544. [Google Scholar] [CrossRef]
  37. ANSYS FLUENT Theory Guide; ANSYS Inc.: Canonsburg, PA, USA, 2013; pp. 187–194.
  38. Sorrentino, G.; Ceriello, G.; de Joannon, M.; Sabia, P.; Ragucci, R.; van Oijen, J.; Cavaliere, A.; de Goey, L.P.H. Numerical investigation of moderate or intense low-oxygen dilution combustion in a cyclonic burner using a flamelet generated manifold approach. Energy Fuels 2018, 32, 10242–10255. [Google Scholar] [CrossRef]
  39. Attarha, M.J.; Sattari-Far, I. Study on welding temperature distribution in thin welded plates through experimental measurements and finite element simulation. J. Mater. Process. Tech. 2011, 211, 688–694. [Google Scholar] [CrossRef]
  40. ANSYS FLUENT User’s Guide; ANSYS Inc.: Canonsburg, PA, USA, 2013; pp. 701–713.
Figure 1. Schematic diagram of steel preheating process using LPG/air mixture, and multiple flame jets, as well as typical expected temperature distributions of the flame jet and the steel plate.
Energies 12 00869 g001
Figure 2. Three-dimensional gas torch model.
Energies 12 00869 g002
Figure 3. One quarter of the three-dimensional domain: (a) From the gas torch exit plane to the impinged steel plate; (b) mesh model.
Energies 12 00869 g003
Figure 4. Grid independence check with increasing number of elements.
Energies 12 00869 g004
Figure 5. Experimental setup: (a) Front side; (b) Back side (1: Thermocouples, 2: TVS-200EX infrared camera, 3: Recorder for thermocouples).
Energies 12 00869 g005
Figure 6. Comparison of the temperature distribution with and without the guide vanes as a function of Y/d.
Energies 12 00869 g006
Figure 7. Temperature contours from the gas torch outlets to the steel plate at the center view (left) and side view (right) section when preheating the steel plate at Φ = 1, Re = 3483, and Y/d = 50: (a) With guide vanes; (b) without guide vanes.
Energies 12 00869 g007
Figure 8. Temperature contours at the bottom surface of the steel plate for two models at the operating conditions of Φ = 1, Re = 3483, and Y/d = 50: (a) With guide vanes; (b) without guide vanes.
Energies 12 00869 g008aEnergies 12 00869 g008b
Figure 9. Species mole fraction and temperature variations of the stoichiometric LPG/air mixture with respect to the main jet flow direction (Y/d) for Re = 3483 by numerical simulation.
Energies 12 00869 g009
Figure 10. Temperature contours on the back side of the steel plate: (a) Numerical simulation; (b) experiment results.
Energies 12 00869 g010
Figure 11. Temperature at the center point of the back side of the steel plate as a function of time during the steel preheating process.
Energies 12 00869 g011
Figure 12. Comparison of temperature distribution on the back side of the steel plate between the numerical simulation and experimental result in steady state.
Energies 12 00869 g012
Figure 13. Temperature distribution for various equivalence ratios as a function of Y/d: (a) From the gas torch outlet to the steel plate; (b) enlarged part for only the steel plate thickness.
Energies 12 00869 g013
Figure 14. Effect of the Reynolds number on temperature distribution as a function of Y/d: (a) From the gas torch outlet to the steel plate; (b) enlarged part only for the steel plate thickness.
Energies 12 00869 g014
Figure 15. Effect of the distance from the gas torch on the temperature distribution on the back side of the steel plate along the x-direction from the center to the edge.
Energies 12 00869 g015
Figure 16. Guide vane angle variation from the jet flow of the gas torch.
Energies 12 00869 g016
Figure 17. Effect of the guide vane angle variations on the temperature distribution: (a) as a function of Y/d, and (b) enlarged for only the steel plate thickness range.
Energies 12 00869 g017
Table 1. Boundary conditions and numerical simulation method.
Parameters/MethodValue/RangeNumerical Simulation Method
LPG/air mixture velocity inlet17–35 m/s-
Inlet temperature27 °C (300 K)
Outlet0 Pa-
WallNo-slip-
Process time30 minutes-
Equivalence ratio0.8–1.2-
Reynolds number2368–4876-
Dimensionless distance between the gas torch outlet and the steel plate (H/d)25–75-
Turbulence model-Standard k-ε
Combustion model-Eddy dissipation model (EDM)

